Coggon, R.M., Teagle, D.A.H., Sylvan, J.B., Reece, J., Estes, E.R., Williams, T.J., Christeson, G.L., and the Expedition 390/393 Scientists
Proceedings of the International Ocean Discovery Program Volume 390/393
publications.iodp.org
https://doi.org/10.14379/iodp.proc.390393.203.2024
Data report: X-ray fluorescence scanning of sediment cores, IODP Expedition 390/393 Site U1558, South Atlantic Transect1
Alexandra Villa,2 Chiara Amadori,2 Chiara Borrelli,2 Gail Christeson,2 Emily Estes,2 Laura Guertin,2 Jennifer Hertzberg,3 Michael R. Kaplan,2 Ravi Kiran Koorapati,4 Adriane R. Lam,2 Christopher M. Lowery,2 Andrew McIntyre,2 Julia Reece,2 Claudio Robustelli Test,2 Claire M. Routledge,2 Patricia Standring,5 Jason B. Sylvan,2 Mary Thompson,3 Yi Wang,2 Shu Ying Wee,2 Trevor Williams,2 Jesse Yeon,3 Damon A.H. Teagle,2 Rosalind M. Coggon,2 and the Expedition 390/393 Scientists2
1 Villa, A., Amadori, C., Borrelli, C., Christeson, G., Estes, E., Guertin, L., Hertzberg, J., Kaplan, M.R., Koorapati, R.K., Lam, A.R., Lowery, C.M., McIntyre, A., Reece, J., Robustelli Test, C., Routledge, C.M., Standring, P., Sylvan, J.B., Thompson, M., Wang, Y., Wee, S.Y., Williams, T., Yeon, J., Teagle, D.A.H., Coggon, R.M., and the Expedition 390/393 Scientists, 2024. Data report: X-ray fluorescence scanning of sediment cores, IODP Expedition 390/393 Site U1558, South Atlantic Transect. In Coggon, R.M., Teagle, D.A.H., Sylvan, J.B., Reece, J., Estes, E.R., Williams, T.J., Christeson, G.L., and the Expedition 390/393 Scientists, South Atlantic Transect. Proceedings of the International Ocean Discovery Program, 390/393: College Station, TX (International Ocean Discovery Program). https://doi.org/10.14379/iodp.proc.390393.203.2024
2 Expedition 390/393 Scientists’ affiliations. Correspondence author: avilla2@wisc.edu
3 Texas A&M University, United States.
4 Binghamton University, United States.
5 University of Texas at Austin, United States.
Abstract
We report semiquantitative elemental data from X-ray fluorescence (XRF) scanning of Site U1558 sediment cores drilled during International Ocean Discovery Program Expeditions 390C and 393. These expeditions, together with Expeditions 395E and 390, form the South Atlantic Transect, which collected sediment and basement cores from the western flank of the southern Mid-Atlantic Ridge. XRF scanning of the continuous splice of Site U1558, using Holes U1558A and U1558F, was conducted at three acceleration voltages to capture a range of major, minor, and trace elements. At Site U1558, positive correlations exist between terrigenous-sourced elements (Al, Si, Ti, and Fe) and a negative correlation exists between the terrigenous-sourced elements and Ca. XRF geochemistry is correlated with lithologic changes, most notably at the boundary of Lithologic Units I and II, where Unit I is brown and reddish brown nannofossil-rich clay and Unit II is pink, pinkish white, pinkish gray, and light brown nannofossil ooze and chalk with varying amounts of clay and foraminifera. Peaks in XRF data align with the boundaries of Lithologic Subunits IIA and IIB and Subunits IIB and IIC.
1. Introduction
Scientific ocean drilling has not occurred in the western South Atlantic Ocean since the Deep Sea Drilling Project (DSDP) more than 50 y ago. DSDP Leg 3 collected spot cores to verify the theories of plate tectonics and seafloor spreading (Maxwell et al., 1970). In 2020–2022, the International Ocean Discovery Program (IODP) South Atlantic Transect (SAT) Expeditions 390C, 395E, 390, and 393 drilled a series of sites at ~31°S, just south of the original Leg 3 transect, across the flank of the Mid-Atlantic Ridge on ~7 to 61 Ma crust. These sites provide new data to address fundamental questions about the role of Atlantic Ocean circulation patterns in influencing and responding to changes in Earth’s climate system during the Cenozoic. Notably, the SAT sites have captured key intervals of rapid climate change including the Paleocene–Eocene Thermal Maximum and other hyperthermals, the onset of permanent Antarctic glaciation across the Eocene–Oligocene Transition, the Miocene Climatic Optimum, the mid-Pliocene warm period, and the onset of the Northern Hemisphere glaciation (Zachos et al., 2001; Cramer et al., 2009).
Site U1558, drilled during Expeditions 390C and 393, is located on the western flank of the Mid-Atlantic Ridge (30°53′S, 24°50′W) on ~49 Ma ocean crust (Figure F1). Six holes were drilled at Site U1558 (U1558A–U1558F), but just two holes (U1558A and U1558F) recovered the entire sedimentary succession and were used to construct the splice. Hole U1558A was drilled during Expedition 390C (Estes et al., 2021), and the remaining holes were drilled during Expedition 393 (Teagle et al., 2023). The recovered sediments are divided into two main lithologic units (I and II) (Coggon et al., 2024). Unit I is composed of alternating nannofossil ooze with nannofossil-rich clay with foraminifera and is 7.5 m thick in Hole U1558A and 11.0 m thick in Hole U1558F; it is of Early Miocene age. Unit II is a nannofossil ooze transitioning into nannofossil chalk with varying amounts of clay and foraminifera; it is 145.6 m thick in Hole U1558A and 164.4 m thick in Hole U1558F. Unit II is divided into subunits (IIA–IIC); Subunit IIA is of Early Miocene to late Oligocene age, Subunit IIB is early Oligocene, and Subunit IIC is late to middle Eocene (Teagle et al., 2023). The boundary of Subunits IIB and IIC roughly marks the Eocene–Oligocene Transition (Teagle et al., 2023).
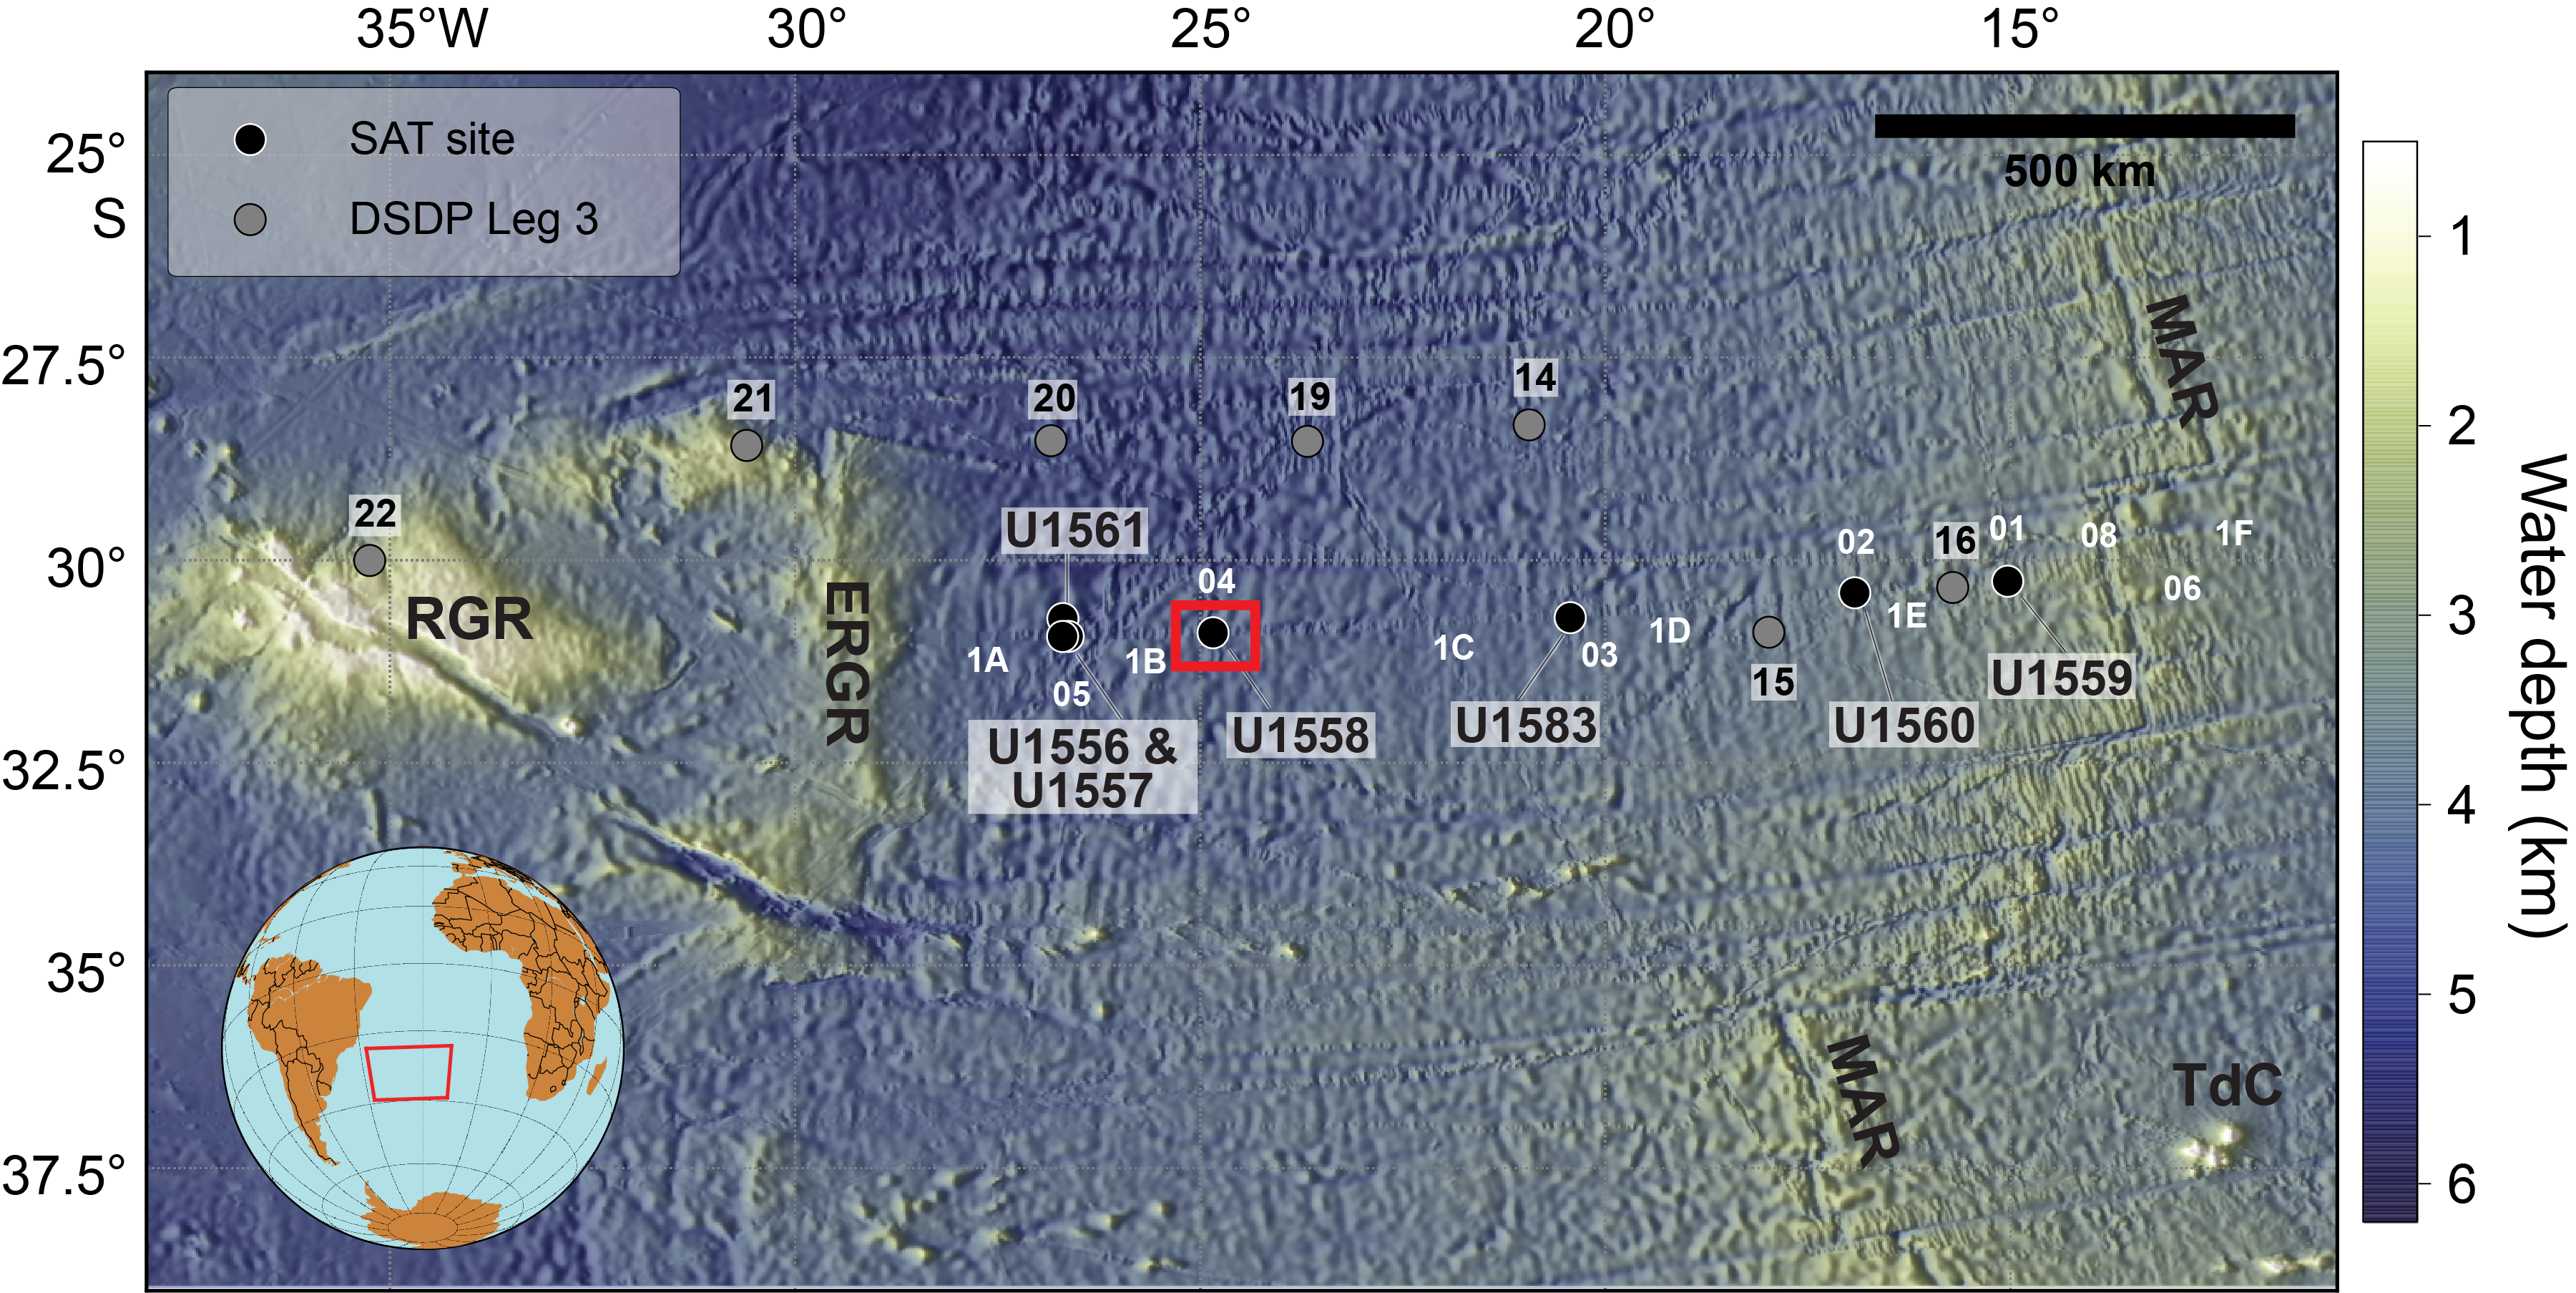
Figure F1. Expedition 390/393 drill sites.
The collection of X-ray fluorescence (XRF) core scan data at Site U1558 is an integral component of characterizing paleoceanographic changes in deep sea sediment cores because varying elements and their respective concentrations provide insight into changes in terrigenous and biogenic activity (e.g., Rothwell and Croudace, 2015). The nominal XRF scanning resolution of 5 cm was increased to 2 cm across the Eocene–Oligocene transition and throughout the Oligocene. Here, we report the quality-controlled and calibrated XRF data from Site U1558. Complementary XRF data sets have been developed for all the other SAT sites, as follows: U1556 (Wang et al., 2024), U1557 (Lowery et al., 2024), U1559 (Robustelli Test et al. , 2024), U1560 (Amadori et al., 2024), U1561 (Routledge et al., 2024), and U1583 (Lam et al., 2024).
2. Methods and materials
XRF scanning of Holes U1558A and U1558F was performed on archive section halves of core sections located on the continuous splice using the third-generation (XRF 1) and fourth-generation (XRF 2) Avaatech XRF Core Scanners at the IODP Gulf Coast Repository in College Station, Texas (USA). Both instruments were used to expedite analyses, given programmatic scanning time constraints. The instruments are fitted with a water-cooled, 100 W rhodium side-window X-ray tube, a Brightspec SiriusSD silicon drift detector, and a Topaz-X high-resolution digital multichannel analyzer. Measurements were made in the fall of 2022 during the programmatic scanning of IODP Expedition 390 and 393 sediment cores. Each archive section half was scanned at three excitation levels to measure different elements: 10 kV (with no filter) for major and minor elements (including Al, Si, K, Ca, Ti, Mn, Fe, Cr, P, S, and possibly Mg), 30 kV (with a thick Pd filter) for heavier major and minor elements and geologically relevant trace elements (including Ca, Ti, Mn, Fe, Ni, Sr, Rb, Zr, and Zn), and 50 kV (with a Cu filter) for heavier trace elements (including Sr, Rb, Zr, and Ba). Settings for the 10, 30, and 50 kV scans were, respectively, as follows: 0.15 mA (XRF 2) and 0.16 mA (XRF 1) source current, no filter, 6 second detection time; 1.24 mA (XRF 2) and 1.25 mA (XRF 1) source current, Pd filter, 6 second detection time; and 0.75 mA source current (XRF 1 and XRF 2), Cu filter, 10 second detection time. Additionally, because two scanners were used to collect XRF data, a calibration was necessary to adjust measurements between XRF 1 and XRF 2. This is the only SAT site that requires such a calibration; both uncalibrated and calibrated data are available, and here we report on the calibrated data set.
2.1. Core preparation
Archive section halves were stored at 4°C and brought to room temperature prior to scanning. Core preparation consisted of gently scraping the surface with a glass slide to ensure proper measurement on a flat and fresh surface. To avoid contamination from scraping across the core, the surface was scraped along the short dimension (width) of the core and the glass slide was cleaned after each use with a Kimwipe. Some section halves required additional scraping to remove mold or to flatten soft intervals. A 4 µm thick Ultralene plastic film was then placed on the core surface and gently rolled out to remove any air bubbles. The film was taped onto the core in places where air bubbles were especially persistent. The use of film is common practice to avoid contamination as the XRF detector moves downcore to take measurements.
2.2. Sample selection
The core sections of the continuous splice were scanned at either a 2 or 5 cm resolution. If a crack, depression, or protrusion was present, the scan point was shifted, if possible, or removed. When extended core barrel (XCB) core sections were present, biscuits of sediments (e.g., Pearson and Thomas, 2015) were common and surrounded by incredibly soft, reworked, water-saturated sediment. When possible, scan points were shifted onto the biscuit portion to obtain reliable XRF results.
Core Sections 393-U1558F-1H-1 (top of the continuous splice) through 3H-7 and 17F-2 through 24X-5 (bottom of the continuous splice) were scanned at a 5 cm resolution. The core sections in between (390C-U1558A-3H-5 through 393-U1558F-17F-1) were scanned at a 2 cm resolution to collect a higher resolution record of early Eocene to Oligocene sediments. The top of the continuous splice (Sections 1H-1 through 10H-7) was scanned on XRF 2, and the bottom of the continuous splice (Sections 390C-U1558A-11H-2 through 393-U1558F-24X-5) was scanned on XRF 1. In total, 6690 scan points were made at each acceleration voltage.
2.3. Quality control
Standard reference materials were run at all three excitation levels at the start and end of each scanning day to assess instrument stability. XRF 1 and XRF 2 each measured three standards daily, one of which was the same in both scanners. At the start of each standard run, 20 replicates were run at each excitation level, and at the end of the scanning day, no replicates were run.
Following scanning of sediment cores, XRF spectra were deconvolved and exported as count data for individual elements using the Brightspec XRF spectral processing software bAxil. We assessed data quality based on two factors in the 10 kV scan: throughput values and Ar counts. We removed samples with throughput values <150,000 counts/s (indicating a gap between the scanner and the core) and samples with positive Ar values (indicating the scanner was measuring ambient air, which was also the result of a gap between the scanner and the core). Following the quality control process, 5342 data points remained for each acceleration voltage. Data quality control was performed using an R code (R Core Team, 2023; available at https://github.com/Ravikiran2316/IODP-Exp.-390-393-XRF).
2.4. Calibration between XRF 1 and XRF 2
To calibrate measurements between XRF 1 and XRF 2, we performed a regression analysis using duplicate scans on three visibly different section halves: Cores 393-U1558F-1H-1, 2H-5, and 3H-2. All three core sections were collected with the advanced piston corer and were in excellent condition. XRF measurements were taken every 5 cm at the same depths on both scanners. In total, 180 measurements were taken across the three section halves using XRF 1 and XRF 2.
Data from these three core sections were analyzed using a linear regression to convert XRF 2 data to the XRF 1 scale. This can be described using the equation y = mx + b, where y is XRF 2 data counts, x is XRF 1 data counts, m is the slope of the line, and b is the intercept. Using the Data Analysis ToolPak Regression tool in Excel, we performed a regression analysis on all elements measured at the three excitation levels (Table T1). Using the calculated m and b values and measured x values from XRF 2, y was calculated to convert the result to equivalent XRF 1 counts. With the exception of a few elements that had low coefficient of determination (r2) values (Mo at 30 kV; As at 50 kV) or were not useful (Ar and Rh), a calibrated data set exists for the continuous splice at Site U1558 for the range of elements collected during XRF scanning.
3. Results
3.1. Correlation between elements
A series of crossplots were used to evaluate statistical correlations between XRF elements at Site U1558 (Figure F2), and a Spearman’s rank correlation was used to determine the strength of any relationships between individual element pairs (Figure F3). Elements typically associated with terrigenous sources have positive correlations with each other, such as Ti and Fe, K and Fe, and Si and Ti (Figures F2 and F3), and demonstrate similar downhole patterns, along with Al and Zr (Figure F4). The terrigenous-sourced elements (Si, Ti, Zr, Al, K, and Fe) have the strongest positive correlations (ρ > 0.92), and weaker positive correlations exist between Mn and those elements (ρ ranging 0.53–0.65). In contrast, elements associated with biogenic sources are negatively correlated to the terrigenous-sourced elements (e.g., compare Fe and Ca, Si and Ca, and Ti and Ca) (Figure F2). Br, often used as a proxy for total organic carbon in marine sediments (Ziegler et al., 2008), and Ba, a productivity proxy (Paytan et al., 1996), have a weak positive correlation. Strong negative correlations exist between Ca and the terrigenous-sourced elements (ρ ranges −0.47 to −0.69; Figure F3).
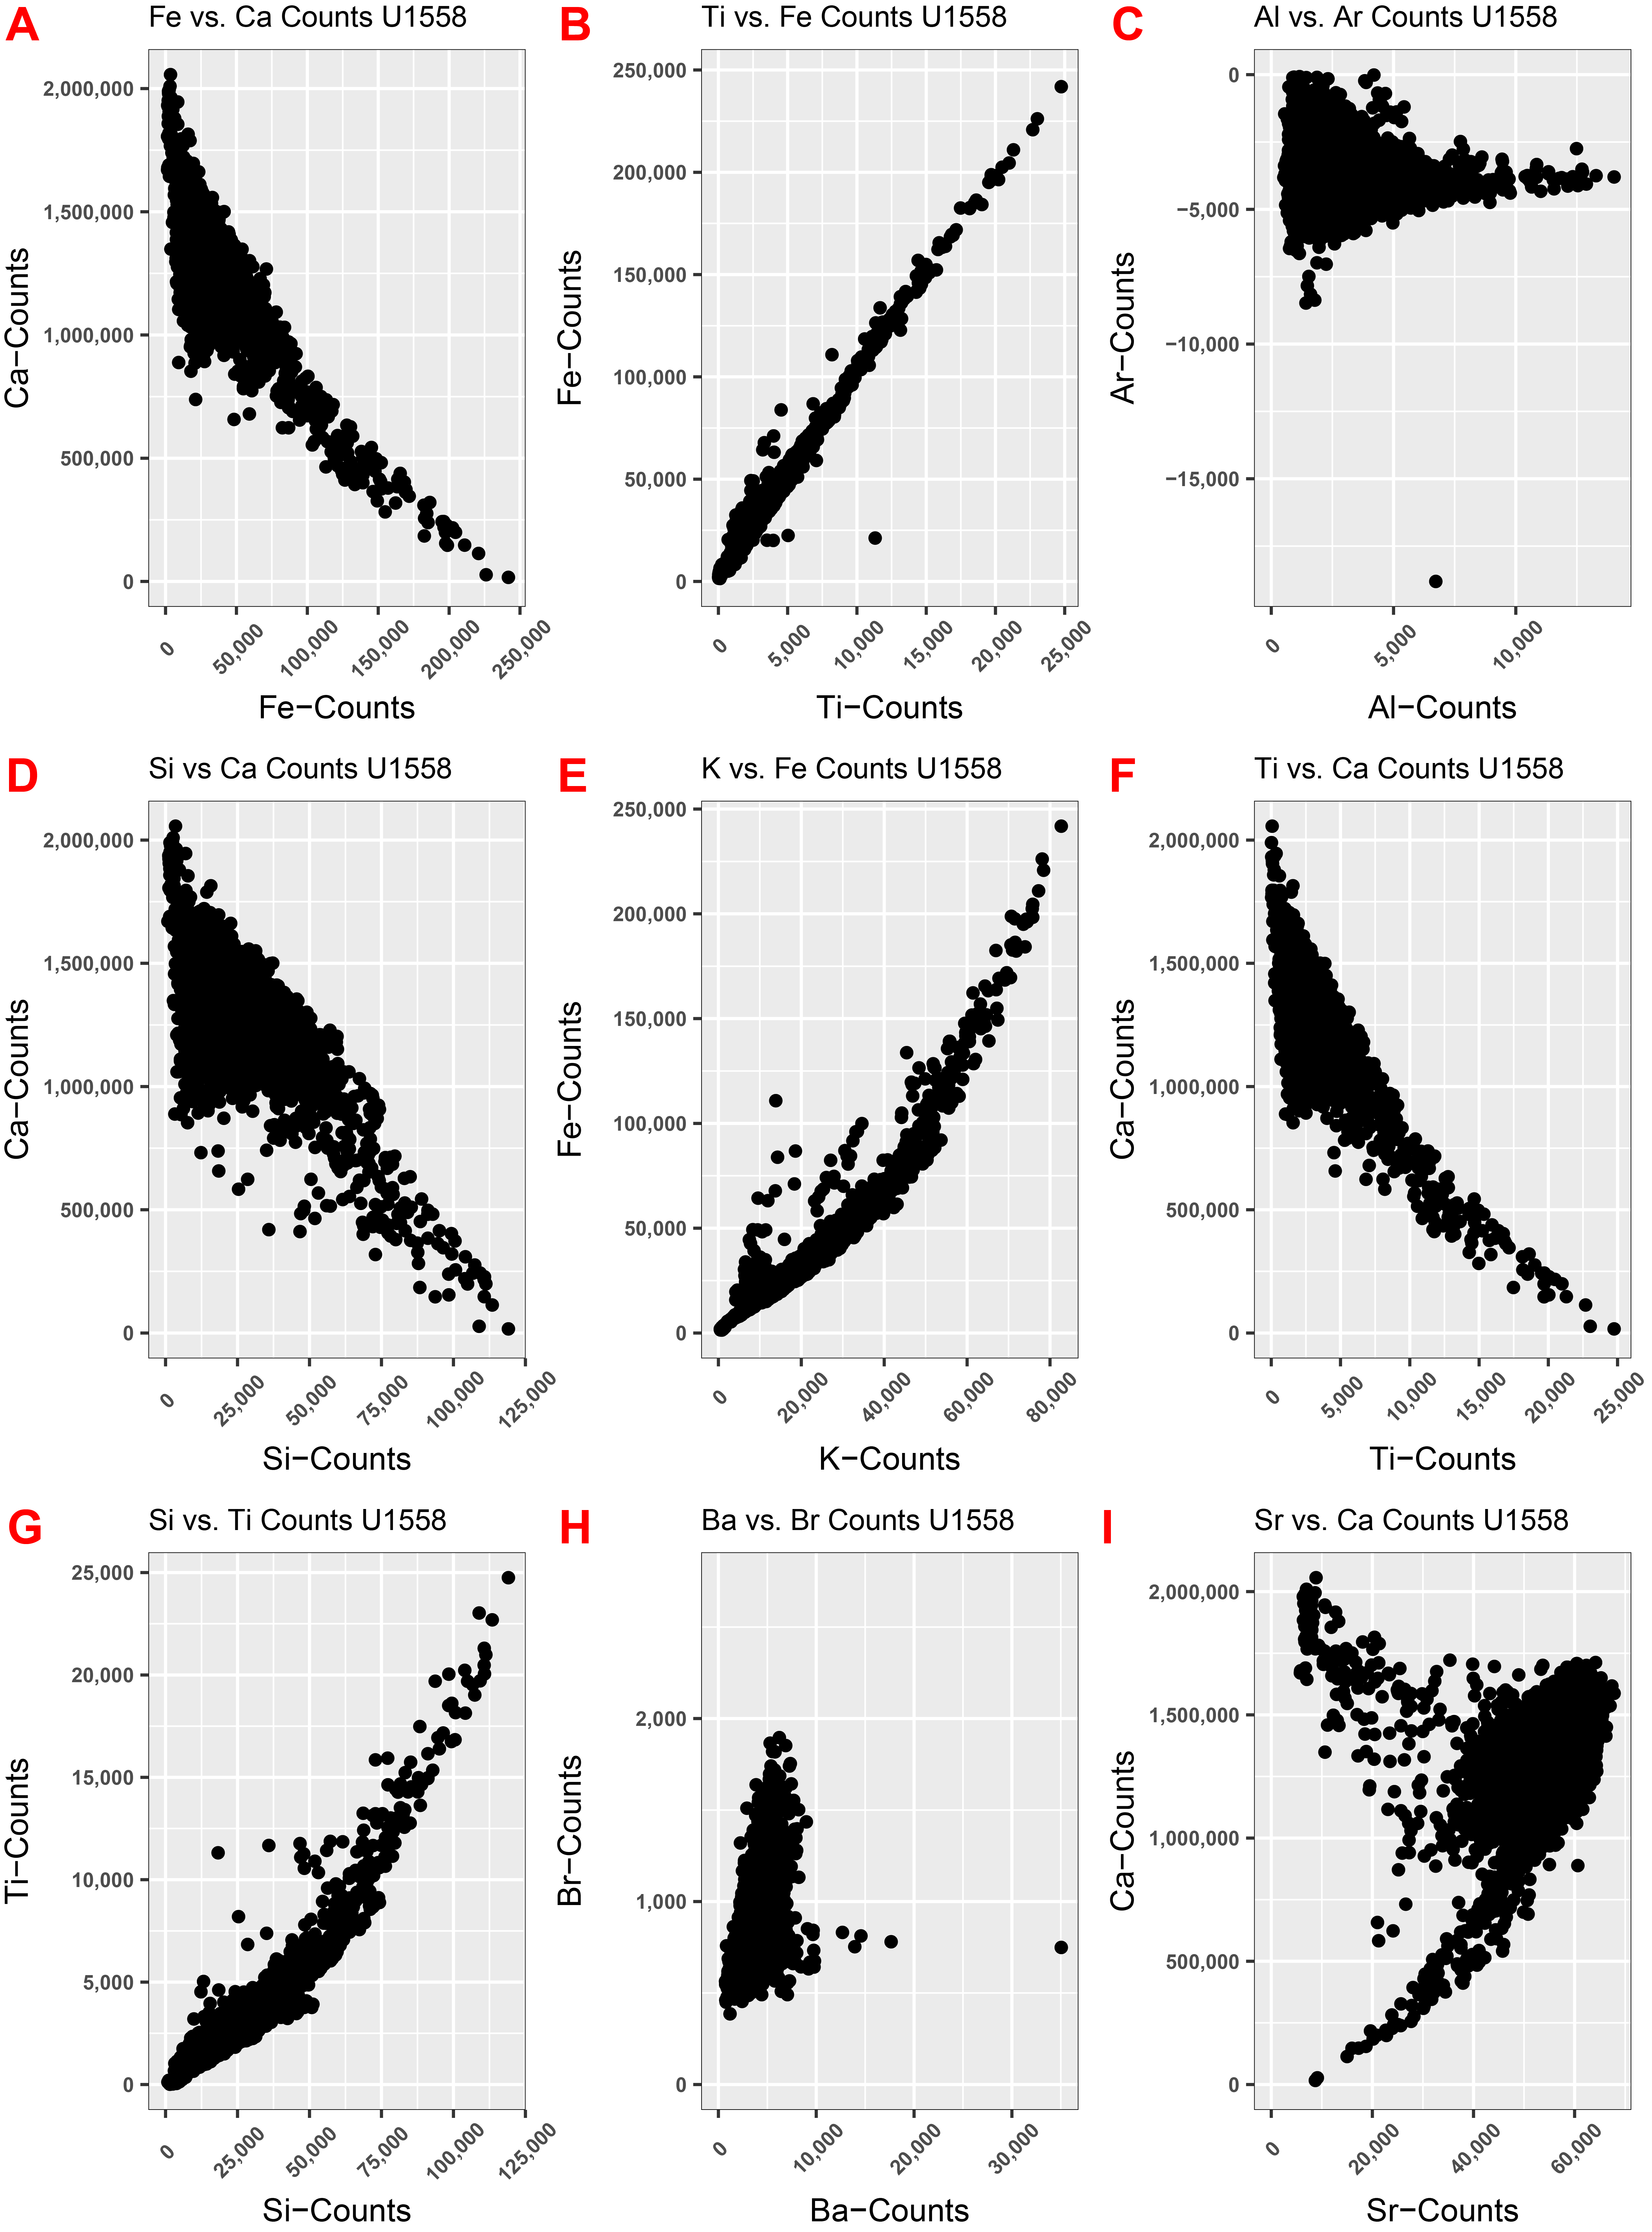
Figure F2. Crossplots of common paleoceanographically important elements.
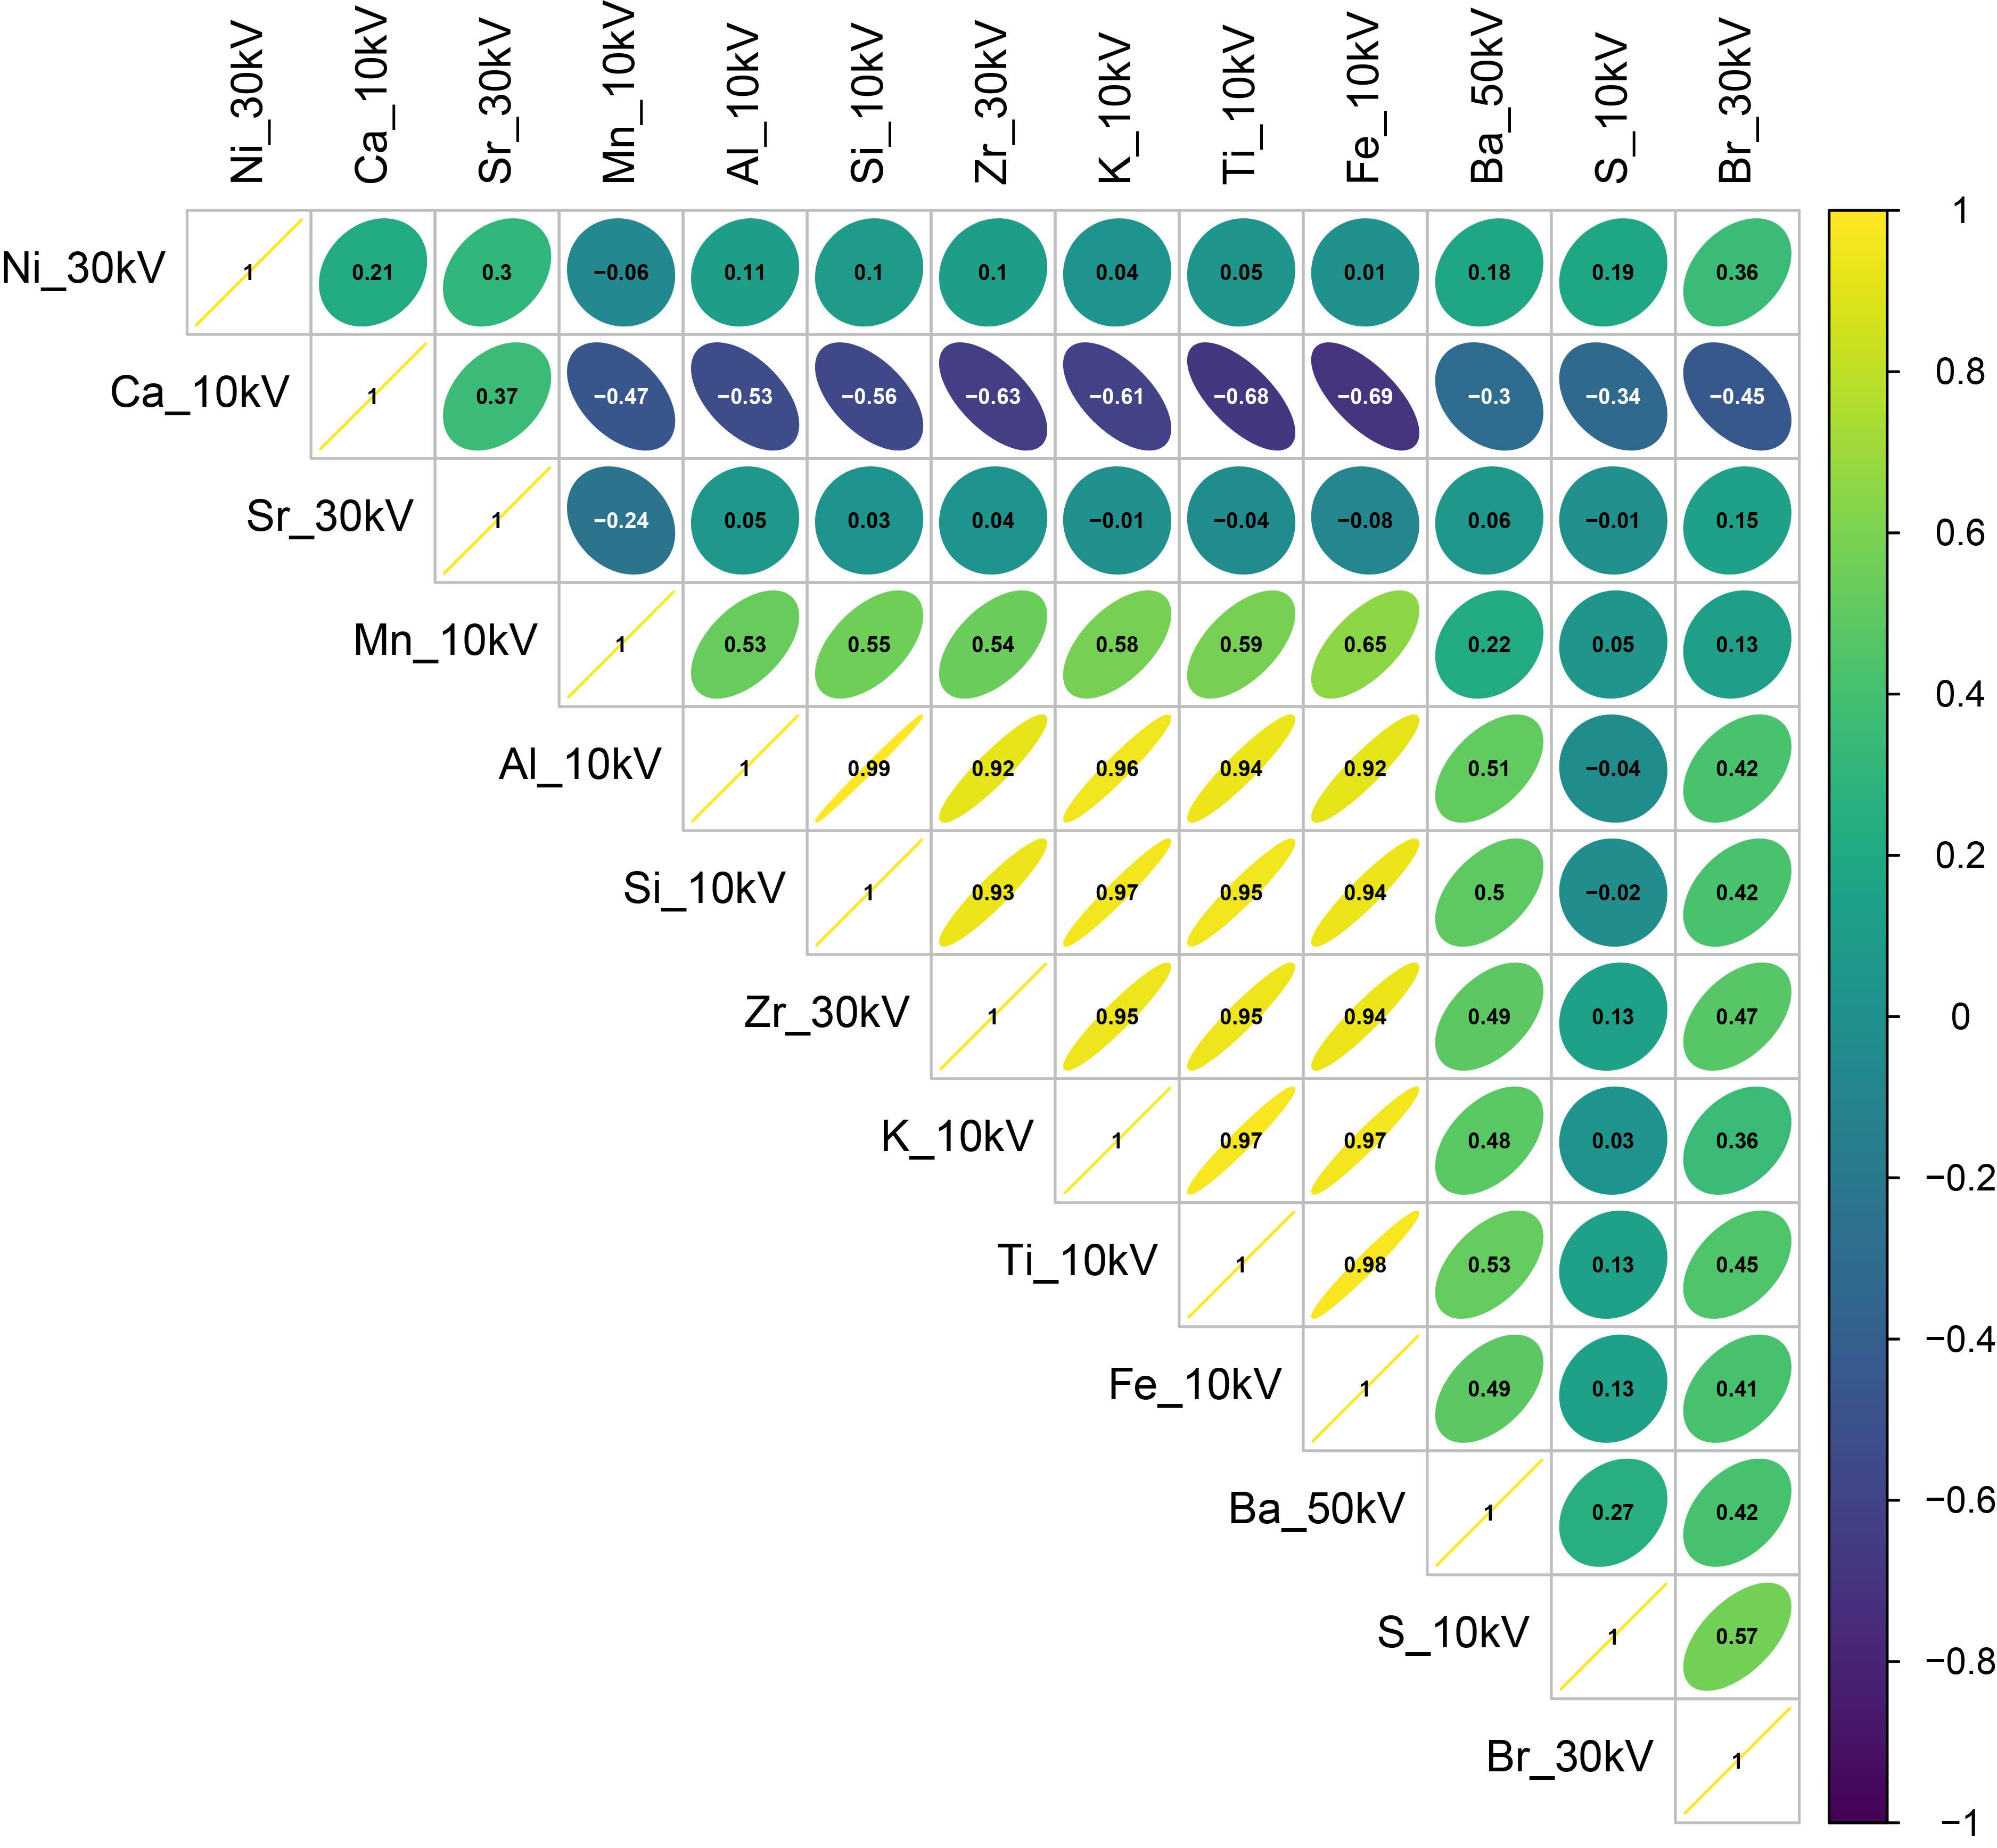
Figure F3. Correlogram for elements above XRF detection limits.
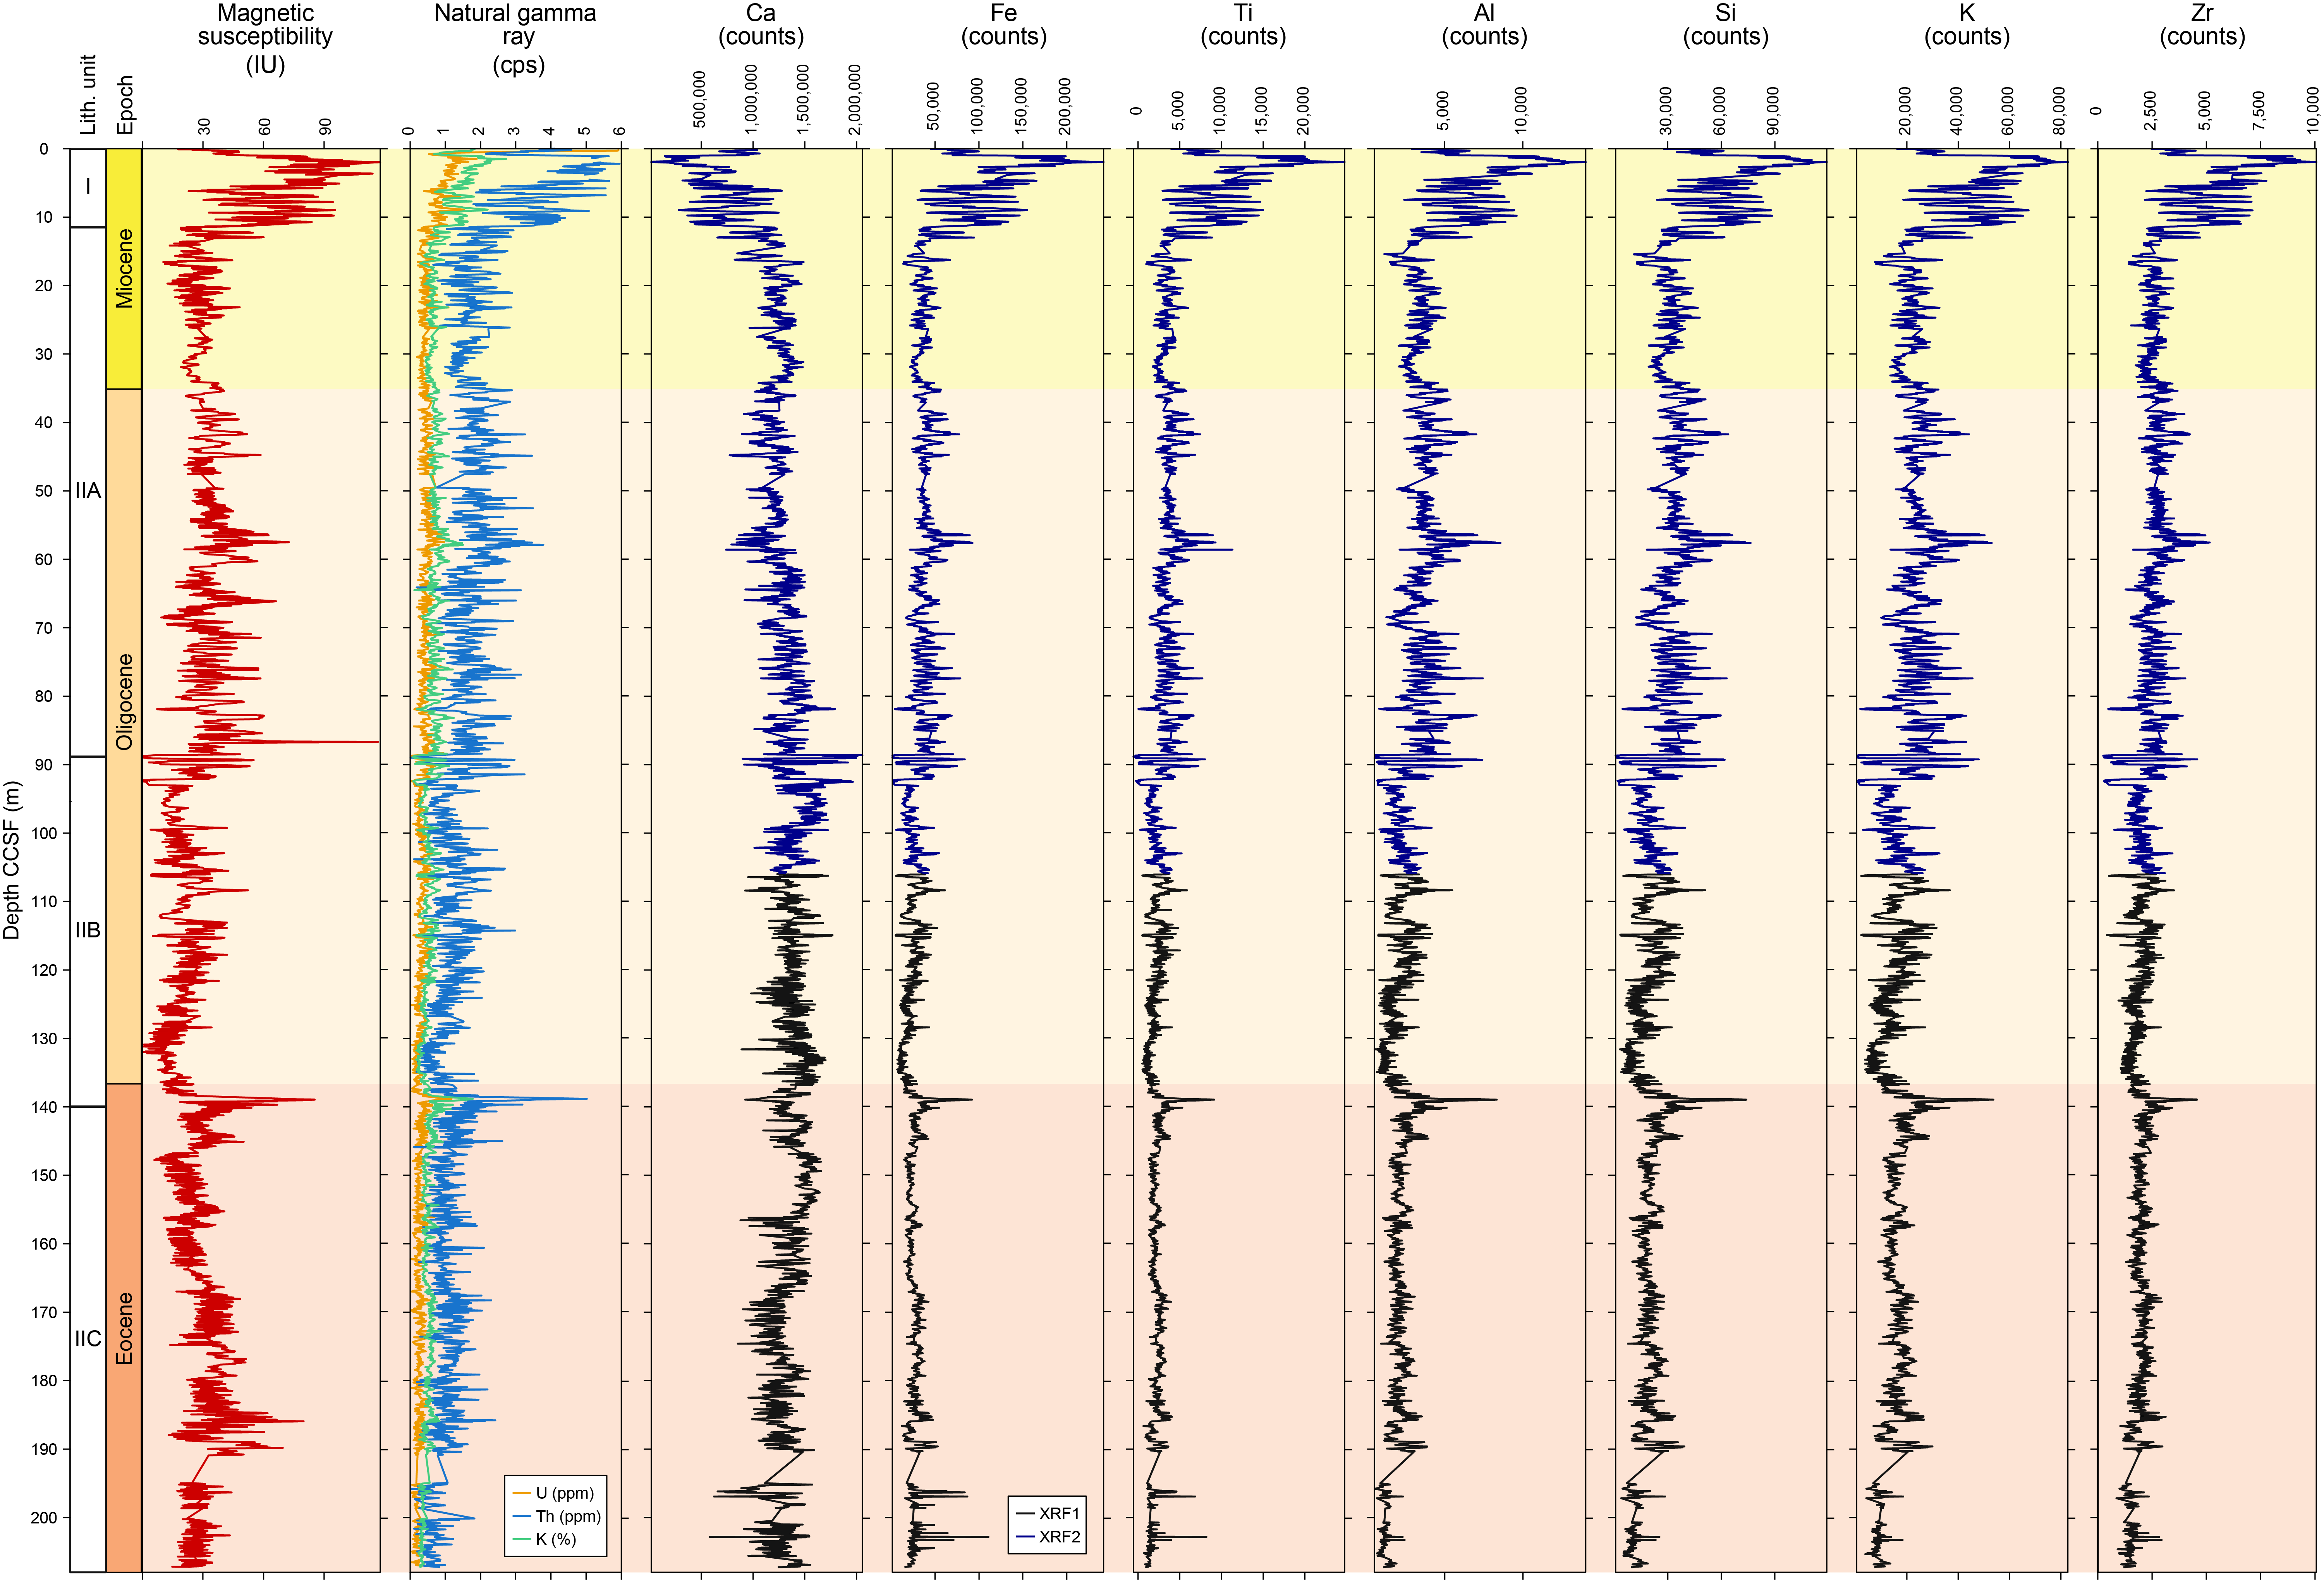
Figure F4. Magnetic susceptibility, natural gamma ray, and scanning XRF counts.
3.2. Stratigraphic trends
Select elements (Ca, Fe, Ti, Al, Si, K, and Zr) and shipboard physical properties data (magnetic susceptibility and natural gamma ray) are plotted stratigraphically alongside sedimentary units to identify stratigraphic trends in the XRF data with shipboard measurements (Figure F4). The data are plotted on the core composite depth below seafloor (CCSF) scale in meters, which is the corrected composite depth scale that accounts for overlaps, compaction, and splicing (Teagle et al., 2023). Geologic epochs, defined by the shipboard age model, are indicated (Teagle et al., 2023).
A first-order shift is present in the XRF and physical properties data coincident with the boundary between Lithologic Unit I and Subunit IIA. Unit I consists of a nannofossil-rich clay, whereas Subunit IIA (and the rest of Unit II) is nannofossil ooze to nannofossil chalk with clay (Teagle et al., 2023). Two major peaks present at around 90 and 140 m CCSF mark lithologic boundaries between Subunits IIA and IIB and Subunits IIB and IIC, respectively. The increased dominance of clays in Unit I, in comparison to Unit II, is defined by higher counts of the terrigenous source elements (Fe, Ti, Al, Si, and K). Conversely, Subunits IIA–IIC, the nannofossil ooze and nannofossil chalk units, generally have higher counts of Ca.
4. Data availability
XRF data at all three excitation levels are included here as supplementary material (see XRF in Supplementary material) and permanently archived at PANGAEA (https://Pangea.de).
5. Acknowledgments
XRF scans reported here comprise the programmatic scanning for Expeditions 390C, 395E, 390, and 393 and were funded by the National Science Foundation (NSF) in agreement with the US Science Support Program (USSSP). We also acknowledge XRF scanning travel support for US scientists administered by USSSP, travel support for Italian scientists by the Ministry of University and Research (MUR) for European Consortium for Ocean Research Drilling (ECORD)–IODP-Italia, and support of E.R. Estes and T.J. Williams through NSF award OCE1326927. We are grateful for the technicians and crew of the R/V JOIDES Resolution, without whom we would not have any cores to scan. We are also grateful to the staff of the Gulf Coast Repository, especially Michelle Penkrot, and Stephen R. Meyers at the University of Wisconsin–Madison for guidance and feedback. We thank the reviewer Francisco Jimenez Espejo for his constructive feedback that strengthened the presentation of this data set.
References
Amadori, C., Borrelli, C., Christeson, G., Estes, E., Guertin, L., Hertzberg, J., Kaplan, M.R., Koorapati, R.K., Lam, A.R., Lowery, C.M., McIntyre, A., Reece, J., Robustelli Test, C., Routledge, C.M., Standring, P., Sylvan, J.B., Thompson, M., Villa, A., Wang, Y., Wee, S.Y., Williams, T., Yeon, J., Teagle, D.A.H., Coggon, R.M., and the Expedition 390/393 Scientists, 2024. Data report: X-ray fluorescence scanning of sediment cores, IODP Expedition 390/393 Site U1560, South Atlantic Transect. In Coggon, R.M., Teagle, D.A.H., Sylvan, J.B., Reece, J., Estes, E.R., Williams, T.J., Christeson, G.L., and the Expedition 390/393 Scientists, South Atlantic Transect. Proceedings of the International Ocean Discovery Program, 390/393: College Station, TX (International Ocean Discovery Program). https://doi.org/10.14379/iodp.proc.390393.205.2024
Coggon, R.M., Teagle, D.A.H., Sylvan, J.B., Reece, J., Estes, E.R., Williams, T.J., Christeson, G.L., Aizawa, M., Albers, E., Amadori, C., Belgrano, T.M., Borrelli, C., Bridges, J.D., Carter, E.J., D’Angelo, T., Dinarès-Turell, J., Doi, N., Estep, J.D., Evans, A., Gilhooly, W.P., III, Grant, L.C.J., Guérin, G.M., Harris, M., Hojnacki, V.M., Hong, G., Jin, X., Jonnalagadda, M., Kaplan, M.R., Kempton, P.D., Kuwano, D., Labonte, J.M., Lam, A.R., Latas, M., Lowery, C.M., Lu, W., McIntyre, A., Moal-Darrigade, P., Pekar, S.F., Robustelli Test, C., Routledge, C.M., Ryan, J.G., Santiago Ramos, D., Shchepetkina, A., Slagle, A.L., Takada, M., Tamborrino, L., Villa, A., Wang, Y., Wee, S.Y., Widlansky, S.J., Yang, K., Kurz, W., Prakasam, M., Tian, L., Yu, T., and Zhang, G., 2024. Expedition 390/393 methods. In Coggon, R.M., Teagle, D.A.H., Sylvan, J.B., Reece, J., Estes, E.R., Williams, T.J., Christeson, G.L., and the Expedition 390/393 Scientists, South Atlantic Transect. Proceedings of the International Ocean Discovery Program, 390/393: College Station, TX (International Ocean Discovery Program). https://doi.org/10.14379/iodp.proc.390393.102.2024
Cramer, B.S., Toggweiler, J.R., Wright, J.D., Katz, M.E., and Miller, K.G., 2009. Ocean overturning since the Late Cretaceous: inferences from a new benthic foraminiferal isotope compilation. Paleoceanography and Paleoclimatology, 24(4):PA4216. https://doi.org/10.1029/2008PA001683
Estes, E.R., Williams, T., Midgley, S., Coggon, R.M., Sylvan, J.B.,Christeson, G.L., Teagle, D.A.H., and the Expedition 390C Scientists, 2021. Expedition 390C Preliminary Report: South Atlantic Transect Reentry Systems. International Ocean Discovery Program. https://doi.org/10.14379/iodp.pr.390C.2021
Lam, A.R., Amadori, C., Borrelli, C., Christeson, G., Estes, E., Guertin, L., Hertzberg, J., Kaplan, M.R., Koorapati, R.K., Lowery, C.M., McIntyre, A., Reece, J.S., Robustelli Test, C., Routledge, C.M., Standring, P., Sylvan, J.B., Thompson, M., Villa, A., Wang, Y., Wee, S.Y., Williams, T., Yeon, J., Teagle, D.A.H., Coggon, R.M., and the Expedition 390/393 Scientists, 2024. Data report: X-ray fluorescence scanning of sediment cores, IODP Expedition 390/393 Site U1583, South Atlantic Transect. In Coggon, R.M., Teagle, D.A.H., Sylvan, J.B., Reece, J., Estes, E.R., Williams, T.J., Christeson, G.L., and the Expedition 390/393 Scientists, South Atlantic Transect. Proceedings of the International Ocean Discovery Program, 390/393: College Station, TX (International Ocean Discovery Program). https://doi.org/10.14379/iodp.proc.390393.202.2024
Lowery, C.M., Amadori, C., Borrelli, C., Christeson, G., Estes, E., Guertin, L., Hertzberg, J., Kaplan, M.R., Koorapati, R.K., Lam, A.R., McIntyre, A., Reece, J., Robustelli Test, C., Routledge, C.M., Standring, P., Sylvan, J.B., Thompson, M., Villa, A., Wang, Y., Wee, S.Y., Williams, T., Yeon, J., Teagle, D.A.H., Coggon, R.M., and the Expedition 390/393 Scientists, 2024. Data report: X-ray fluorescence scanning of sediment cores, Site U1557, South Atlantic Transect. In Coggon, R.M., Teagle, D.A.H., Sylvan, J.B., Reece, J., Estes, E.R., Williams, T.J., Christeson, G.L., and the Expedition 390/393 Scientists, South Atlantic Transect. Proceedings of the International Ocean Discovery Program, 390/393: College Station, TX (International Ocean Discovery Program). https://doi.org/10.14379/iodp.proc.390393.201.2024
Maxwell, A.E., Von Herzen, R.P., Andrews, J.E., Boyce, R.E., Milow, E.D., Hsu, K.J., Percival, S.F., and Saito, T., 1970. Initial Reports of the Deep Sea Drilling Project, 3: Washington, DC (U.S. Government Printing Office). https://doi.org/10.2973/dsdp.proc.3.1970
Paytan, A., Kastner, M., and Chavez, F.P., 1996. Glacial to interglacial fluctuations in productivity in the equatorial Pacific as indicated by marine barite. Science, 274(5291):1355–1357.
https://doi.org/10.1126/science.274.5291.1355
Pearson, P.N., and Thomas, E., 2015. Drilling disturbance and constraints on the onset of the Paleocene–Eocene boundary carbon isotope excursion in New Jersey. Climate of the Past, 11(1):95–104.
https://doi.org/10.5194/cp-11-95-2015
R Core Team, 2023. R: A language and environment for statistical computing. R Foundation for Statistical Computing. https://www.r-project.org/
Robustelli Test, C., Amadori, C., Borrelli, C., Christeson, G., Estes, E., Guertin, L., Hertzberg, J., Kaplan, M.R., Koorapati, R.K., Lam, A.R., Lowery, C.M., McIntyre, A., Reece, J., Routledge, C.M., Standring, P., Sylvan, J.B., Thompson, M., Villa, A., Wang, Y., Wee, S.Y., Williams, T., Yeon, J., Teagle, D.A.H., Coggon, R.M., and the Expedition 390/393 Scientists, 2024. Data report: X-ray fluorescence scanning of sediment cores, IODP Expedition 390/393 Site U1559, South Atlantic Transect. In Coggon, R.M., Teagle, D.A.H., Sylvan, J.B., Reece, J., Estes, E.R., Williams, T.J., Christeson, G.L., and the Expedition 390/393 Scientists, South Atlantic Transect. Proceedings of the International Ocean Discovery Program, 390/393: College Station, TX (International Ocean Discovery Program). https://doi.org/10.14379/iodp.proc.390393.204.2024
Rothwell, R.G., and Croudace, I.w., 2015. Twenty years of XRF core scanning marine sediments: what do geochemical proxies tell us? In Croudace, I.W., and Rothwell, R.G. (Eds.), Micro-XRF Studies of Sediment Cores: Applications of a non-destructive tool for the environmental sciences. Dordrecht (Springer Netherlands), 25–102.
https://doi.org/10.1007/978-94-017-9849-5_2
Routledge, C.M., Amadori, C., Borrelli, C., Christeson, G., Estes, E., Guertin, L., Hertzberg, J., Kaplan, M.R., Koorapati, R.K., Lam, A.R., Lowery, C.M., McIntyre, A., Reece, J., Robustelli Test, C., Standring, P., Sylvan, J.B., Thompson, M., Villa, A., Wang, Y., Wee, S.Y., Williams, T., Yeon, J., Teagle, D.A.H., Coggon, R.M., and the Expedition 390/393 Scientists, 2024. Data report: X-ray fluorescence scanning of sediment cores, IODP Expedition 390/393 Site U1561, South Atlantic Transect. In Coggon, R.M., Teagle, D.A.H., Sylvan, J.B., Reece, J., Estes, E.R., Williams, T.J., Christeson, G.L., and the Expedition 390/393 Scientists, South Atlantic Transect. Proceedings of the International Ocean Discovery Program, 390/393: College Station, TX (International Ocean Discovery Program). https://doi.org/10.14379/iodp.proc.390393.207.2024
Teagle, D.A.H., Reece, J., Coggon, R.M., Sylvan, J.B., Christeson, G.L., Williams, T.J., Estes, E.R., and the Expedition 393 Scientists, 2023. Expedition 393 Preliminary Report: South Atlantic Transect 2. International Ocean Discovery Program. https://doi.org/10.14379/iodp.pr.393.2023
Villa, A., Amadori, C., Borrelli, C., Christeson, G., Estes, E., Guertin, L., Hertzberg, J., Kaplan, M.R., Koorapati, R.K., Lam, A.R., Lowery, C.M., McIntyre, A., Reece, J., Robustelli Test, C., Routledge, C.M., Standring, P., Sylvan, J.B., Thompson, M., Wang, Y., Wee, S.Y., Williams, T., Yeon, J., Teagle, D.A.H., Coggon, R.M., and the Expedition 390/393 Scientists, 2024. Supplementary material, https://doi.org/10.14379/iodp.proc.390393.203supp.2024. In Villa, A., Amadori, C., Borrelli, C., Christeson, G., Estes, E., Guertin, L., Hertzberg, J., Kaplan, M.R., Koorapati, R.K., Lam, A.R., Lowery, C.M., McIntyre, A., Reece, J., Robustelli Test, C., Routledge, C.M., Standring, P., Sylvan, J.B., Thompson, M., Wang, Y., Wee, S.Y., Williams, T., Yeon, J., Teagle, D.A.H., Coggon, R.M., and the Expedition 390/393 Scientists. Data report: X-ray fluorescence scanning of sediment cores, IODP Expedition 390/393 Site U1558, South Atlantic Transect. In Coggon, R.M., Teagle, D.A.H., Sylvan, J.B., Reece, J., Estes, E.R., Williams, T.J., Christeson, G.L., and the Expedition 390/393 Scientists, South Atlantic Transect. Proceedings of the International Ocean Discovery Program, 390/393: College Station, TX (International Ocean Discovery Program)
Wang, Y., Amadori, C., Borrelli, C., Christeson, G., Estes, E., Guertin, L., Hertzberg, J., Kaplan, M.R., Koorapati, R.K., Lam, A.R., Lowery, C.M., McIntyre, A., Reece, J., Robustelli Test, C., Routledge, C.M., Standring, P., Sylvan, J.B., Thompson, M., Villa, A., Wee, S.Y., Williams, T., Yeon, J., and the Expedition 390/393 Scientists, 2024. Data report: X-ray fluorescence scanning of sediment cores, IODP Expedition 390/393 Site U1556, South Atlantic Transect. In Coggon, R.M., Teagle, D.A.H., Sylvan, J.B., Reece, J., Estes, E.R., Williams, T.J., Christeson, G.L., and the Expedition 390/393 Scientists, South Atlantic Transect. Proceedings of the International Ocean Discovery Program, 390/393: College Station, TX (International Ocean Discovery Program). https://doi.org/10.14379/iodp.proc.390393.206.2024
Zachos, J., Pagani, M., Sloan, L., Thomas, E., and Billups, K., 2001. Trends, rhythms, and aberrations in global climate 65 Ma to Present. Science, 292(5517):686–693. https://doi.org/10.1126/science.1059412
Ziegler, M., Jilbert, T., de Lange, G.J., Lourens, L.J., and Reichart, G.-J., 2008. Bromine counts from XRF scanning as an estimate of the marine organic carbon content of sediment cores. Geochemistry, Geophysics, Geosystems, 9(5). https://doi.org/10.1029/2007GC001932