Coggon, R.M., Teagle, D.A.H., Sylvan, J.B., Reece, J., Estes, E.R., Williams, T.J., Christeson, G.L., and the Expedition 390/393 Scientists
Proceedings of the International Ocean Discovery Program Volume 390/393
publications.iodp.org
https://doi.org/10.14379/iodp.proc.390393.210.2024
Data report: high downhole resolution portable X-ray fluorescence geochemistry of South Atlantic Transect basement cores, IODP Expeditions 390C, 395E, 390, and 3931
Mallika K. Jonnalagadda,2* Thomas M. Belgrano,2* Jeffrey G. Ryan,2 Pamela D. Kempton,2 Aled D. Evans,2 Lewis J.C. Grant,2 Damon A.H. Teagle,2 Rosalind M. Coggon,2 Julia S. Reece,2 Jason B. Sylvan,2 Trevor J. Williams,2 Emily R. Estes,2 and the Expedition 390/393 Scientists2
1 Jonnalagadda, M.K., Belgrano, T.M., Ryan, J.G., Kempton, P.D., Evans, A.D., Grant, L.J.C., Teagle, D.A.H., Coggon, R.M., Reece, J.S., Sylvan, J.B., Williams, T.J., Estes, E.R., and the Expedition 390/393 Scientists, 2024. Data report: high downhole resolution portable X-ray fluorescence geochemistry of South Atlantic Transect basement cores, IODP Expeditions 390C, 395E, 390, and 393. In Coggon, R.M., Teagle, D.A.H., Sylvan, J.B., Reece, J., Estes, E.R., Williams, T.J., Christeson, G.L., and the Expedition 390/393 Scientists, South Atlantic Transect. Proceedings of the International Ocean Discovery Program, 390/393: College Station, TX (International Ocean Discovery Program). https://doi.org/10.14379/iodp.proc.390393.210.2024
2 Expedition 390/393 Scientists’ affiliations. Correspondence authors: jmallika@gmail.com, thomas.belgrano@ucd.ie
* These two authors contributed equally to this work.
Abstract
This report presents portable X-ray fluorescence (pXRF) geochemistry for lavas with mid-ocean-ridge to ocean-island basalt–like compositions recovered from the western flank of the Mid-Atlantic Ridge across the South Atlantic Transect (SAT) during International Ocean Discovery Program (IODP) Expeditions 390C, 395E, 390, and 393. The Bruker Tracer 5 pXRF spectrometer proved an effective tool for rapid, high downhole resolution determination of select major, minor (K, Ca, Ti, Mn, and Fe), and trace (V, Cr, Ni, Cu, Zn, Rb, Sr, Y, and Zr) elements on split core surfaces. Initial shipboard calibrations reported in the Expedition 390/393 Proceedings are improved upon and superseded here with an element-by-element refinement of secondary calibration curves and a thorough assessment of instrument drift and matrix effects between rock powders and sawed surfaces. Matrix corrections for Zr, Ti, and Y were necessary to align the pXRF data with shipboard inductively coupled plasma–atomic emission spectroscopy (ICP-AES) results for one of the pXRF analytical campaigns. Additional Zr drift corrections further improved the Expedition 390 data compared to shipboard ICP-AES. Replicate analyses of rock surface standards demonstrate precision of ≤11% RSD (relative standard deviation) for most analytes, with poorer precision only for V and Rb (≤25% RSD). Although less precise than ICP methods, demonstrable accuracy, differentiation of background and alteration halo analyses, and typical downcore spacing of 0.5–1 m make these data sets a useful tool for addressing SAT objectives related to volcanostratigraphy and hydrothermal exchange.
1. Introduction
This report presents reprocessed core-surface portable X-ray fluorescence (pXRF) major and trace element compositions for volcanic rocks recovered by drilling during International Ocean Discovery Program (IODP) Expeditions 390C, 395E, 390, and 393 across the South Atlantic Transect (SAT). The SAT samples a crustal flow line on the western flank of the Mid-Atlantic Ridge at ~31°S, produced at slow to medium spreading rates from 61 to 7 Ma (Coggon et al., 2024). This report presents data for all the main basement-penetrating SAT sites: U1559 (6.6 Ma), U1560 (15.2 Ma), U1583 (30.6 Ma), U1558 (49.2 Ma), U1556 (61.2 Ma), and U1557 (61.2 Ma).
Lavas with mid-ocean-ridge basalt (MORB) to ocean-island basalt (OIB)–like compositions were cored at these sites and analyzed using pXRF. These lavas were variably erupted as pillow, sheet, and massive flows and in some cases are preserved as clasts in volcaniclastic breccias. The lavas have aphyric (<1 vol% phenocrysts) to highly phyric (>10 vol% phenocrysts) textures, with varying proportions of plagioclase, olivine, and clinopyroxene phenocrysts. The cores recovered along the SAT are hydrothermally altered to varying degrees, from slightly altered, with fresh olivine and mostly fresh groundmass, to highly or completely altered, with pervasive recrystallization of olivine and groundmass to clays, Fe-oxyhydroxides, and other secondary minerals (Coggon et al., 2024).
Core surface pXRF data were acquired and processed with two main applications in mind: high downcore resolution definition of volcanostratigraphy and assessment of hydrothermal element mobility. Robustly calibrated, these data can be used for addressing these objectives. However, they are also useful for guiding discrete sampling. During Expedition 393, pXRF analyses helped to inform drilling decisions and visual core descriptions in near–real time using initially calibrated data on board the R/V JOIDES Resolution. During Expedition 390, shipboard analyses were initially made with a less sensitive pXRF instrument; hence, the cores were reanalyzed postcruise with an instrument and workflow similar to that of Expedition 393.
Initial shipboard pXRF analyses, processed by a more simplistic calibration, appeared in the SAT Preliminary Reports and Expedition Proceedings (Coggon et al., 2024). The reanalyzed or reprocessed data sets presented here supersede these previous iterations.
1.1. Background
Rapid, cost-effective, and nondestructive methods like pXRF have proven useful for determining the concentrations of select major and trace elements in geological samples (Lemière, 2018). Recent technological advances have led to the deployment of lightweight, robust pXRF instruments, making applications in various geological and archaeological field settings possible (e.g., Triantafyllou et al., 2021; Durance et al., 2014), including IODP expeditions. A Thermo Scientific Niton XL3 Analyzer was first applied with some success to basalts on Expedition 330 (Expedition 330 Scientists, 2012) and again on Expedition 335 (Expedition 335 Scientists, 2012) to gabbroic and basaltic rocks. During Expedition 352, a more sensitive Fisher Niton XL3t GOLDD+ instrument was employed with success to discriminate fore-arc volcanostratigraphy and allow robust scientific interpretations to be made ahead of postcruise discrete sample analysis (Reagan et al., 2017; Ryan et al., 2017). This success, however, has hitherto been largely restricted to resolving relatively distinct compositional variations, for example Cr, Ti, Zr, and Sr variations between tholeiitic basalts and boninites during Expedition 352 (Ryan et al., 2017). The capability of pXRF for resolving stratigraphy within more compositionally uniform volcanic sequences such as those found at mid-ocean ridges and for detecting subtle hydrothermal element exchanges is less explored but was a central aim of the SAT pXRF campaigns and reprocessing presented here.
2. Methods and materials
The data reported here were analyzed over two similarly implemented campaigns, with cores from Expedition 393 analyzed on board JOIDES Resolution in June and July 2022 and cores from Expedition 390 analyzed at Texas A&M University (USA) in November 2022.
2.1. Reference materials and rock surface standards
Reference materials used for calibration and validation purposes cover a range in composition that bracket all compositions encountered in the basement along the SAT (Table T1). A few grams of each reference powder were mounted in polymer holders and covered by Chemplex Prolene film (Figure F1D).
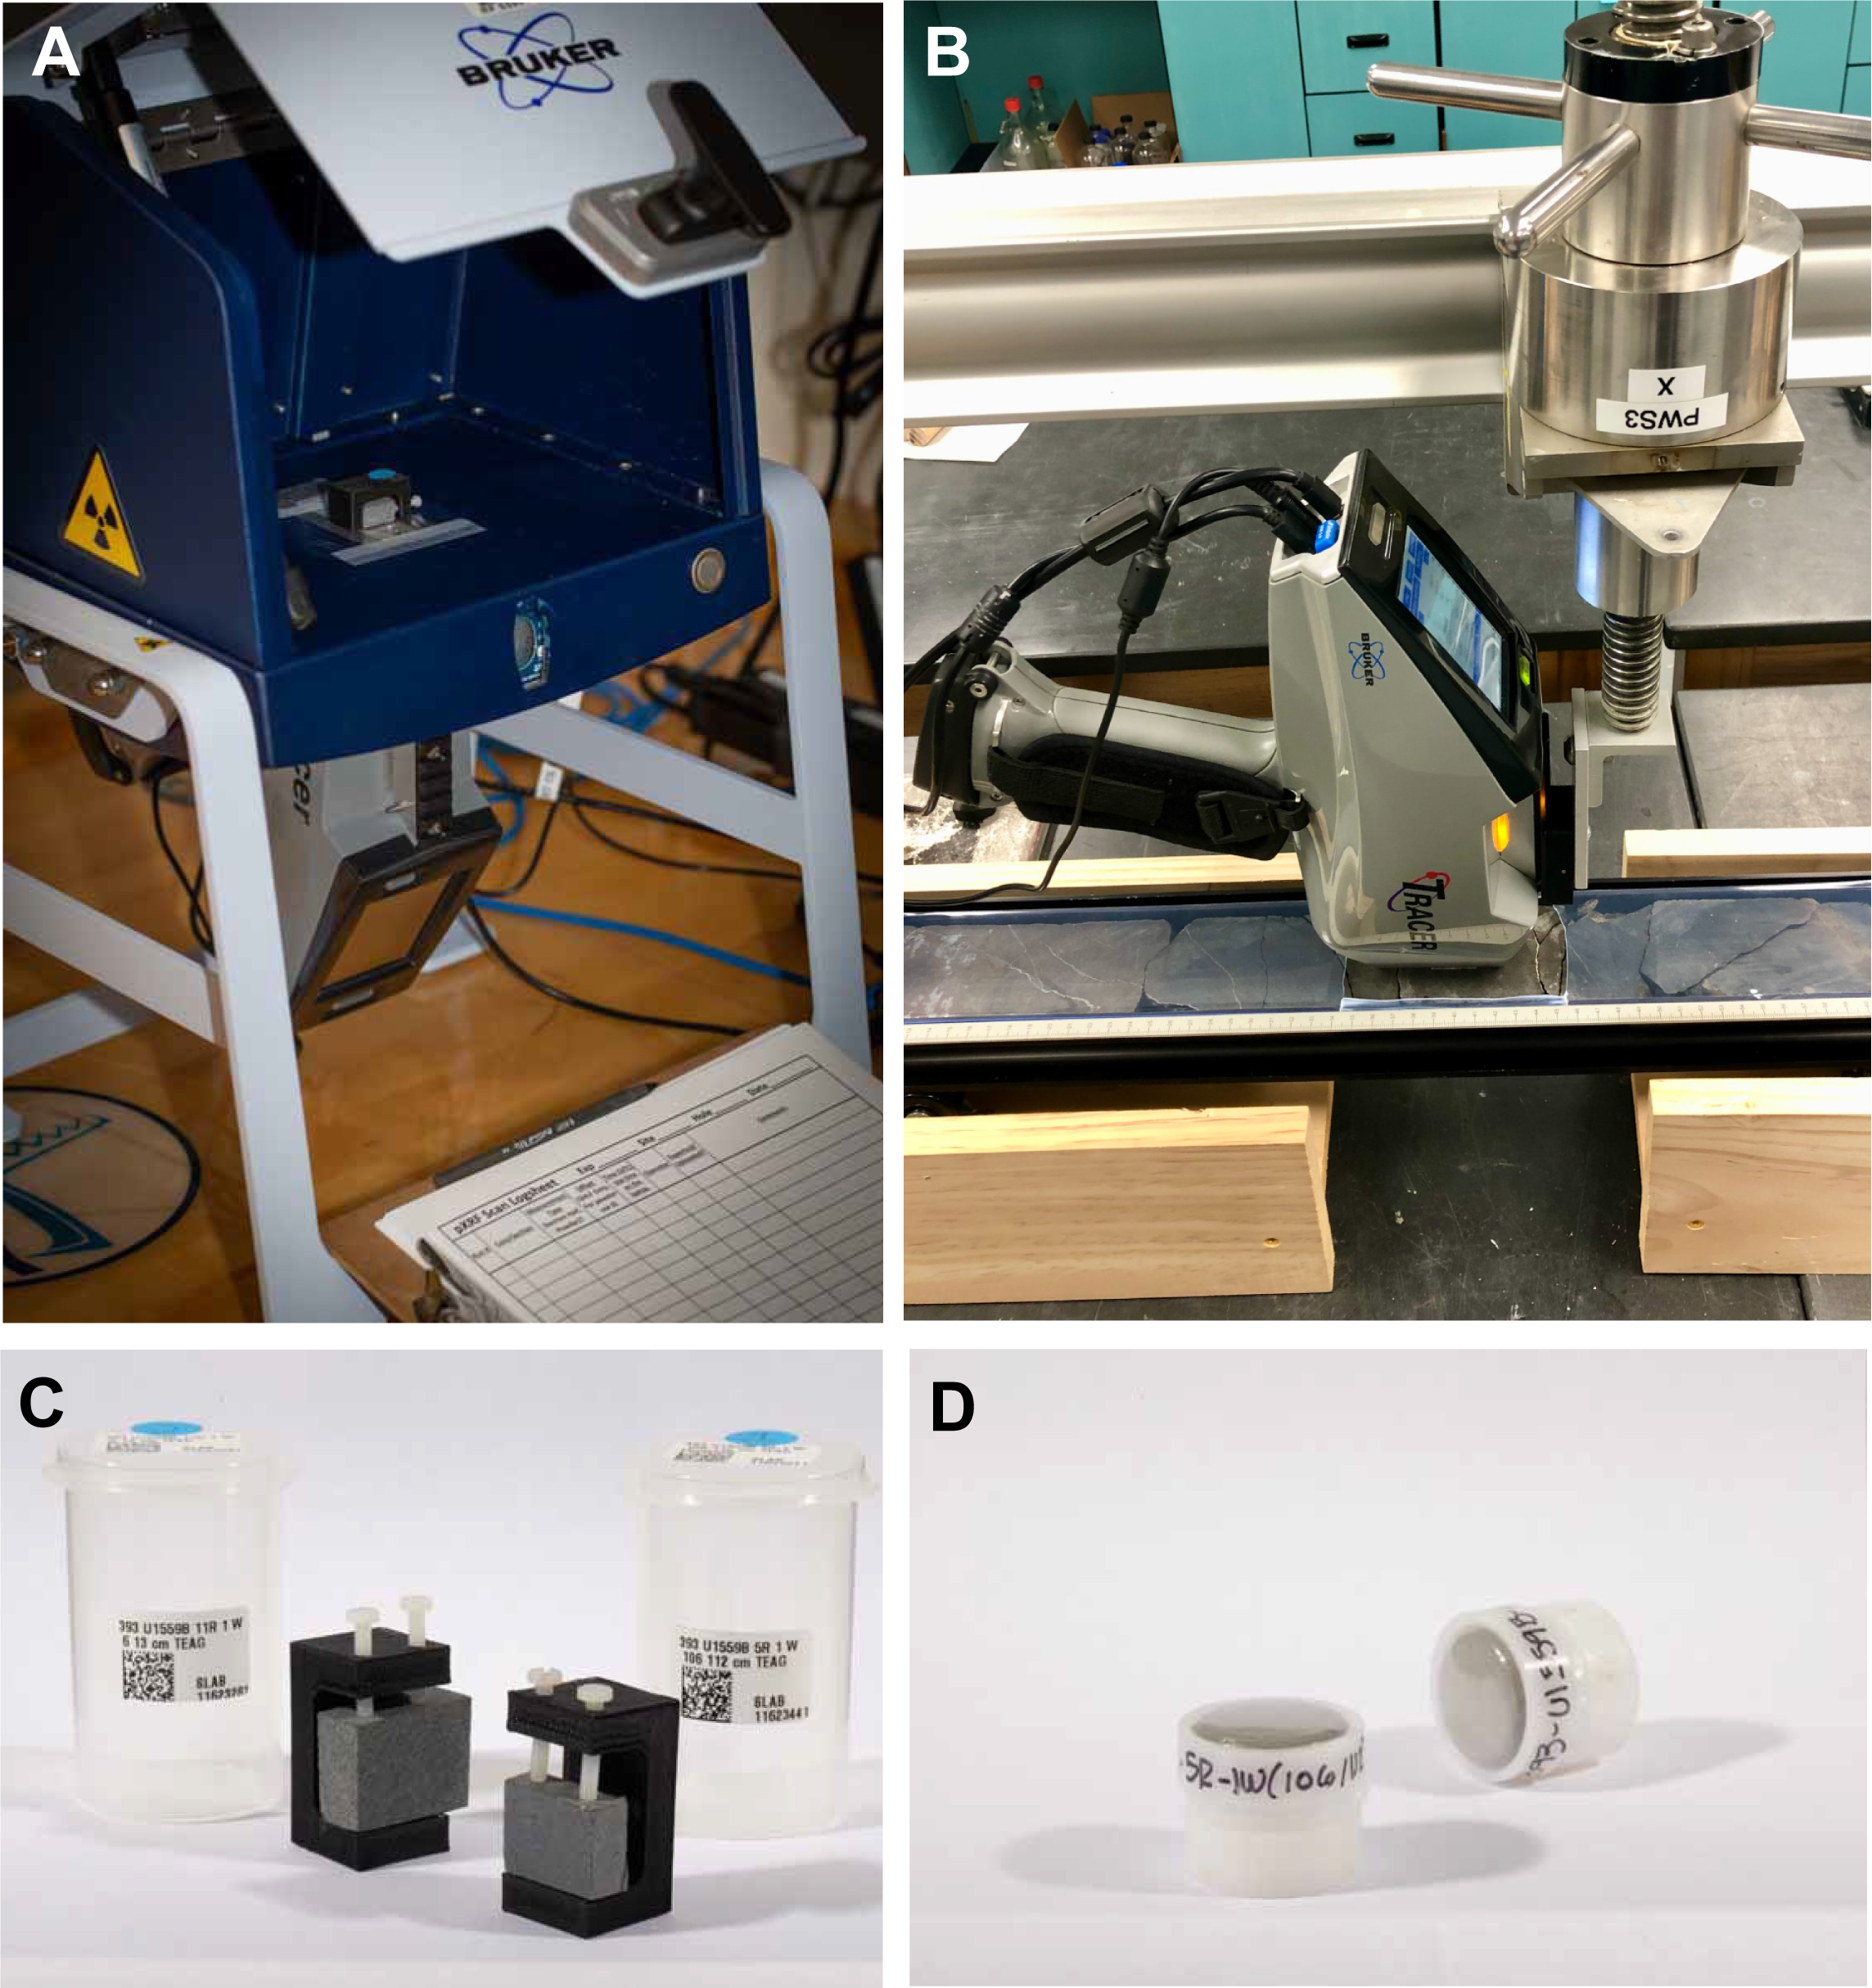
Figure F1. pXRF setup, internal rock surface standards, and film-capped polymer holders.
Rock surface standards for internal use were produced during Expedition 393 to aid assessment of instrument drift and matrix effects between powders and rock surfaces (Figure F1C). These rock standards were cut from the visually most homogeneous, fresh, and aphyric basalt available at Expedition 393’s first Site U1559. The two standards have slightly depleted MORB compositions, with rock standard 393-U1559B-11R-1W-6-13 (abbreviated as RS-11R) having a microcrystalline texture and 393-U1559B-5R-1W-106-112 (abbreviated as RS-5R) being cryptocrystalline (Figure F1C). Basalt cuboids with 15–25 mm sides were split in two, with one face mounted for pXRF analysis (Figure F1C) and the other powdered and analyzed by shipboard ICP-AES (see PXRF in Supplementary material).
2.2. Instrumental methods
For Expedition 393, a Bruker Tracer 5g pXRF instrument was used on board JOIDES Resolution (Figure F1A). The Tracer 5g instrument is a lightweight, self-contained energy dispersive XRF survey instrument with a variable intensity X-ray source (6–50 kV; 4.5–200 µA; 4 W; Rh anode). The instrument is equipped with a 20 mm2 1 µm thick graphene window silicon drift detector with a typical resolution of <140 eV at 450,000 counts per second (cps). For reanalysis of Expedition 390 cores at Texas A&M University, a Bruker Tracer 5i instrument was used (Figure F1B). The Tracer 5i has an 8 µm thick Be window with poorer X-ray transmission than the Tracer 5g window but is otherwise identical.
Both Bruker Tracer 5 instruments reduce XRF spectra to elemental concentrations using a combination of Compton normalization and fundamental parameters methodologies, which solve a series of nonlinear equations for each element analyzed. Parameters for these equations, analyte lists, and measurement conditions are packaged into factory-calibrated protocols within the instrument for different sample types. All analyses reported here used the general geological GeoExploration protocol with the Oxide 3 Phase instrumental method, which includes both fundamental parameters and Compton normalization corrections and optimizes analysis for higher masses, with the inclusion of major elements. Analysis time was set at 90 s for Expedition 393 cores and 150 s for Expedition 390 cores. As this protocol was not calibrated on MORB and instrumental response may have changed since factory calibration, it is necessary to apply a secondary calibration to its output using more closely compositionally and matrix-matched reference materials measured alongside the unknowns, following Ryan et al. (2017) and described in detail in the following.
2.3. Measurement strategy
At the beginning of each campaign, the complete set of available powder reference materials (Table T1) was analyzed to establish working curves for secondary calibration. Selections of these materials were then analyzed once or twice per drill hole throughout each campaign. Powder reference material BHVO-2 and the two rock surface standards were not used for calibration and were instead analyzed at least once per day to assess instrument performance.
For Expedition 393, analyses were made on the sawed surface of archive core pieces small enough (<10 cm) to fit within the benchtop stand box (Figure F1A). Spacing of analyses downcore varied from ~0.5 to 1 m, ranging two to five analyses per 1.5 m section of recovered core. For Expedition 390 cores, the instrument was lowered onto the flat-sawed core surface for each analysis (Figure F1B). Analyses were made with a spacing of ~0.5 m, or three per 1.5 m section. For both campaigns, closer spacing of separate analyses was elected for over averaged replicate analyses to increase downcore resolution and simplify data handling.
Analyses were mostly designated as either “background” or “altered,” depending on the degree of visually determinable localized alteration. The background designation refers to areas of rock between localized alteration features such as halos (Figure F2). Background degrees of alteration, particularly in the older holes, are variable downhole and may still be considerable. The altered designation was given to analyses of localized alteration halos, such as around veins or flow margins, with alteration visually determined as stronger than the background (Figure F2). Other designations include glass, breccia clasts, and breccia matrix. For Hole U1557D, which drilled a sedimentary talus breccia with pervasively altered basalt clasts, only the clasts were analyzed and assigned a color descriptor in line with the shipboard alteration descriptions.
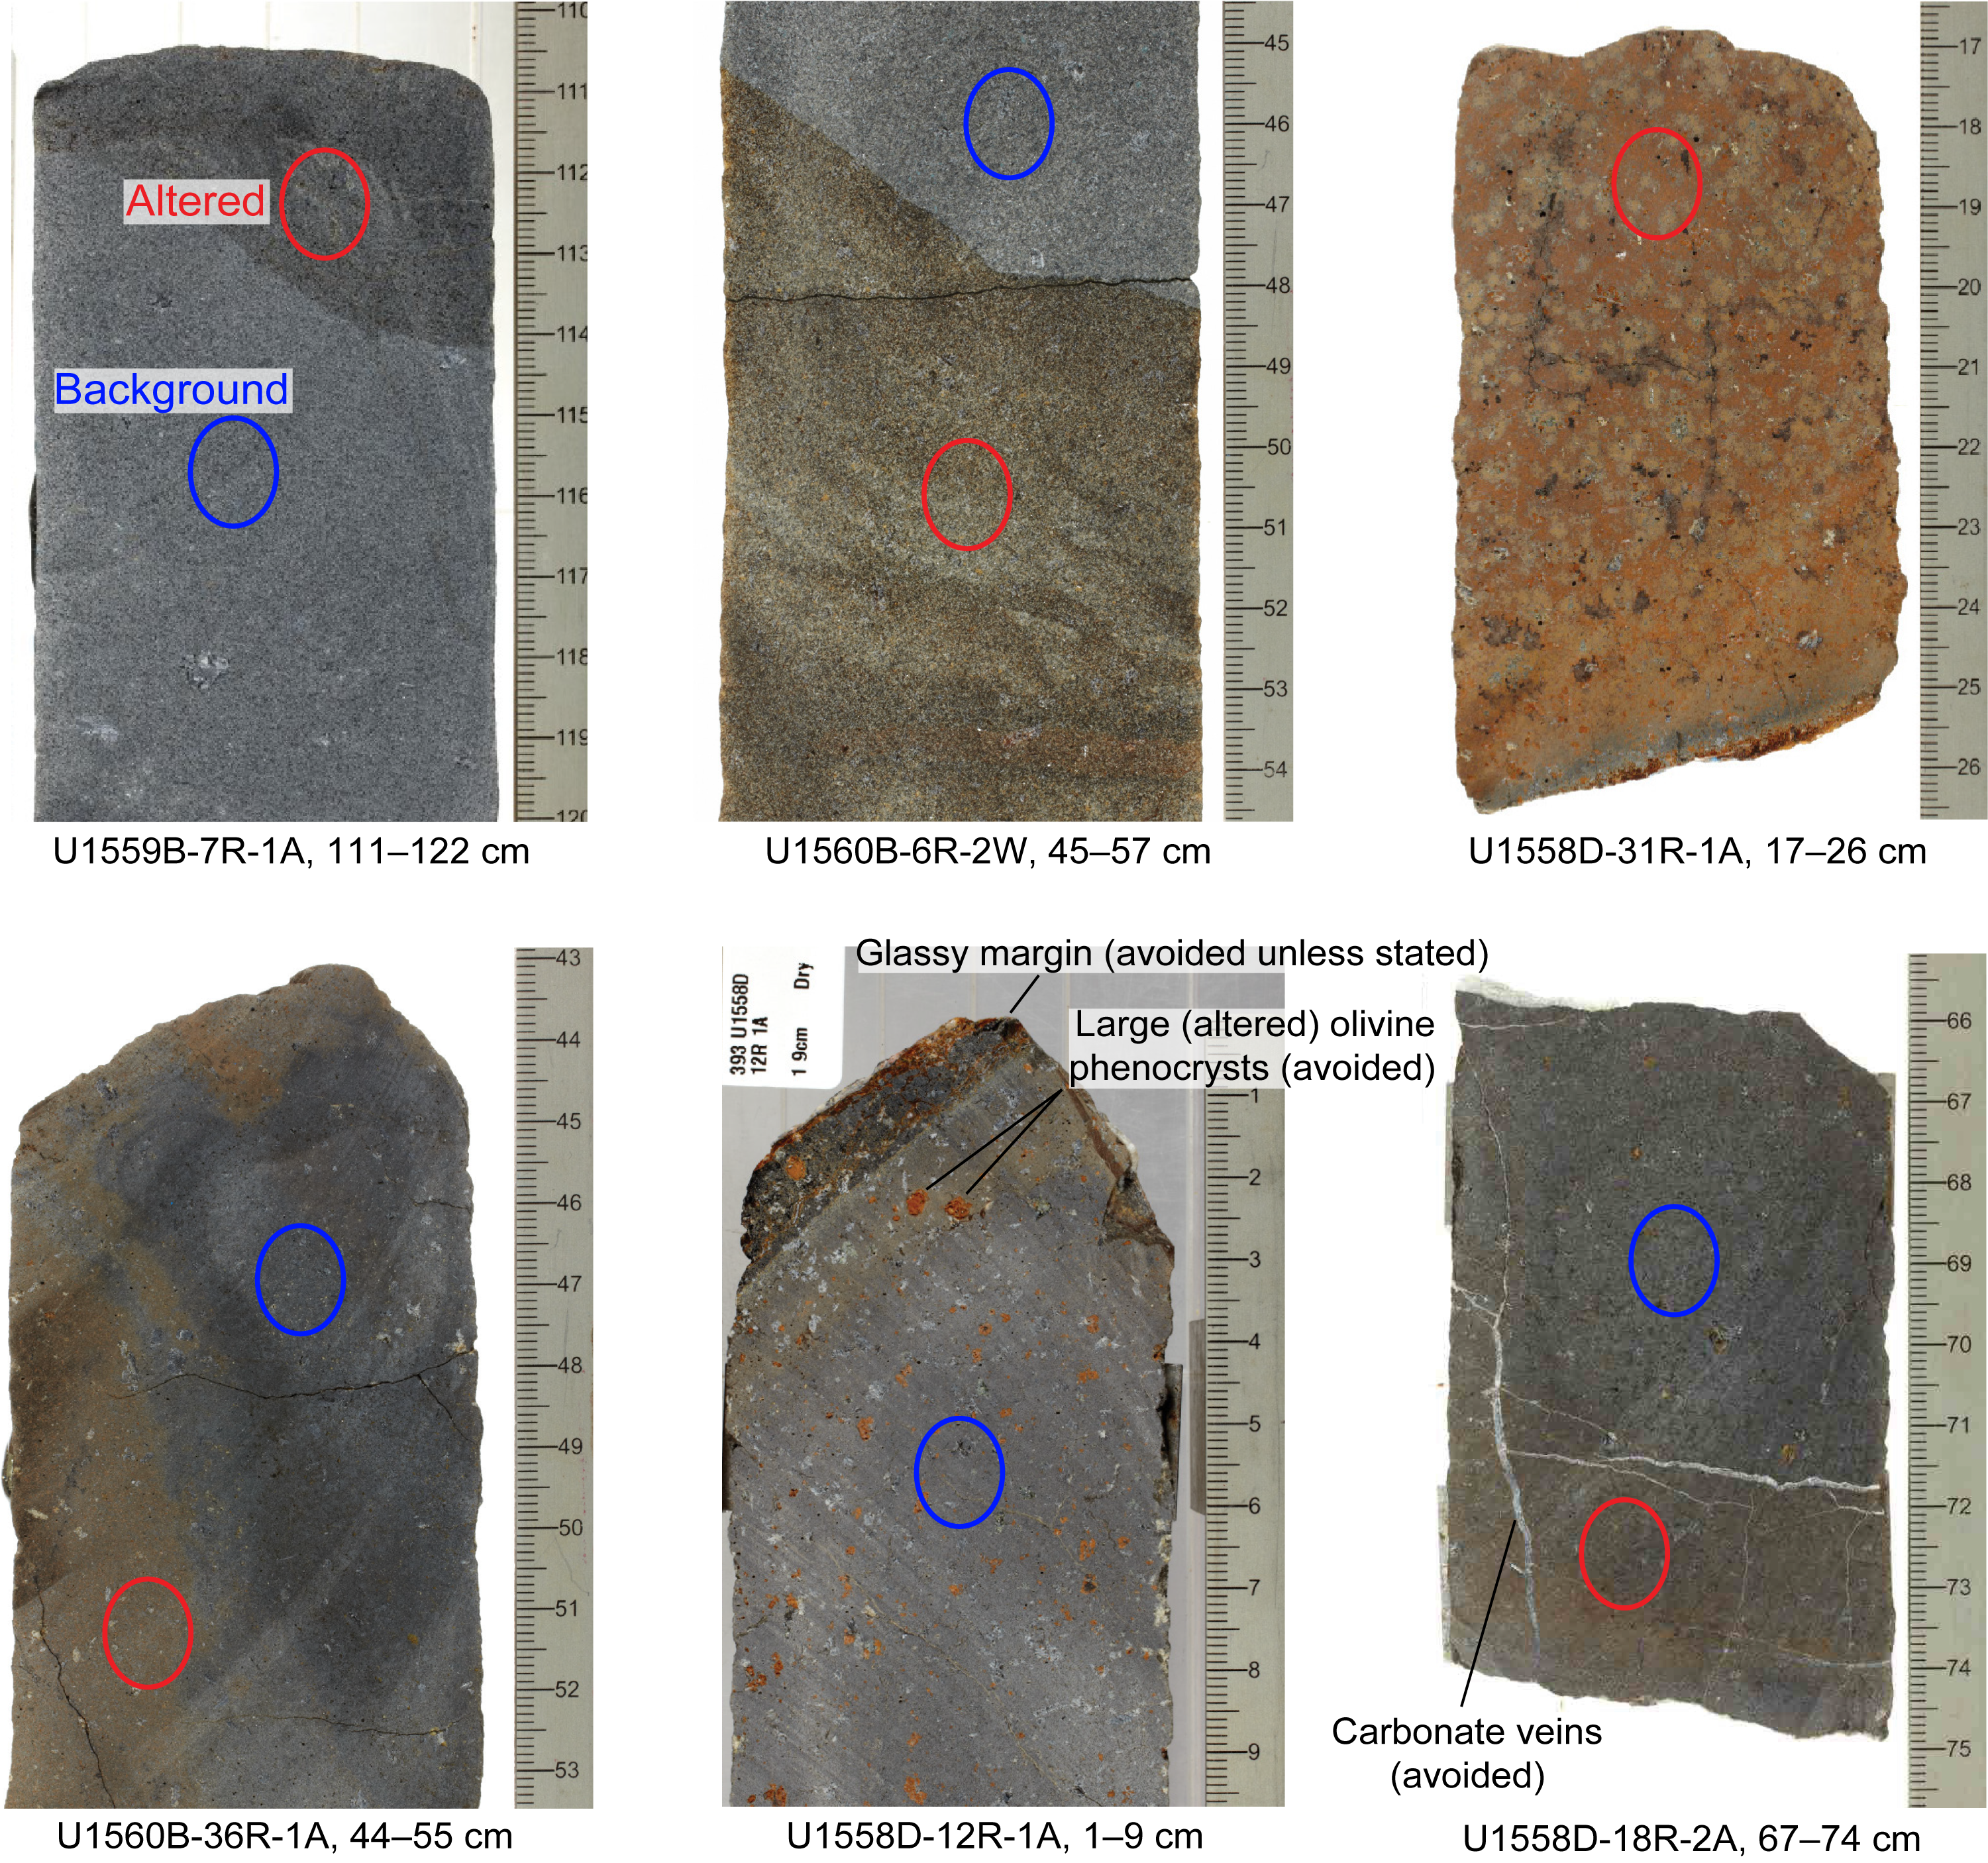
Figure F2. Sawed core surfaces and designated areas.
2.4. Data processing
2.4.1. Secondary calibration
Consistent with previous pXRF campaigns for IODP hard rock drill cores (Johnston et al., 2018; Ryan et al., 2017), instrument-calibrated concentration data output by the pXRF requires secondary calibration using powder reference materials analyzed alongside the samples. These calibrations empirically correct for numerous potential discrepancies in X-ray response between the analyzed samples and the materials used to calibrate the inbuilt GeoExploration Oxide 3 Phase protocol. Such discrepancies arise principally from differences in X-ray absorption and interfering emissions from differing major and minor element matrixes, especially relative to target trace element concentrations, but potentially also from differences in porosity, mineralogy, texture, and sample preparation (Durance et al., 2014). Ideally, secondary calibration materials for basalt core analysis would also be basalt rock surfaces with similar texture, porosity, and mineralogy. However, all widely available reference materials for volcanic rocks are distributed as powders, so using them for secondary calibration is a necessary compromise. This approach generally yields acceptable results, except for a few elements detailed in the following section (see Durance et al., 2014; Ryan et al., 2017). Because secondary calibration curves are commonly nonlinear and do not always pass through the origin (Ryan et al., 2017), a small number of closely matrix-matched reference powders is insufficient for making secondary corrections. Instead, numerous reference materials of comparable matrix class (i.e., igneous or volcanic) but with compositions that bracket the unknown materials by several multiples are necessary for robust secondary calibration (Table T1).
Careful screening of bivariate calibration plots for each element and expedition proved essential for constructing robust calibrations free from the undue influence of outlying or matrix-affected calibration points (Figures F3, F4). This screening resulted in the exclusion of two main categories of outlying points from the calibration curves.
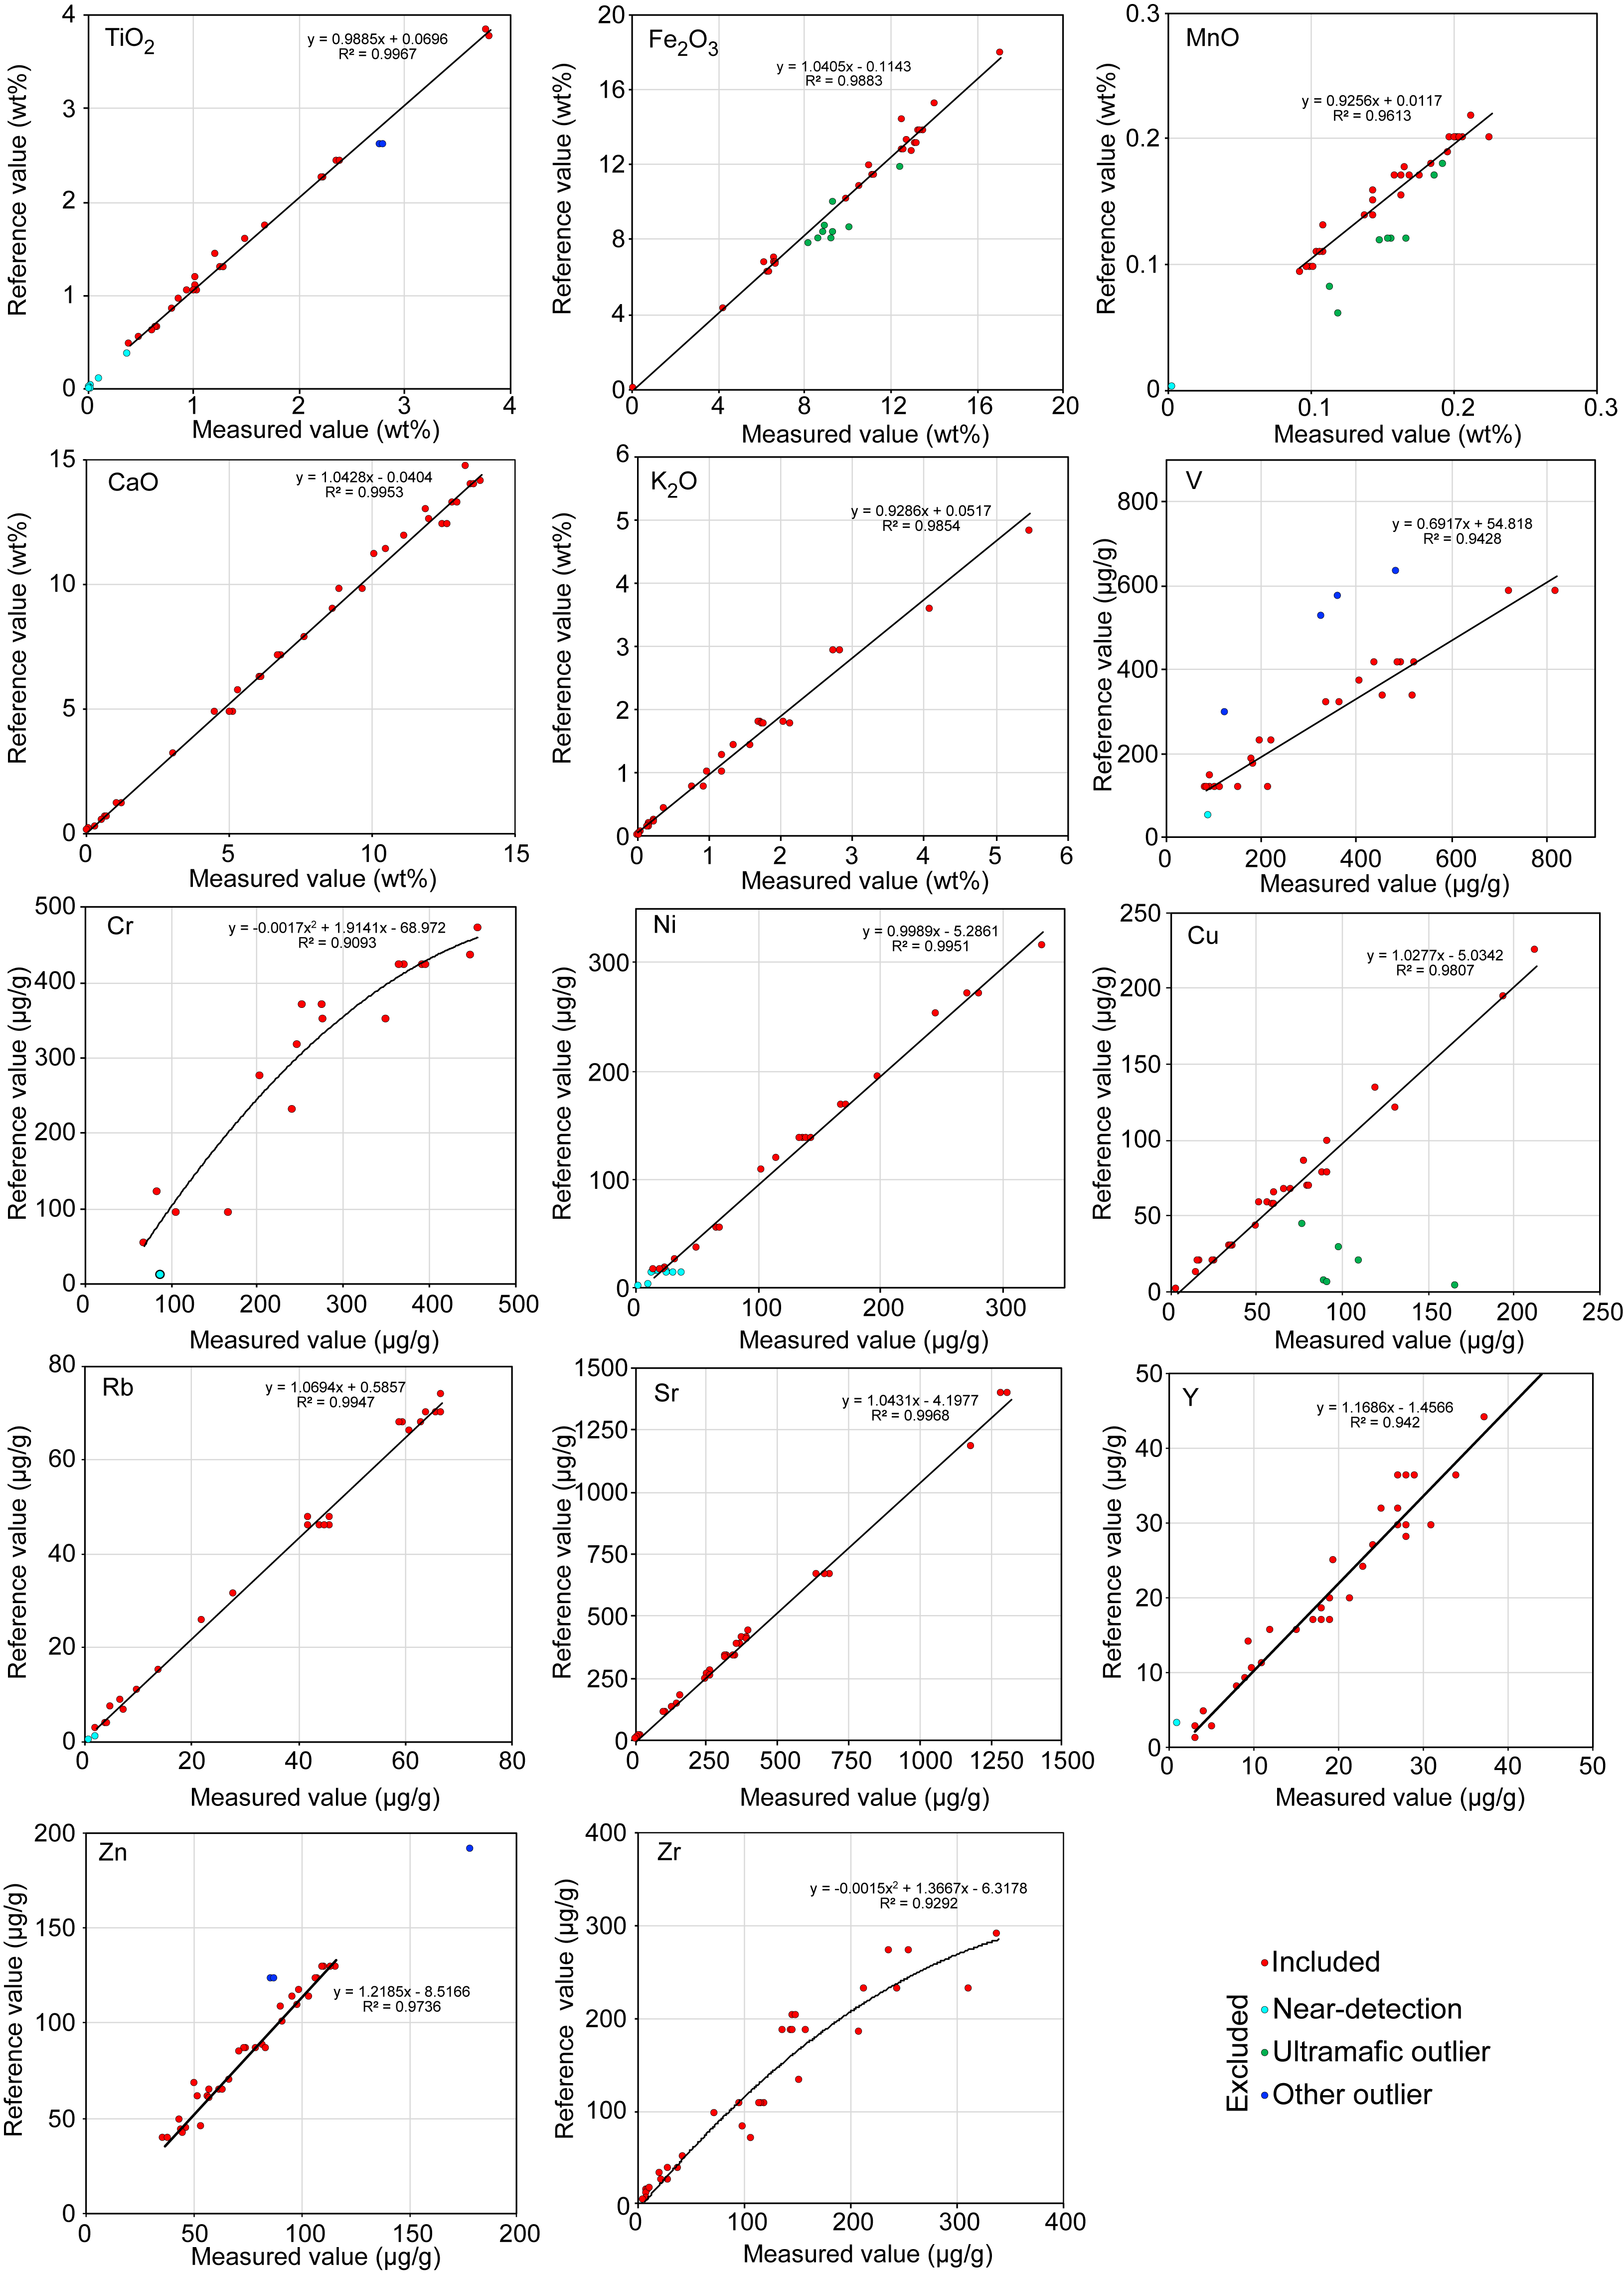
Figure F3. Secondary calibration plots versus Expedition 390 drill cores.
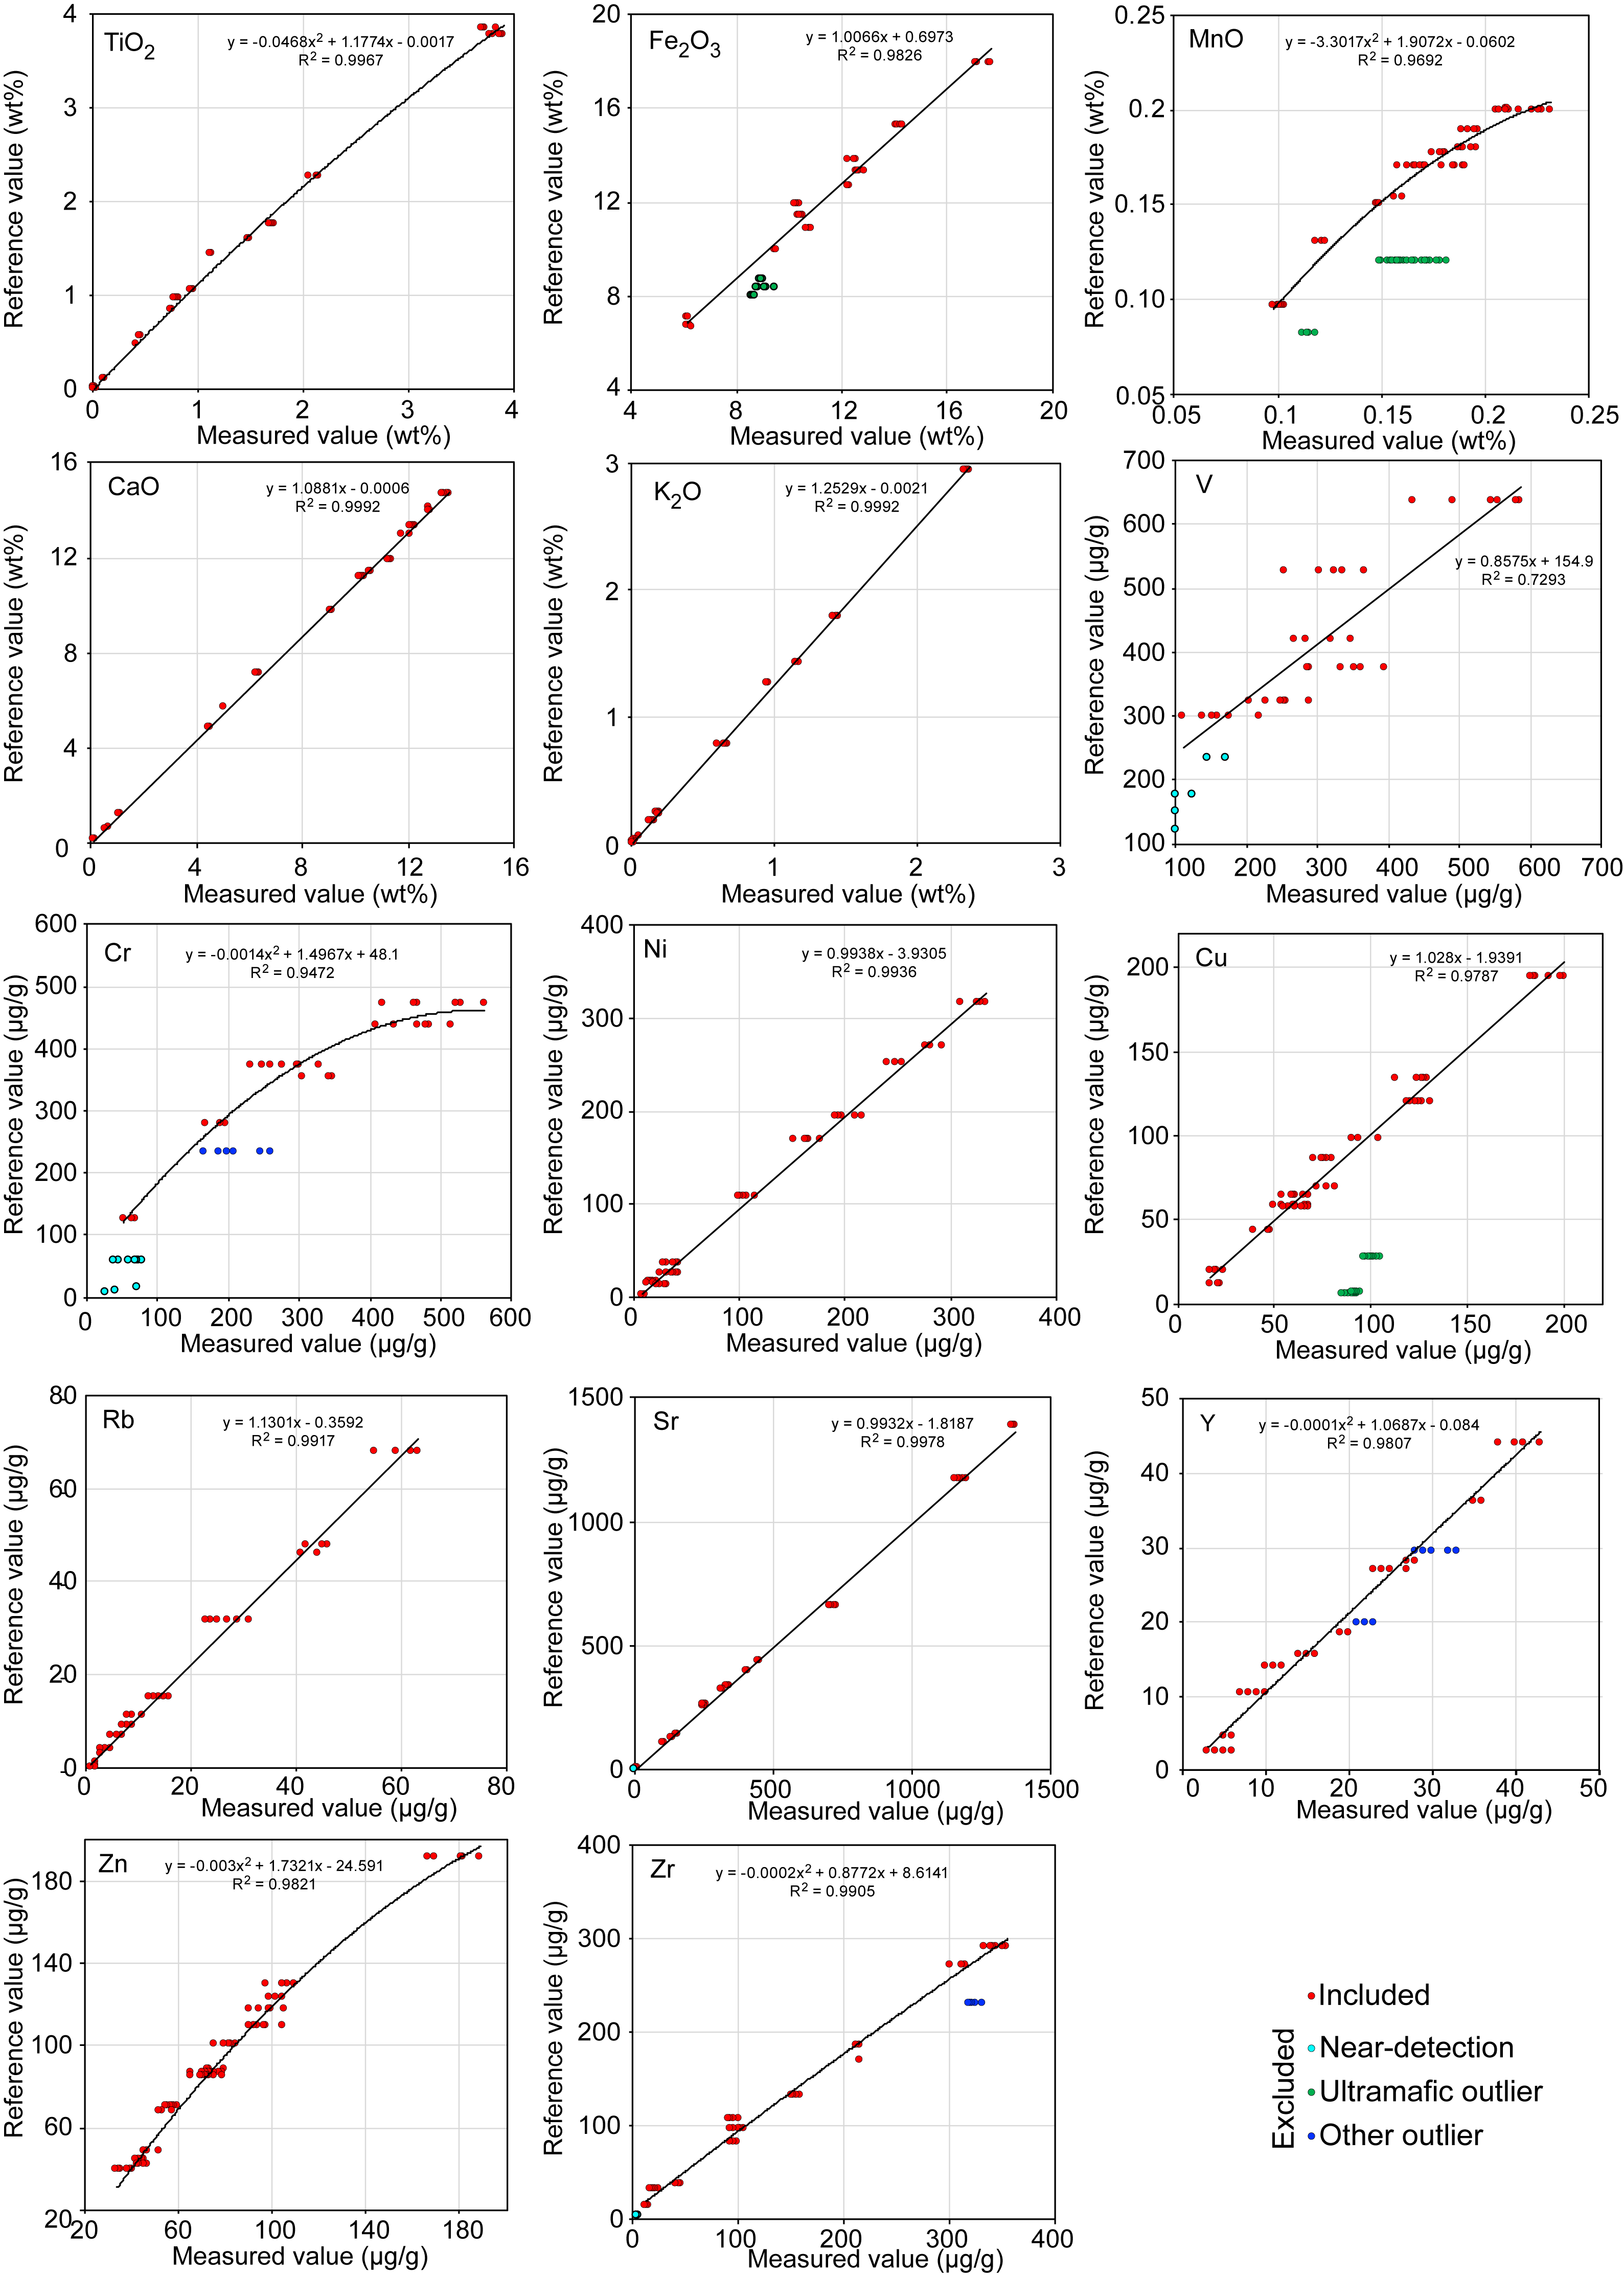
Figure F4. Secondary calibration plots versus Expedition 393 drill cores.
Firstly, pXRF response trends deviate from linearity at concentrations approaching the lower limit of detection for certain elements. Calibration points for elements in reference materials that were inconsistently detected or that were near the detection limit and plotted off trend were excluded for this reason (cyan dots in Figures F3 and F4).
Secondly, outlying points affected by suspected spectral interferences or other matrix effects were excluded. The most serious examples of this result from compositional differences between ultramafic or strongly alkali-enriched reference materials and the otherwise dominant trend defined by mafic and intermediate igneous materials. This includes apparent interferences from Cr and Ni on neighboring elements Mn and Cu in ultramafic reference materials (green dots in Figures F3 and F4). A more subtle effect was also observed for Fe in ultramafic reference materials, which consistently plots below the curve defined by volcanic rocks. Exclusion of ultramafic reference materials from the Mn, Cu, and Fe calibrations solved these issues. Extremely high relative Cr and Ni values in ultramafic materials were also excluded from the calibrations. Although not necessarily outlying, their exclusion improved accuracy at lower volcanic concentrations as assessed by ICP-AES comparison. Exclusion of slightly outlying Y calibration points for alkali-enriched reference materials NKT, AGV-1/2, and BE-N improved its accuracy as compared to ICP-AES core analyses. Further outlying calibration points for V, Cr, Zr, and Zn (dark blue dots in Figures F3 and F4) were excluded, with previously documented matrix effects for these elements likely behind the discrepancies (e.g., Durance et al., 2014).
The compiled Cr value for MRG-1 (430 µg/g; Govindaraju, 1994) consistently plotted off our calibration curves. The GeoReM database (Jochum et al., 2005) reveals that values analyzed by fused glass XRF methods are consistent and higher than otherwise scattered inductively coupled plasma–mass spectrometry (ICP-MS) values, which may have suffered from incomplete chromite digestion. The average of the three GeoReM-compiled XRF results for MRG-1 is 473 ± 13 µg/g (1σ), and this was taken as the reference value, which resolved the issue.
Following exclusion of the outlying points described above, the calibration data were mostly well approximated by either linear or second-order polynomial regressions (Table T2; Figures F3, F4). For the most part, the calibration curves are similar between expeditions, but slight differences resulting from the instrumental differences and reference material availability necessitated an independent set of calibration curves for each campaign. When electing the form of regression, goodness of fit was prioritized over consistency between expeditions. Within each expedition campaign, however, a single set of calibration curves was constructed.
Calibrations for MgO, SiO2, Al2O3, and P2O5 were poor, as expected for pXRF analysis in an uncontrolled atmosphere, so these data are not reported beyond the supplementary calibration files. The complete set of raw, calibration, and validation data and plots for Expedition 390 and 393 are provided in PXRF in Supplementary material to facilitate user reprocessing as needed.
2.4.2. ICP-AES matrix corrections
Cross-comparability between low precision but high downcore resolution pXRF and high precision but low resolution ICP-AES analyses is vital for assessing downhole geochemical variation. Correspondence between these two data sets was prioritized and assessed using downhole plots and with the rock surface standards.
Following secondary calibration, pXRF compositions for Expedition 393 showed generally good correspondence to ICP-AES values. In contrast, initial comparison of the Expedition 390 calibrated pXRF compositions with ICP-AES analyses revealed residual differences for key trace elements TiO2, Zr, and Y (Figure F5). Accuracy and consistency of the calibration for these elements across a MORB to OIB-like concentration range is crucial for tracing the geochemical stratification in Hole U1556B (Coggon et al., 2024).
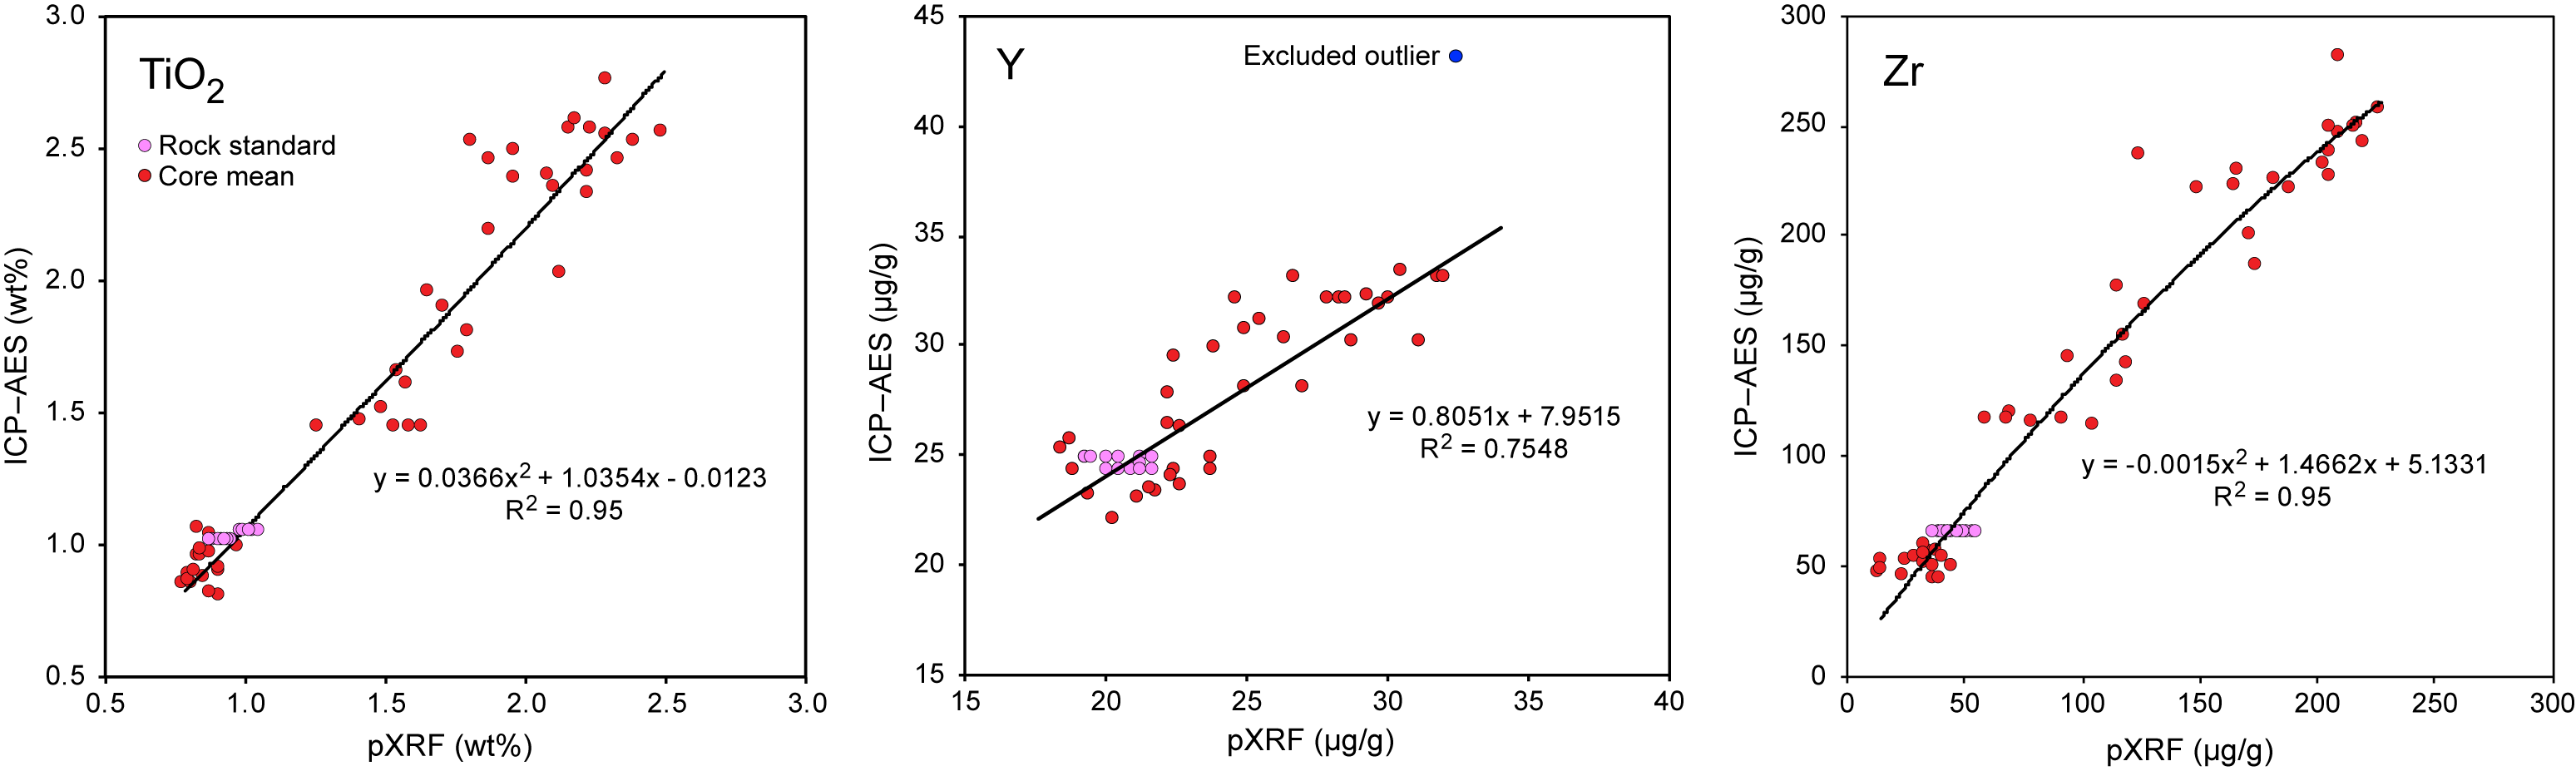
Figure F5. Expedition 390 core mean ICP-AES corrections for TiO2, Y, and Zr.
To quantify these residual errors and align the two data sets, the ICP-AES results (typically 1–2 analyses) and powder reference material–calibrated pXRF values (typically 4–10 analyses) for each Expedition 390 basement core were averaged and plotted (Figure F5). The term “core” refers here to the rock recovered together from a single 4.5 or 9 m drilled interval, depending on whether a half or full core was taken, respectively. Analyses of rock surface standards RS-5R and RS-11R were also added to these plots. This core-by-core approach assumes that, at the scale of the hole, Zr, TiO2, and Y concentrations are similar within each core, and departures from this are overcome by utilizing enough data points: 73 cores plus 18 replicate rock surface standard analyses. Hydrothermal immobility of the elements is necessary to avoid excessive within-core variation due to alteration. Despite some within-core variability where Stratigraphic Unit A is interfingered with or intrudes Unit B around Cores 390-U1556B-38R through 34R, correlations between the pXRF and ICP-AES core average data sets support this approach, with R2 values of 0.95 for Ti and Zr and 0.75 for Y (Figure F5). Fits through these data were used to correct the Expedition 390 powder-calibrated TiO2, Y, and Zr pXRF values toward the ICP-AES data. This correction could possibly have reduced the absolute accuracy of the pXRF data if the ICP-AES results are inaccurate, but consistency between the two data sets was prioritized. Postcruise discrete sample analyses will allow this to be reassessed in the future.
Following these corrections, there is consistent correspondence between the pXRF and ICP-AES core averages for TiO2 and Y, scattered within ~20% and 15% of the 1:1 line, respectively (Figure F6A, F6B). For Zr, the average correspondence between data sets for Expedition 390 is acceptable; however, this appears to drift over the course of the campaign (Figure F6C).
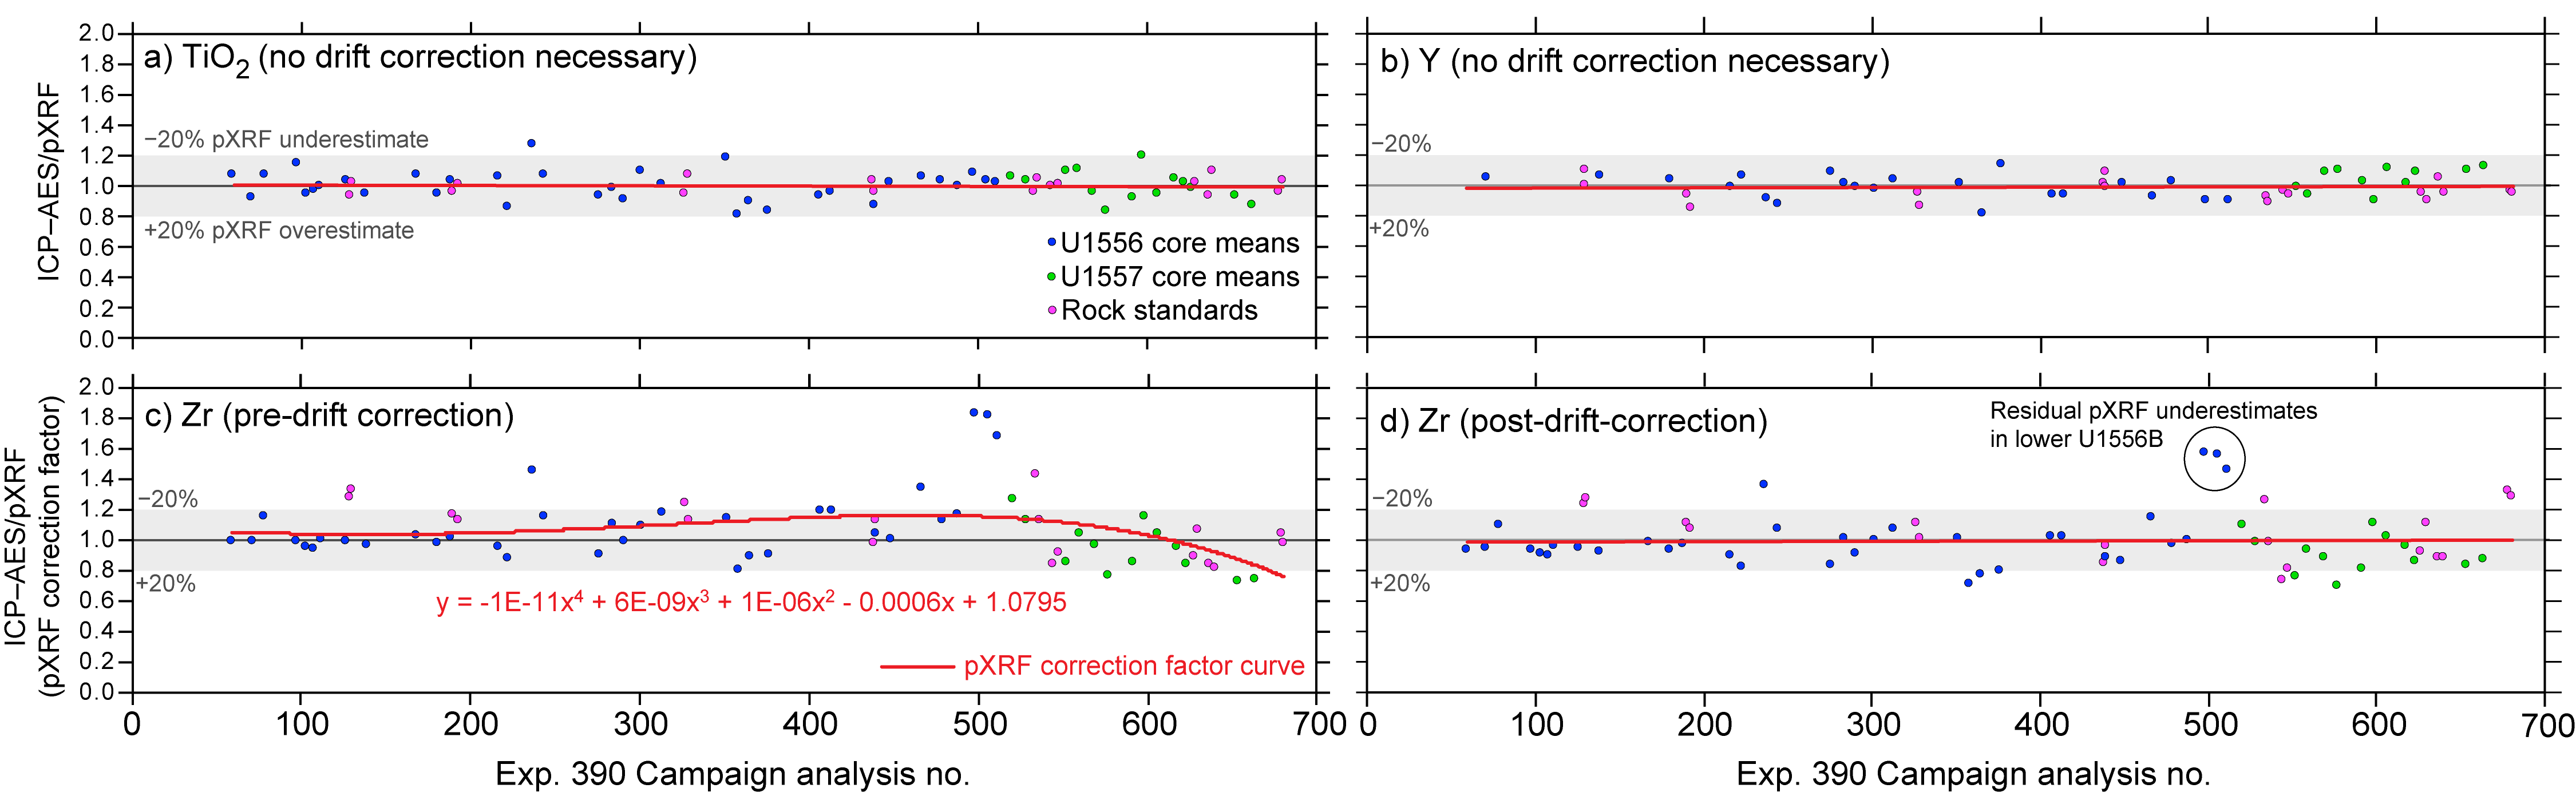
Figure F6. Expedition 390 drift assessment and Zr drift correction.
2.4.3. Expedition 390 Zr drift correction
Drift toward pXRF underestimation of Zr over the course of analyzing Hole U1556B culminates in a spike around analysis number 500 before reverting toward overestimation between analysis number 500–700, corresponding to analyses downhole in Hole U1557D (Figure F6C). The consistency of Ti and Y (Figure F6A, F6B) and the presence of the same effect in both the rock surface standards and BHVO-2 analyses suggests this drift may be instrumental rather than related to Site U1556/U1557 textural changes. This drift can be broadly fit by a fourth-order polynomial function, which plotted for ICP-AES/pXRF core average ratios yields a multiplicative correction factor that can be applied to the calibrated Zr concentration as a function of analysis number (Figure F6C). This correction factor was applied to the Expedition 390 Zr data following both the secondary powder calibration and the global matrix-related correction detailed above.
Following this drift correction, correspondence between pXRF and ICP-AES Zr core averages is improved; however, residual underestimates that could not be readily fit persist around analysis 500 (Figure F6D). It is hence emphasized that Zr contents measured by pXRF may be up to ~40% too low in Unit 13 of Hole U1556B. It is also emphasized that the mechanism behind this apparent drift is not understood, and the correction we applied is purely empirical and reliant on the accuracy of the ICP-AES results. However, following the correction, overall downhole trends in Zr are well captured and more consistent with the shipboard ICP-AES results. Nevertheless, both the uncorrected and intermediate Zr values are provided in the reported data tables to allow users to choose between data types, and the supplementary calibration files (see PXRF in Supplementary material) allow any revisions to these corrections to be made.
2.5. Expanded depths
Basement cores suffered from variable recoveries (hole averages of 30%–65%). To overcome clustering of data at the top of poorly recovered cores when plotted on the IODP-curated core depth below seafloor, Method A (CSF-A), depth scale and to facilitate direct comparison with wireline logs, an expanded depth was additionally calculated for each pXRF analysis point. The expansion calculation proportionally spreads the curated depths of analysis points throughout the drill-advanced interval over which the core was cut, such that the lowermost measured intervals will be nearer the bottom and the uppermost intervals will be nearer the top. To make this expansion, the curated offset for each analysis point from the top of each core (not section) was multiplied by the ratio of the drill-advanced interval over the curated recovered core length for that core. This expanded core offset was added to the core top depth, defined by the position of the drill string and hence known independent of recovery, for each analysis. We note that this approach does lead to artificial expansion of analysis points made on the same continuous piece of core. Nevertheless, the expanded depths give a best estimate for the true downhole depth for each analysis and should have more symmetric uncertainties. In some cases, such as for wireline log comparison, expanded depths will be the better depth scale to use, whereas the CSF-A depth scale is more suited for comparison with other CSF-A scale core data. Both depth scales are listed for each analysis.
3. Results
3.1. Precision, accuracy, and stability
Following the calibrations and corrections detailed above, final precision, accuracy, and stability of the SAT pXRF data sets are assessed by comparing the measured pXRF values to the reference ICP-AES value for RS-5R and the preferred values for BHVO-2 (Figure F7) (Jochum et al., 2005). The ratio of measured to reference value for each analysis is plotted against analysis number, indicative of time, to assess the stability of each data set across the campaign (Figure F7). Note that this ratio is the reciprocal of that plotted in Figure F6, which instead gave a drift correction factor. A summary of the standard results is provided in Table T3.
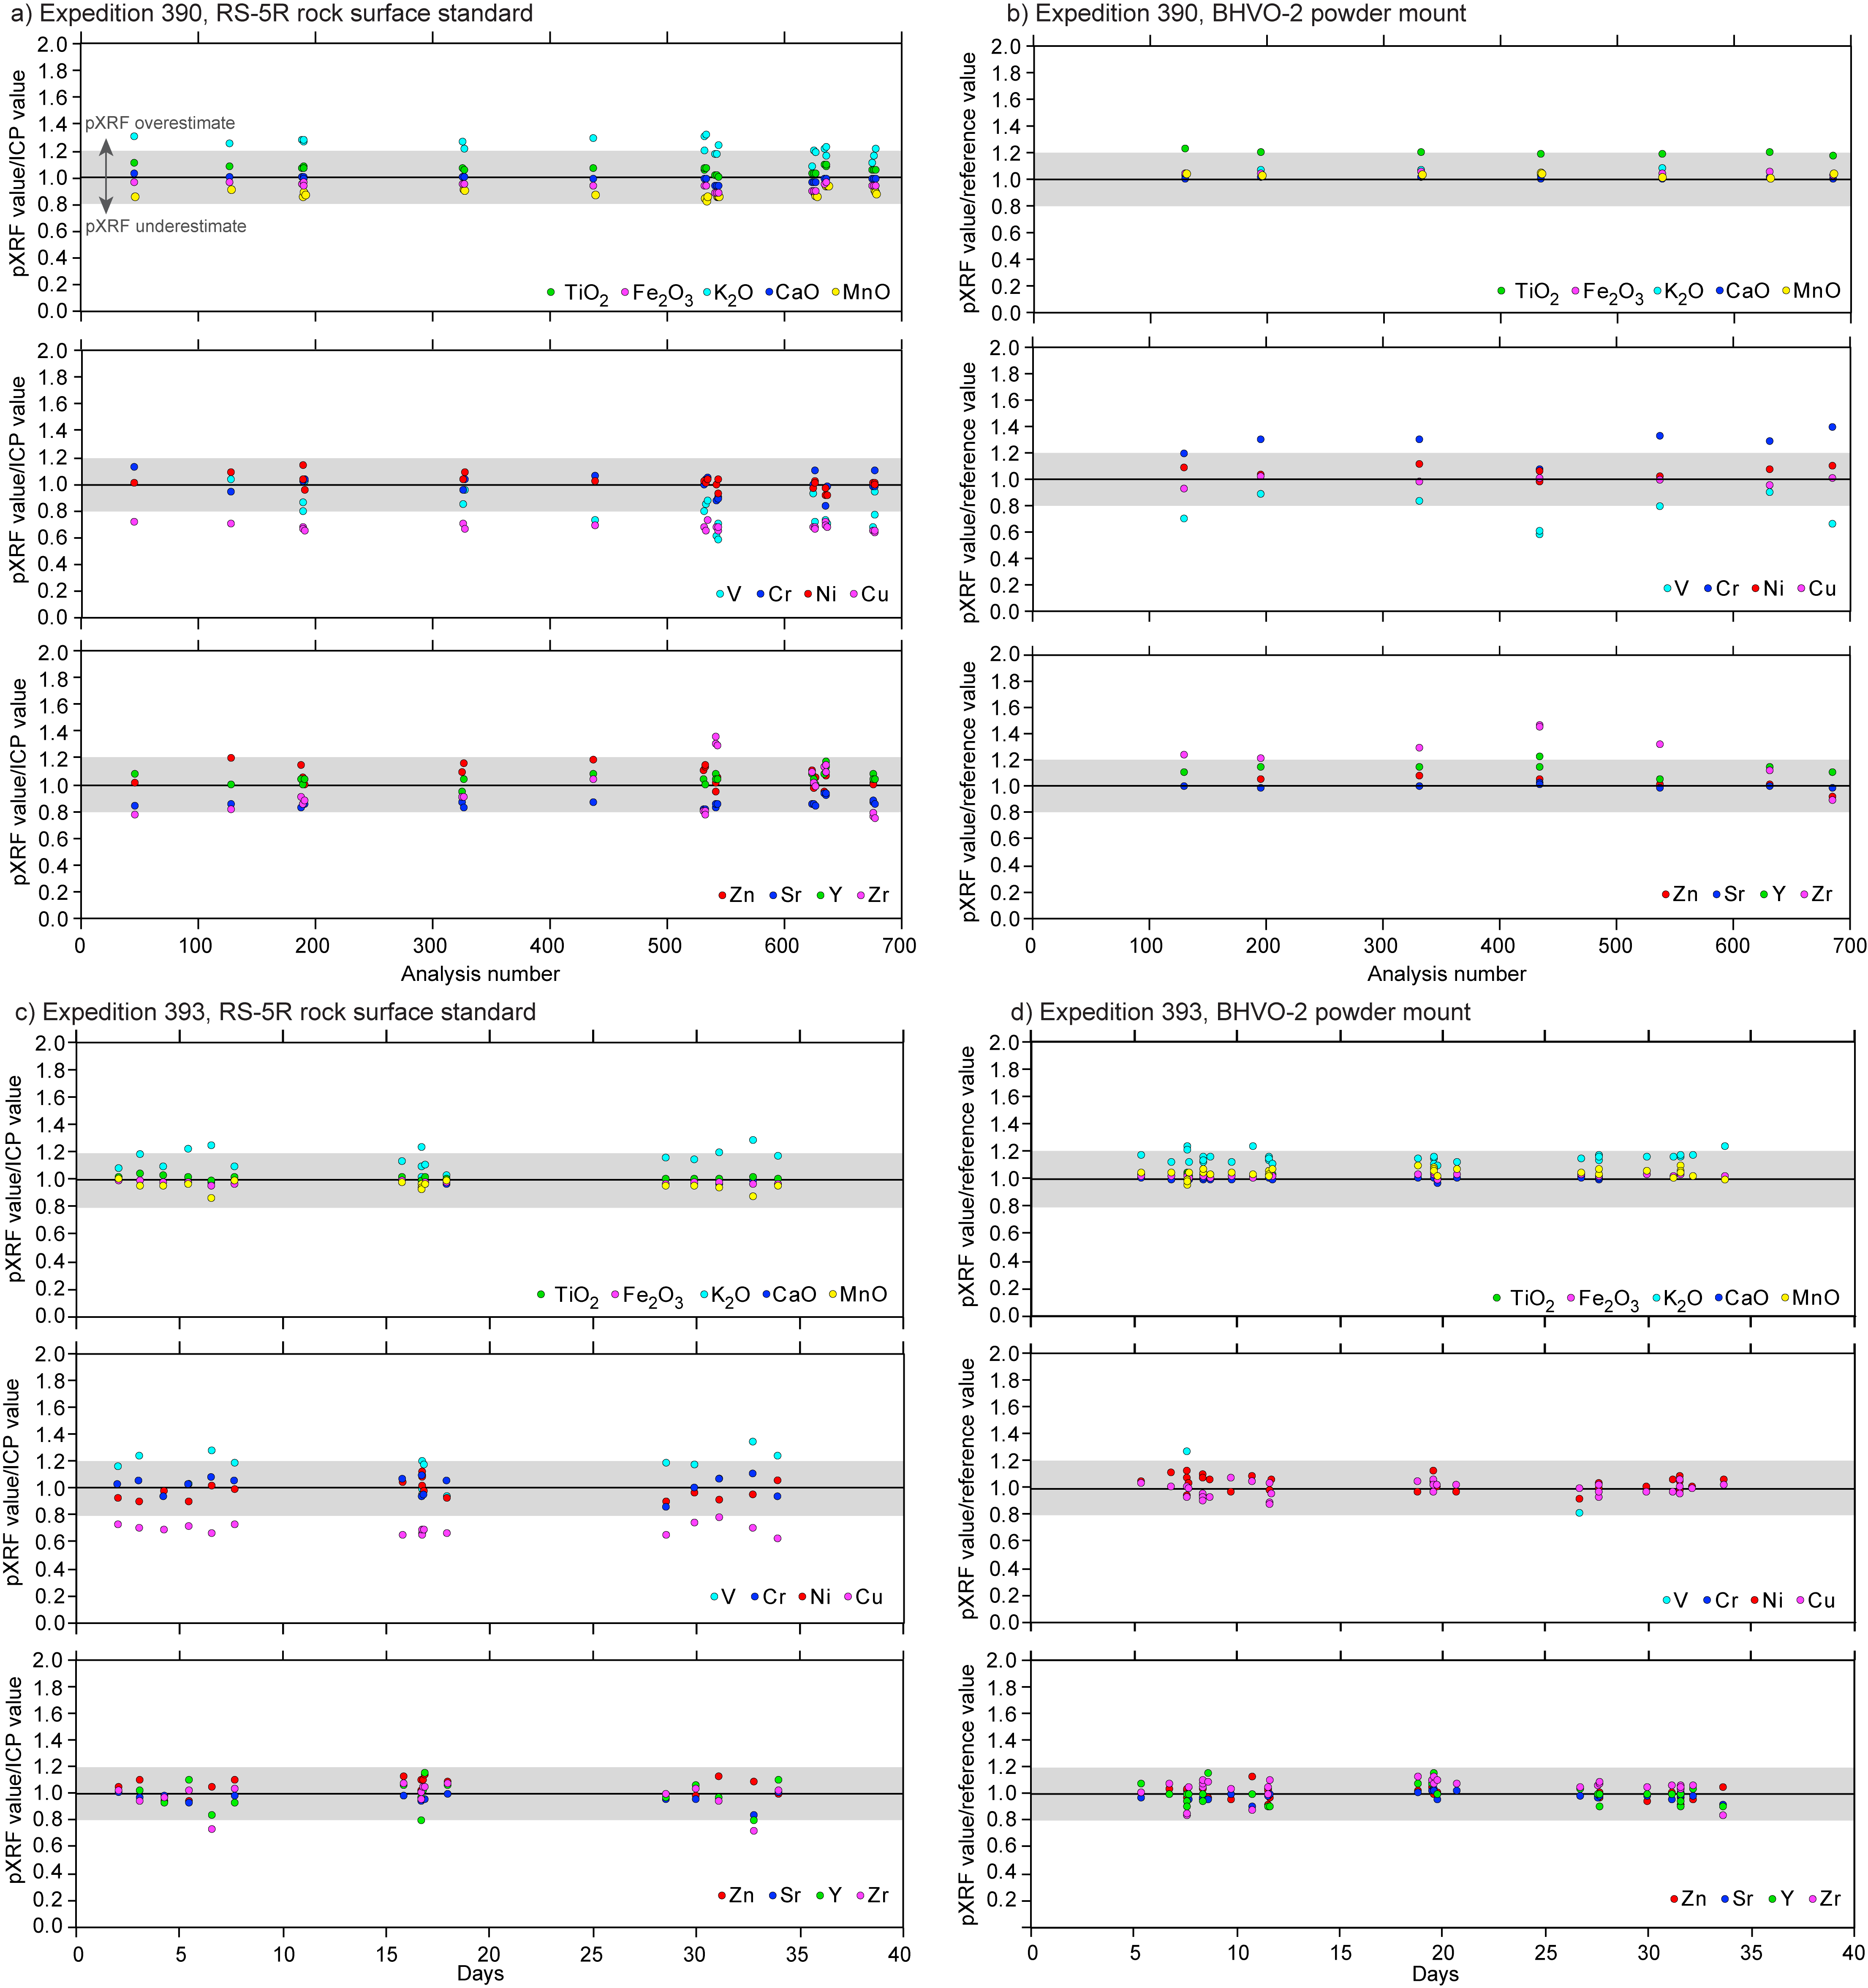
Figure F7. Precision, accuracy, and drift assessment.
Following the matrix corrections for TiO2, Zr, and Y on the Expedition 390 data set, accuracy for these elements should be better for RS-5R than for the BHVO-2 powder, and this is apparent in Figure F7 and Table T3. Results for RS-11R are documented separately (see RS11R in Supplementary material) because discrepancies and heterogeneity for K2O, Zn, and other fluid-mobile elements in excess of pXRF precision indicate that the original block from which RS-11R was sampled was not homogeneous enough for this assessment, at least with respect to fluid-mobile elements.
To a lesser extent, RS-5R may also suffer from heterogeneity issues, so an additional assessment of our approach is provided in Figure F8, with downhole pXRF data compared to ICP-AES data for Hole 393-U1560B. This assessment allows the calibrations for fluid-mobile elements with suspected differences in RS-5R between the pXRF surface and offcut used for ICP-AES to be properly assessed (e.g., K, Zn, and Cu).
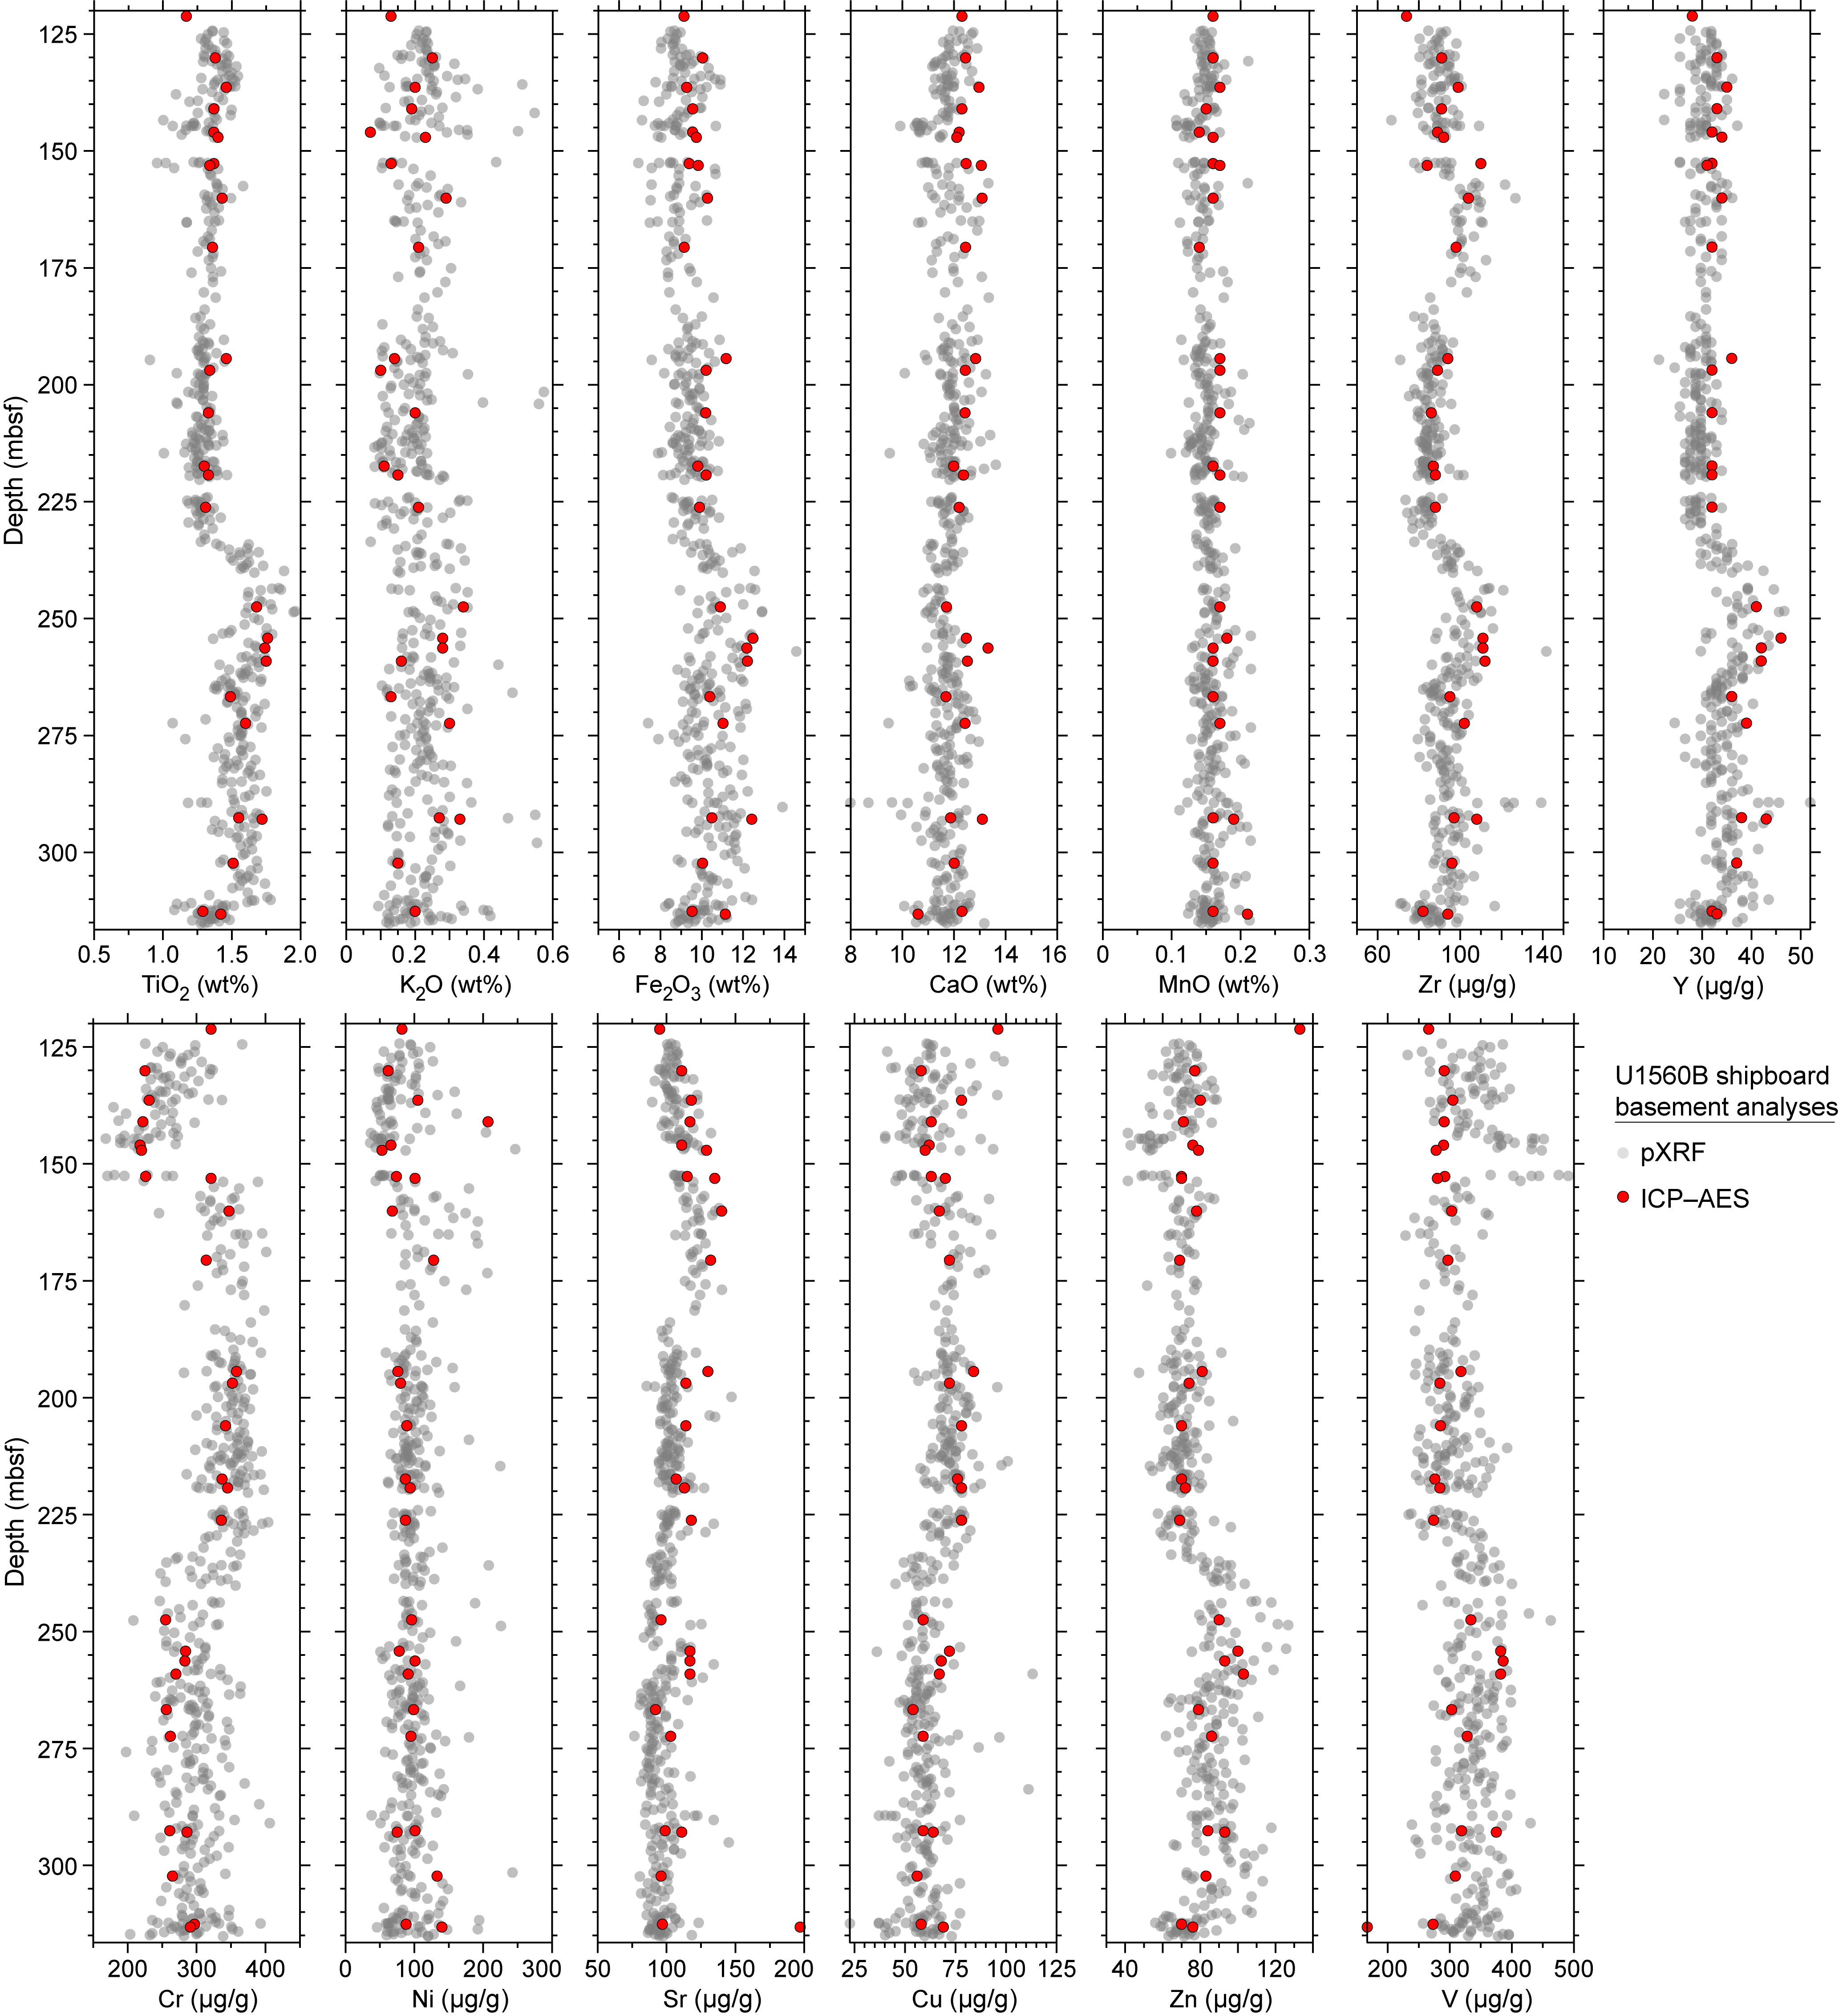
Figure F8. Fully calibrated and corrected pXRF compositions versus shipboard ICP-AES.
Figure F7 shows stable but commonly systematic errors within 10%–20% of the reference or ICP-AES value for most analytes. Better than 5% total error and precision are achieved for TiO2, CaO, Fe2O3, Ni, and Y for both RS-5R and BHVO-2 for both campaigns. This accuracy is reflected by a close correspondence between pXRF and ICP-AES for these elements downhole in Hole U1560B (Figure F8). Underestimation of Y by ~5%–10% is nevertheless suggested by Figure F8 for the Expedition 393 pXRF data set, whereas rare positive Ni spikes may correspond to analyses over olivine phenocrysts (Figure F2).
Elements Cr, Sr, Zn, Zr, and Mn are reproduced to within 5%–20% of the ICP-AES values for RS-5R, with some of this error within the limits of ICP-AES uncertainty or inhomogeneity of the standard. Comparison with ICP-AES data downhole in Hole U1560B shows that pXRF Cr is accurately calibrated but imprecise (± approximately 50 µg/g). Strontium is systematically underestimated by ~10% downhole in Hole U1560B, which may be explained by the avoidance of large plagioclase phenocrysts during pXRF analysis. Both Zn and Zr are well reproduced by the downhole pXRF data (Figure F8), whereas MnO is well reproduced but limited primary variation precludes a robust downhole assessment.
Agreement of pXRF and ICP-AES K2O downhole in Hole U1560B supports the accuracy of the K2O pXRF determinations to within ~10% (Figure F8). Systematically high K2O as measured by pXRF for RS-5R but not BHVO-2 indicate cryptic K2O heterogeneity in the basalt block that RS-5R was cut from and caution against reliance on RS-5R for monitoring K2O accuracy. Despite this issue with absolute accuracy, repeat analyses of RS-5R and BHVO-2 indicate that pXRF K2O precision is better than 7% RSD, with within-core variation far exceeding limits of precision for the SAT basement cores (Figure F8). Similar to K2O, assessments of pXRF Cu performance are inconclusive using the RS-5R standard data, for which precise (<6% RSD) but systematic pXRF underestimation suggests either a matrix effect or heterogeneity in the block the standard was cut from (Figure F8). Heterogeneity in the original block is supported by the good agreement between pXRF and ICP-AES Cu concentrations downhole in Hole U1560B (Figure F8). The RS-5R discrepancies for K2O and Cu are thus probably best explained by cryptic variation in K-rich and sulfide-oxidizing secondary alteration within the original sample block.
The pXRF performance for V is inconsistent, with 20%–30% underestimates during Expedition 390 and 15%–20% overestimates during Expedition 393 for RS-5R and concentrations inconsistently detectable for BHVO-2 despite a reference value of 318 µg/g. Calibration plots for V are also scattered, suggesting some combination of weak X-ray fluorescence and interfering matrix effects (Figures F3, F4). Analyses downhole in Hole U1560B show these issues manifest as pronounced scatter of pXRF data relative to ICP-AES. However, within this scatter the pXRF and ICP-AES squarely overlap, so the pXRF data are considered usable but imprecise.
3.2. South Atlantic Transect cores
Processed as described above, pXRF results for Sites U1559, U1583, U1560, U1558, U1556, and U1557 are provided as CSV tables for each site (see PXRF in Supplementary material). Figure F8 demonstrates the downhole resolution and ICP-AES comparability of these data using Hole U1560B as an example. As aimed for, the processed pXRF data reveal subtle coupled geochemical variation of compatible and incompatible elements related to the MORB volcanostratigraphy of Hole U1560B. In particular, Cr, Ti, and Zr sensitively monitor fractionation degrees of this presumably comagmatic basalt lava sequence, as made use of in Coggon et al. (2024). The raw, calibration, and intermediate pXRF data are provided in PXRF in Supplementary material for user reprocessing as necessary.
4. Conclusions and recommendations
Applied to MORB and OIB-like basalts, the Bruker Tracer 5 pXRF instrument can achieve precision and accuracy within 5%–10% for TiO2, CaO, Fe2O3, Ni, and Y and within 5%–20% for K2O, Cr, Sr, Zn, Zr, Cu, Rb, and Mn. Al2O3 and P2O5 should be moved to the list with SiO2 and MgO (i.e., performance for V was poor, with up to 26% error), and SiO2, MgO, Al2O3, and P2O5 could not be usefully measured. This performance was sufficient to achieve our aim of delineating subtle geochemical variations in comagmatic MORB sequences. Such performance is only realizable if 10 to 20 well-characterized powder reference materials and rock surface standards of comparable texture and composition to the unknowns are analyzed for secondary calibration over the course of the pXRF campaign, expanding upon the recommendations set out by previous studies (e.g., Durance et al., 2014; Ryan et al., 2017). Drift in pXRF response over the course of a typical campaign is possible for certain elements (Zr) and may be more of an issue with thicker instrument windows. Such drift should be monitored and can be corrected for using repeat reference material and rock standard analyses. For rock surface standards RS-5R and RS-11R, the ICP-AES and average pXRF results for both expeditions are provided in PXRF in Supplementary material. The rock surface standard pXRF results for fluid-mobile elements K2O, Rb, Zn, and Cu are recommended over the ICP-AES results as working values for future pXRF performance monitoring.
Given this performance, the utility of pXRF for drilling expeditions targeting the ocean crust will largely depend on the cores, which should ideally have a dry, flat-cut top surface and be fine grained enough to fit numerous grains within the millimetric pXRF window (i.e., volcanic to doleritic textures), combined with the downcore spacing that is achievable. High downcore spacing helps to overcome poor precision for some elements and to pinpoint sharp transitions (Figure F8). Overall, both major and trace element analytical precision and stability were marginally better using the Tracer 5g with a 1 µm graphene window over the Tracer 5i with a thicker 8 µm Be window. Utilizing at least three rock surface standards that cover the compositional range and have similar porosity and texture relative to the samples analyzed is recommended. Rock standard RS-5R will be available to future IODP expeditions, but prepreparation of additional standards on a case-by-case basis is recommended. Taking a thin slice of material for conventional ICP or XRF analysis from the top surface of the rock standards may alleviate block heterogeneity issues. Finally, secondary calibrations implemented with a drift-responsive, spline-fit 3D calibration surface (e.g., after Paul et al., 2023) would see pXRF analytical precision and accuracy for most of the elements reported here improve.
As presented, the pXRF data reported here are ready for use in addressing key scientific objectives of the SAT concerning volcanostratigraphy and hydrothermal element mobility. The reprocessed data represent a marked improvement in accuracy, internal consistency, and consistency with shipboard ICP-AES data compared to results initially reported from linear shipboard powder reference material calibration.
5. Supplementary material
Supplementary material for this report comprises an RS-11R assessment (see RS11R in Supplementary material); calibration workbook files for Expeditions 393 and 390, including pXRF data tables for Sites U1556–U1560 and U1583 (see PXRF in Supplementary material); and ICP-AES and average pXRF results for rock surface standards RS-5R and RS-11R (see ICPAES in Supplementary material).
6. Acknowledgments
This study used samples cored during IODP Expeditions 390C, 395E, 390, and 393, funded by the IODP JOIDES Resolution Science Operator (JRSO) and US National Science Foundation (NSF; OCE1326927 and OPP-2000995). We thank the captains, crew, staff scientists, and JRSO staff on board JOIDES Resolution for overseeing these successful expeditions and facilitating the recovery of the cores analyzed for this report. In particular, Bridgette Cervera (JRSO) is thanked for her patience and assistance in collecting and processing the pXRF data, and David Houpt (JRSO) is thanked for arranging the analyses at Texas A&M University. M.K. Jonnalagadda acknowledges funding from IODP-India Grant GSS-11011/9/2019-GSS-NCPOR; T.M. Belgrano acknowledges funding from UK-IODP Grant NE/X003485/1; J.S. Reece, P.D. Kempton, and J.G. Ryan acknowledge funding from IODP through NSF Grant OCE-1450528; and R.M. Coggon acknowledges funding from National Environment Research Council (NERC) UK-IODP Grant NE/X0001X/1 and Royal Society Award URF\R1\180320. We kindly thank reviewer Mark Reagan for comments that strengthened this report.
References
Coggon, R.M., Teagle, D.A.H., Sylvan, J.B., Reece, J., Estes, E.R., Williams, T.J., Christeson, G.L., Aizawa, M., Albers, E., Amadori, C., Belgrano, T.M., Borrelli, C., Bridges, J.D., Carter, E.J., D’Angelo, T., Dinarès-Turell, J., Doi, N., Estep, J.D., Evans, A., Gilhooly, W.P., III, Grant, L.C.J., Guérin, G.M., Harris, M., Hojnacki, V.M., Hong, G., Jin, X., Jonnalagadda, M., Kaplan, M.R., Kempton, P.D., Kuwano, D., Labonte, J.M., Lam, A.R., Latas, M., Lowery, C.M., Lu, W., McIntyre, A., Moal-Darrigade, P., Pekar, S.F., Robustelli Test, C., Routledge, C.M., Ryan, J.G., Santiago Ramos, D., Shchepetkina, A., Slagle, A.L., Takada, M., Tamborrino, L., Villa, A., Wang, Y., Wee, S.Y., Widlansky, S.J., Yang, K., Kurz, W., Prakasam, M., Tian, L., Yu, T., and Zhang, G., 2024. Expedition 390/393 summary. In Coggon, R.M., Teagle, D.A.H., Sylvan, J.B., Reece, J., Estes, E.R., Williams, T.J., Christeson, G.L., and the Expedition 390/393 Scientists, South Atlantic Transect. Proceedings of the International Ocean Discovery Program, 390/393: College Station, TX (International Ocean Discovery Program). https://doi.org/10.14379/iodp.proc.390393.101.2024
Durance, P., Jowitt, S.M., and Bush, K., 2014. An assessment of portable X-ray fluorescence spectroscopy in mineral exploration, Kurnalpi Terrane, Eastern Goldfields Superterrane, Western Australia. Applied Earth Science, 123(3):150–163. https://doi.org/10.1179/1743275814Y.0000000052
Expedition 330 Scientists, 2012. Expedition 330 summary. In Koppers, A.A.P., Yamazaki, T., Geldmacher, J., and the Expedition 330 Scientists, Proceedings of the Integrated Ocean Drilling Program. 330: Tokyo (Integrated Ocean Drilling Program Management International, Inc.). https://doi.org/10.2204/iodp.proc.330.101.2012
Expedition 335 Scientists, 2012. Expedition 335 summary. In Teagle, D.A.H., Ildefonse, B., Blum, P., and the Expedition 335 Scientists, Proceedings of the Integrated Ocean Drilling Program. 335: Tokyo (Integrated Ocean Drilling Program Management International, Inc.). https://doi.org/10.2204/iodp.proc.335.101.2012
Govindaraju, K., 1994. 1994 compilation of working values and sample description for 383 geostandards. Geostandards Newsletter, 18(S1):1–158. https://doi.org/10.1046/j.1365-2494.1998.53202081.x-i1
Jochum, K.P., Nohl, U., Herwig, K., Lammel, E., Stoll, B., and Hofmann, A.W., 2005. GeoReM: a new geochemical database for reference materials and isotopic standards. Geostandards and Geoanalytical Research, 29(3):333–338. https://doi.org/10.1111/j.1751-908X.2005.tb00904.x
Johnston, R., Ryan, J.G. and the Expedition 366 Scientists, 2018. pXRF and ICP-AES characterization of shipboard rocks and sediments; protocols and strategies. In Fryer, P., Wheat, C.G., Williams, T., and the Expedition 366 Scientists, Proceedings of the International Ocean Discovery Program. 366: College Station, TX (International Ocean Discovery Program). https://doi.org/10.14379/iodp.proc.366.110.2018
Jonnalagadda, M.K., Belgrano, T.M., Ryan, J.G., Kempton, P.D., Evans, A.D., Grant, L.J.C., Teagle, D.A.H., Coggon, R.M., Reece, J.S., Sylvan, J.B., Williams, T.J., Estes, E.R., and the Expedition 390/393 Scientists, 2024. Supplementary material, https://doi.org/10.14379/iodp.proc.390393.210supp.2024. In Jonnalagadda, M.K., Belgrano, T.M., Ryan, J.G., Kempton, P.D., Evans, A.D., Grant, L.J.C., Teagle, D.A.H., Coggon, R.M., Reece, J.S., Sylvan, J.B., Williams, T.J., Estes, E.R., and the Expedition 390/393 Scientists, Data report: high downhole resolution portable X-ray fluorescence geochemistry of South Atlantic Transect basement cores, IODP Expeditions 390C, 395E, 390, and 393. In Coggon, R.M., Teagle, D.A.H., Sylvan, J.B., Reece, J., Estes, E.R., Williams, T.J., Christeson, G.L., and the Expedition 390/393 Scientists, South Atlantic Transect. Proceedings of the International Ocean Discovery Program, 390/393: College Station, TX (International Ocean Discovery Program).
Lemière, B., 2018. A review of pXRF (field portable X-ray fluorescence) applications for applied geochemistry. Journal of Geochemical Exploration, 188:350–363. https://doi.org/10.1016/j.gexplo.2018.02.006
Paul, B., Petrus, J., Savard, D., Woodhead, J., Hergt, J., Greig, A., Paton, C., and Rayner, P., 2023. Time resolved trace element calibration strategies for LA-ICP-MS. Journal of Analytical Atomic Spectrometry, 38(10):1995–2006. https://doi.org/10.1039/D3JA00037K
Reagan, M.K., Pearce, J.A., Petronotis, K., Almeev, R.R., Avery, A.J., Carvallo, C., Chapman, T., Christeson, G.L., Ferré, E.C., Godard, M., Heaton, D.E., Kirchenbaur, M., Kurz, W., Kutterolf, S., Li, H., Li, Y., Michibayashi, K., Morgan, S., Nelson, W.R., Prytulak, J., Python, M., Robertson, A.H.F., Ryan, J.G., Sager, W.W., Sakuyama, T., Shervais, J.W., Shimizu, K., and Whattam, S.A., 2017. Subduction initiation and ophiolite crust: new insights from IODP drilling. International Geology Review, 59(11):1439–1450. https://doi.org/10.1080/00206814.2016.1276482
Ryan, J.G., Shervais, J.W., Li, Y., Reagan, M.K., Li, H.Y., Heaton, D., Godard, M., Kirchenbaur, M., Whattam, S.A., Pearce, J.A., Chapman, T., Nelson, W., Prytulak, J., Shimizu, K., and Petronotis, K., 2017. Application of a handheld X-ray fluorescence spectrometer for real-time, high-density quantitative analysis of drilled igneous rocks and sediments during IODP Expedition 352. Chemical Geology, 451:55–66. https://doi.org/10.1016/j.chemgeo.2017.01.007
Triantafyllou, A., Mattielli, N., Clerbois, S., Da Silva, A.C., Kaskes, P., Claeys, P., Devleeschouwer, X., and Brkojewitsch, G., 2021. Optimizing multiple non-invasive techniques (PXRF, pMS, IA) to characterize coarse-grained igneous rocks used as building stones. Journal of Archaeological Science, 129:105376. https://doi.org/10.1016/j.jas.2021.105376