Next Section | Table of Contents
doi:10.2204/iodp.sp.309312.2005
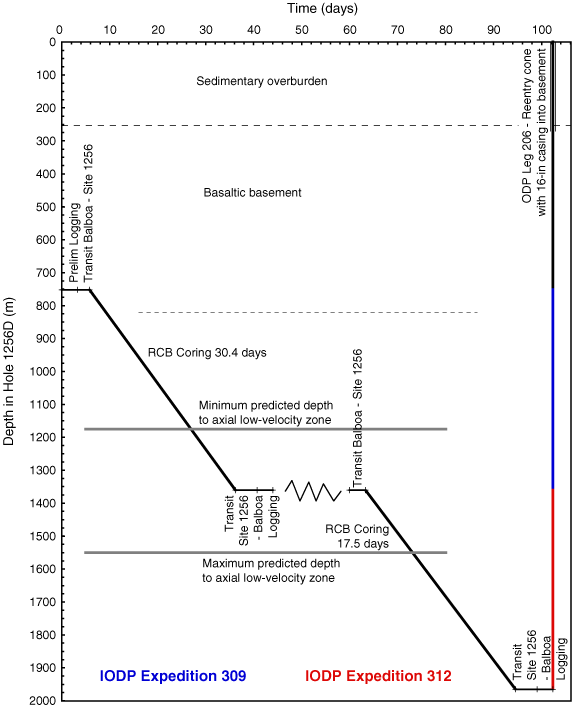
Figure F5. Depth versus time graph for drilling and wireline logging operations for Expeditions 309 and 312. Solid line shows the current depth of Hole 1256D. Horizontal lines show the range of depths at which axial low-velocity zones, now frozen as gabbros, are predicted to occur. Drilling rates and pipe-trip times as calculated in Table T1. RCB = rotary core barrel.
