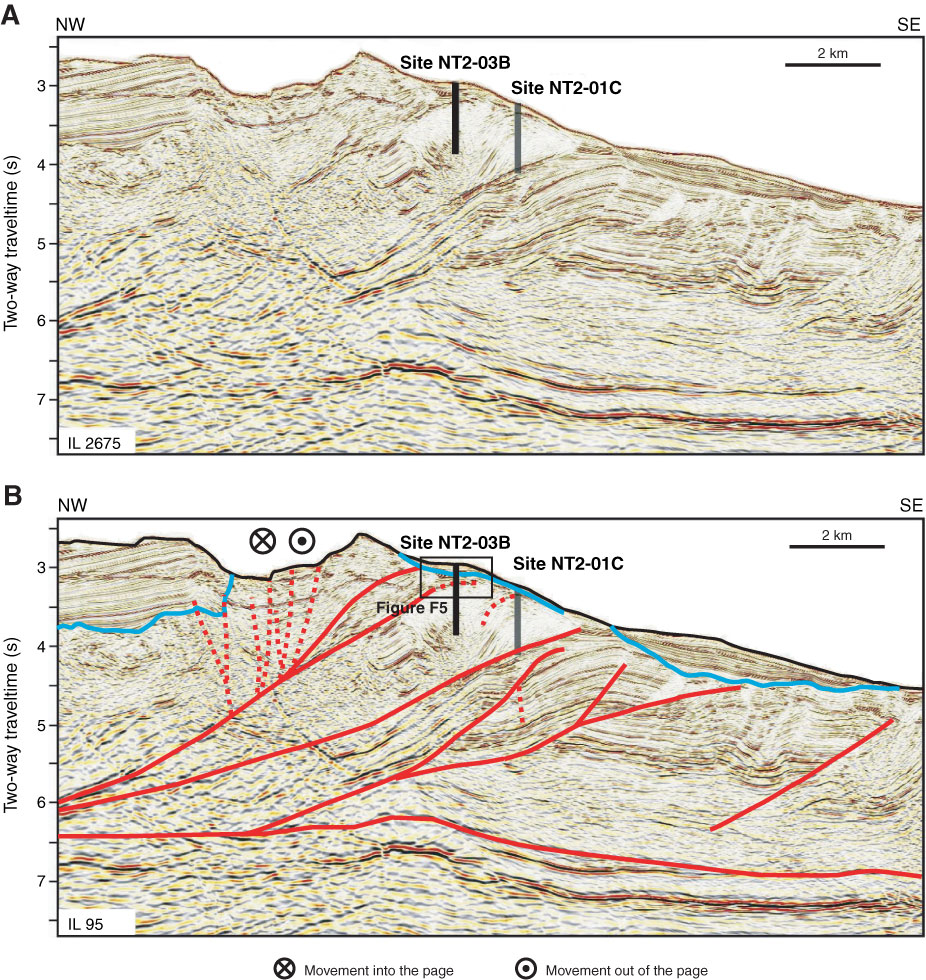
Figure F4. A. Seismic cross-section of drill site taken by three-dimensional reflection seismic survey in 2006. B. Interpretation of
A. Red line = fault, blue line = unconformity. Black box = area of close-up view shown in Figure F5.
Previous | Close | Next | Top of page