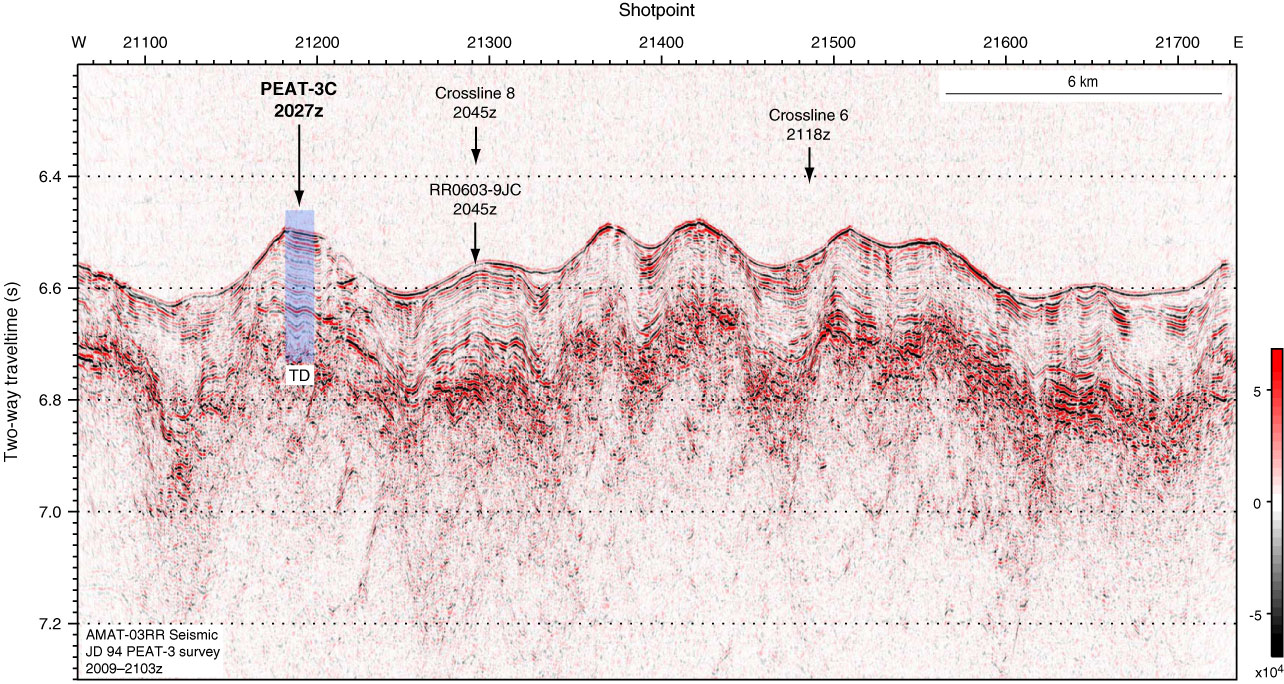
Figure F18. PEAT-3C Line 3, annotated in shotpoints. Profiles are filtered, stacked, and migrated. Colors correspond to the relative amplitude of the seismic signal (black = negative amplitude, red = positive amplitude). TD = total depth.
Previous | Close | Next | Top of page