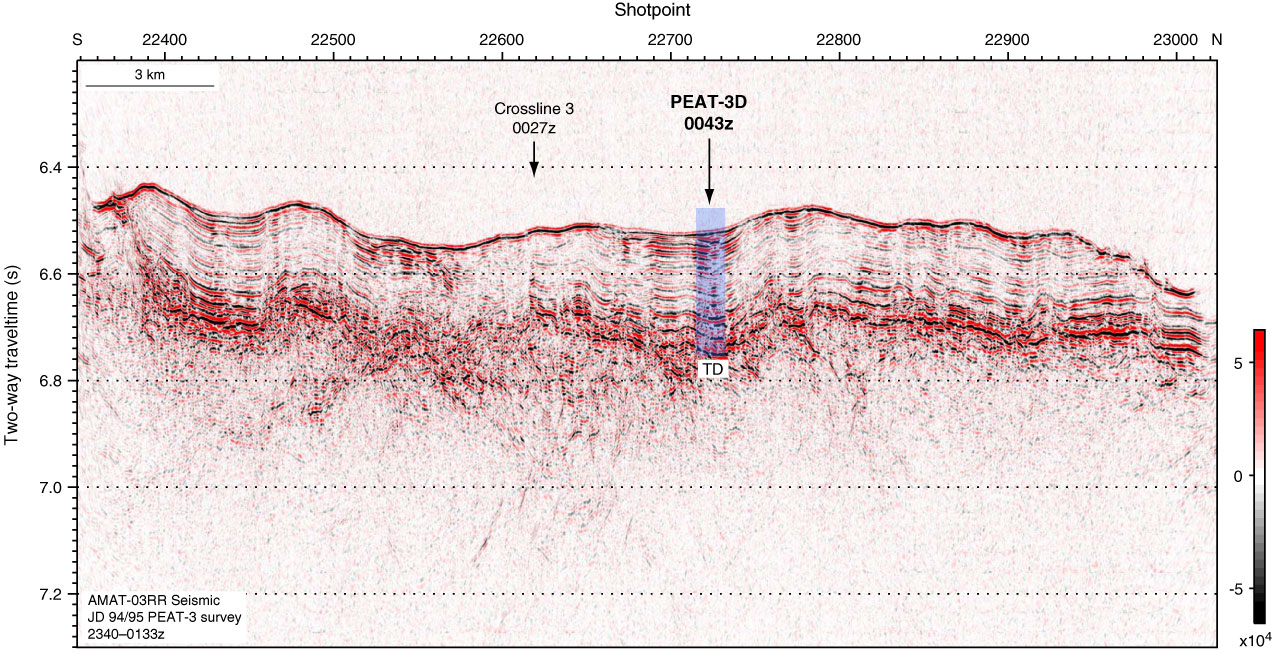
Figure F19. Alternate Site PEAT-3D shown on PEAT-3C Line 6, annotated in shotpoints. The site was moved north of the cross with Line 3 to an area with a better defined sediment column. Color corresponds to the relative amplitude of the seismic signal (black = negative amplitude, red = positive amplitude). TD = total depth.

Previous | Close | Next | Top of page