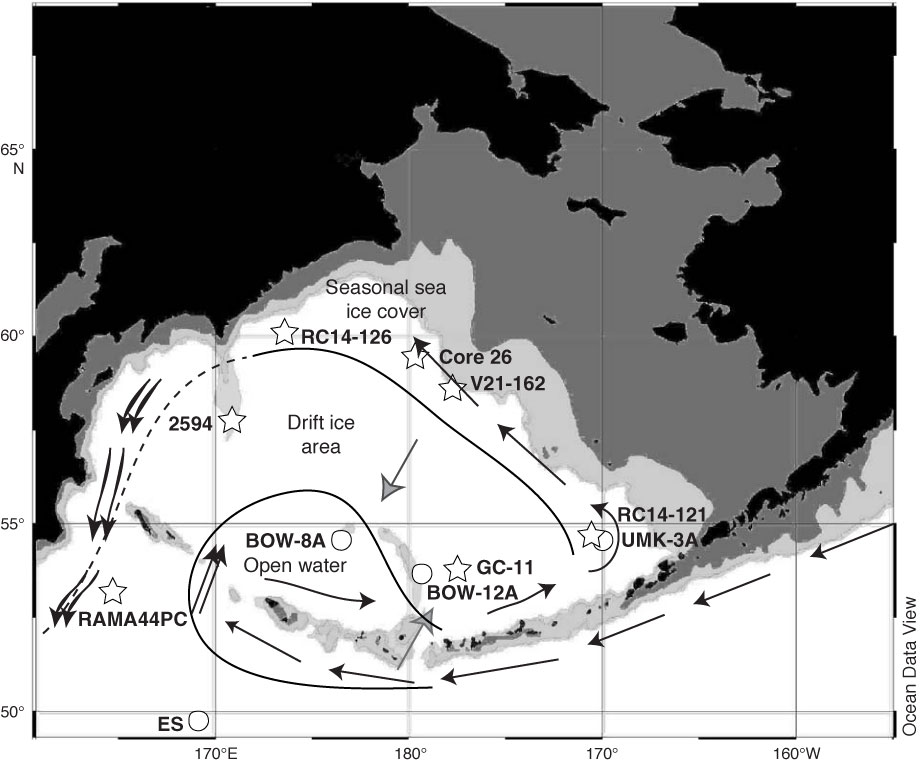
Figure F4. Past sea ice cover and surface circulation system when sea level dropped 100 m below that of today in the Bering Sea and the subarctic Pacific. Dark gray area = paleocontinental shelf, light gray area = paleobathymetry between 400 and 900 m isobaths. Double black arrows = stronger flow than today, gray arrows = weaker flow than today. Circles = cores examined by Katsuki and Takahashi (2005), stars = cores reported from various sources as cited in Katsuki and Takahashi (2005). ES = Emperor Seamount.
Previous | Close | Next | Top of page