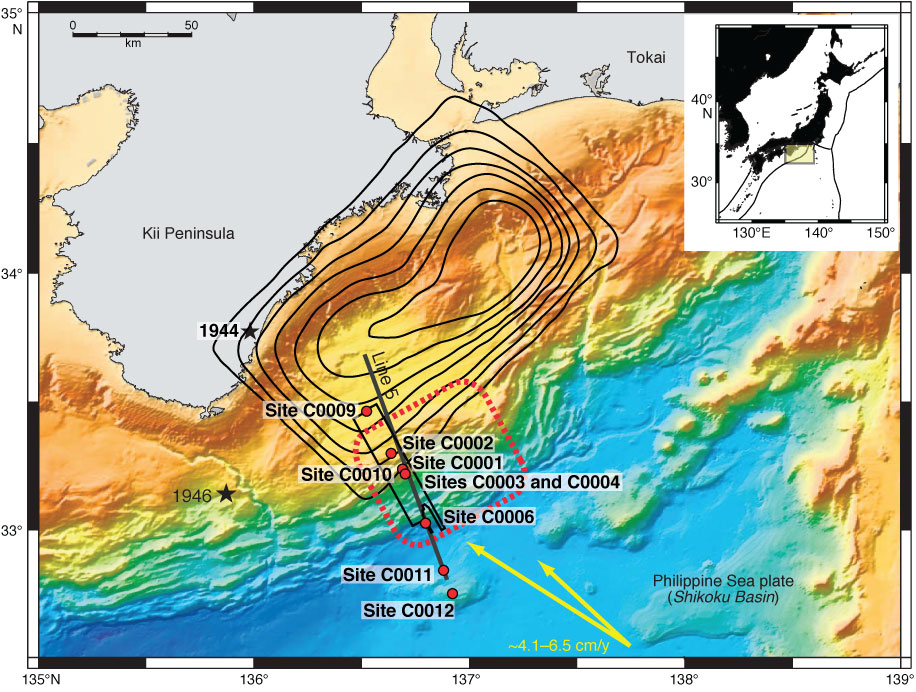
Figure F1. Map of Nankai accretionary complex off Kumano showing drill sites. Yellow arrows = computed far-field convergence vectors between Philippine Sea plate and Japan (Seno et al., 1993; Heki, 2007), contours = estimated slip during the 1944 event (0.5 m intervals) (Kikuchi et al., 2003), red box = region of recorded VLFs (Obara and Ito, 2005), red circles = NanTroSEIZE boreholes (as of 2010).
Close | Next | Top of page