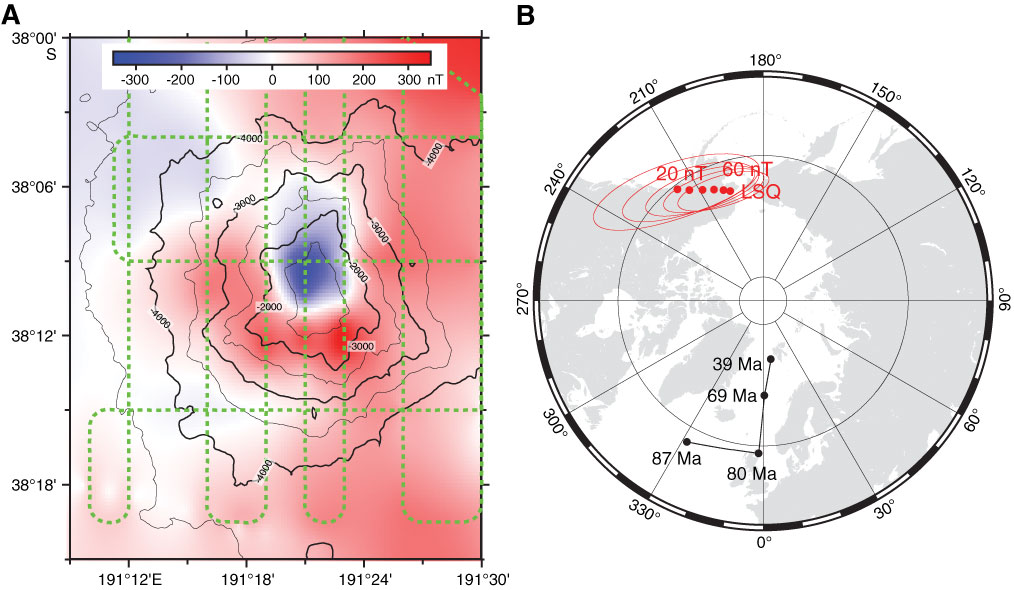
Figure F9. Magnetic anomaly pattern and paleopole positions for the seamount at 168.6°W. A. Magnetic anomaly pattern (red/blue scale) and topography (black lines = 500 m contours). Dashed green line = survey track. B. Paleopole positions (and 95% bounds [red]) derived from uniform magnetization component for misfits of 60–20 nT compared to Pacific poles from Sager and Pringle (1987) (black). LSQ = least squares solution. Note that the anomaly pattern is of quite low amplitude and relatively complex, possibly suggesting the presence of dual polarities (reversed polarity dominant).
Previous | Close | Next | Top of page