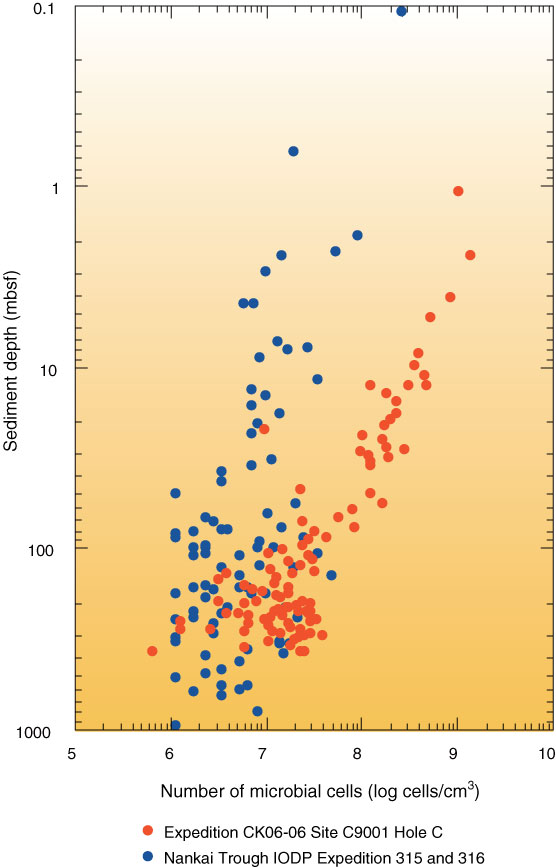
Figure F2. Microbial cell abundance in marine subsurface sediments. Red = cell abundance in sediments cored from offshore Shimokita Peninsula, blue = cell abundance in sediments cored from offshore Nankai Trough seismogenic zone. Plot data were obtained by the image-based cell enumeration technique (Morono et al., 2009).
Previous | Close | Next | Top of page