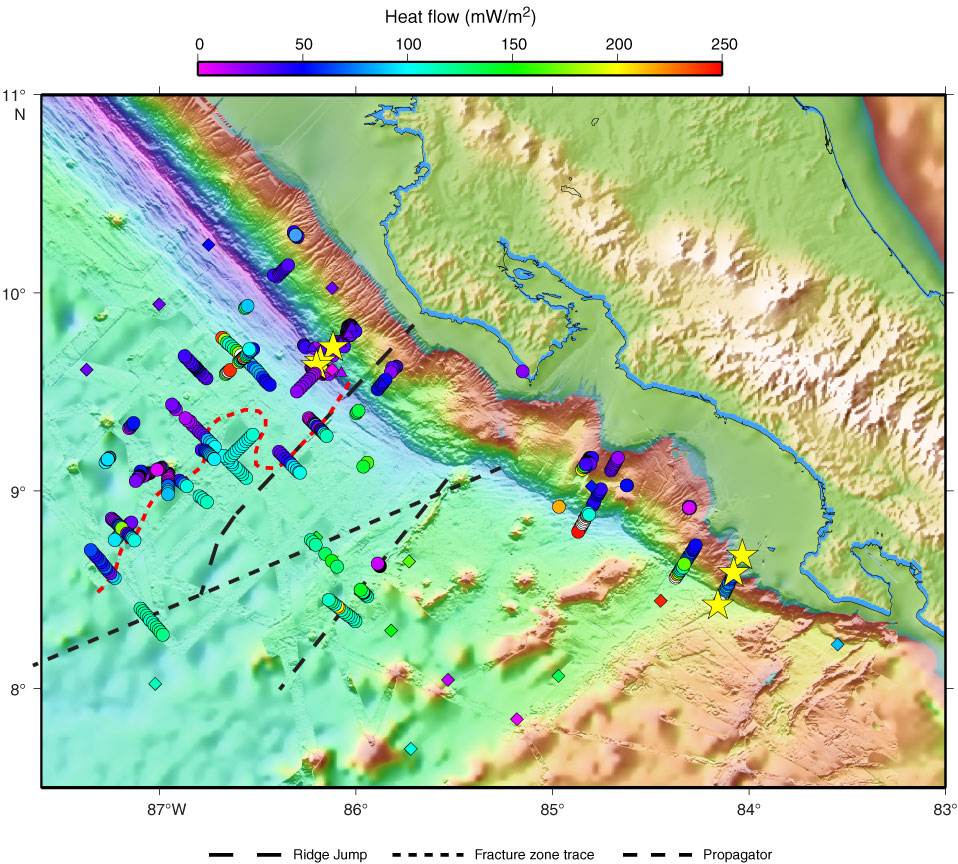
Figure F7. Heat flow data offshore Costa Rica. Color-coded circles indicate heat-flow values (von Herzen and Uyeda, 1963; Vacquier et al., 1967; Langseth and Silver, 1996; Fisher et al., 2003; Hutnak et al., 2007; Harris et al., 2010a). Stars show location of drill sites. Dashed red line indicates position of the thermal transition between areas of relatively low and high heat flow. EPR-generated crust to the north of the triple junction and fracture zone traces has heat flow suppressed by roughly 70%, whereas CNS-generated crust to the south generally has heat flow that matches conductive lithospheric cooling models (Hutnak et al., 2007, 2008).
Previous | Close | Next | Top of page