Previous | Close | Next
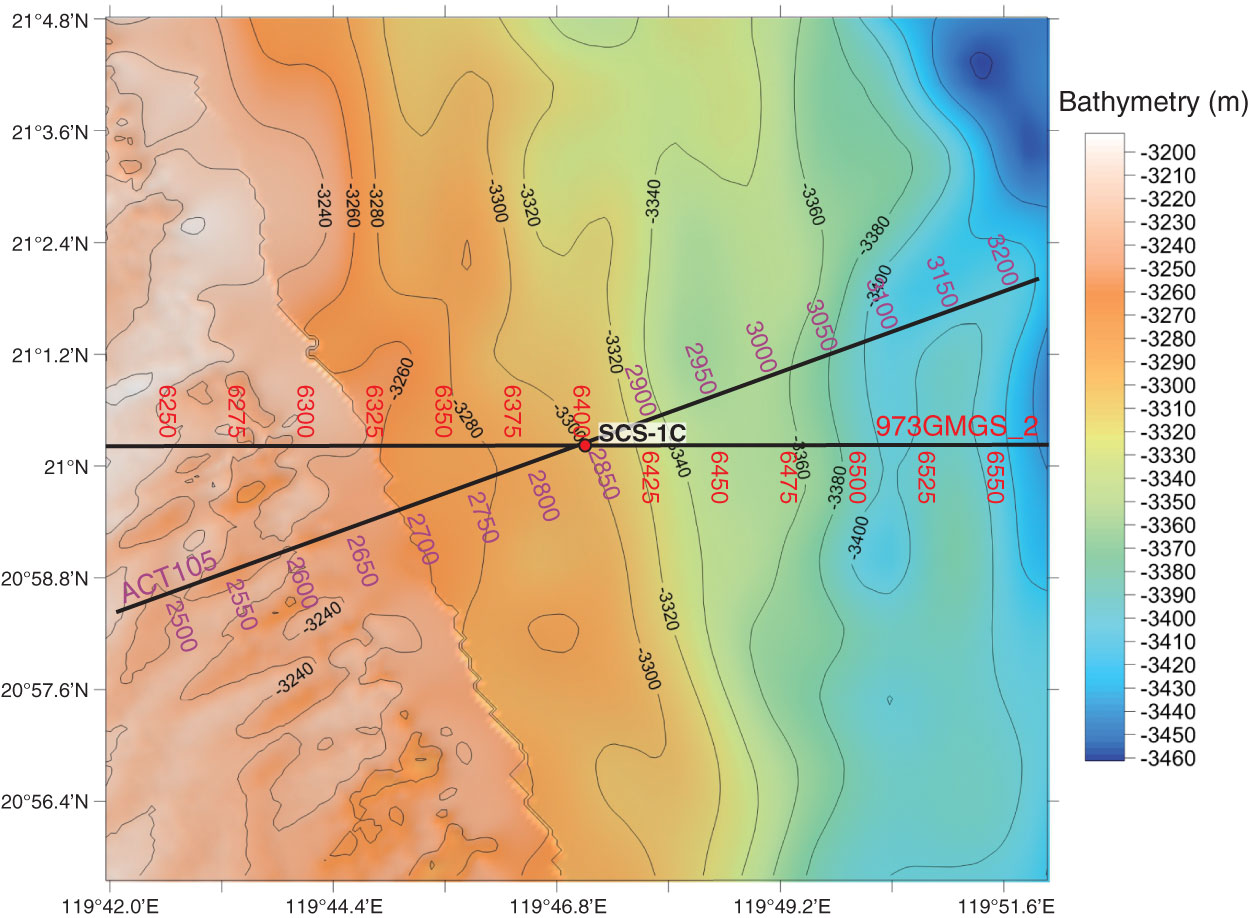
Figure AF40. Contoured bathymetric map showing seismic reflection Profiles 973GMGS_2 (Fig. AF41) and ACT105 (Fig. AF42) and the location of proposed Site SCS-1C. Contour interval = 20 m.
Previous | Close | Next | Top of page