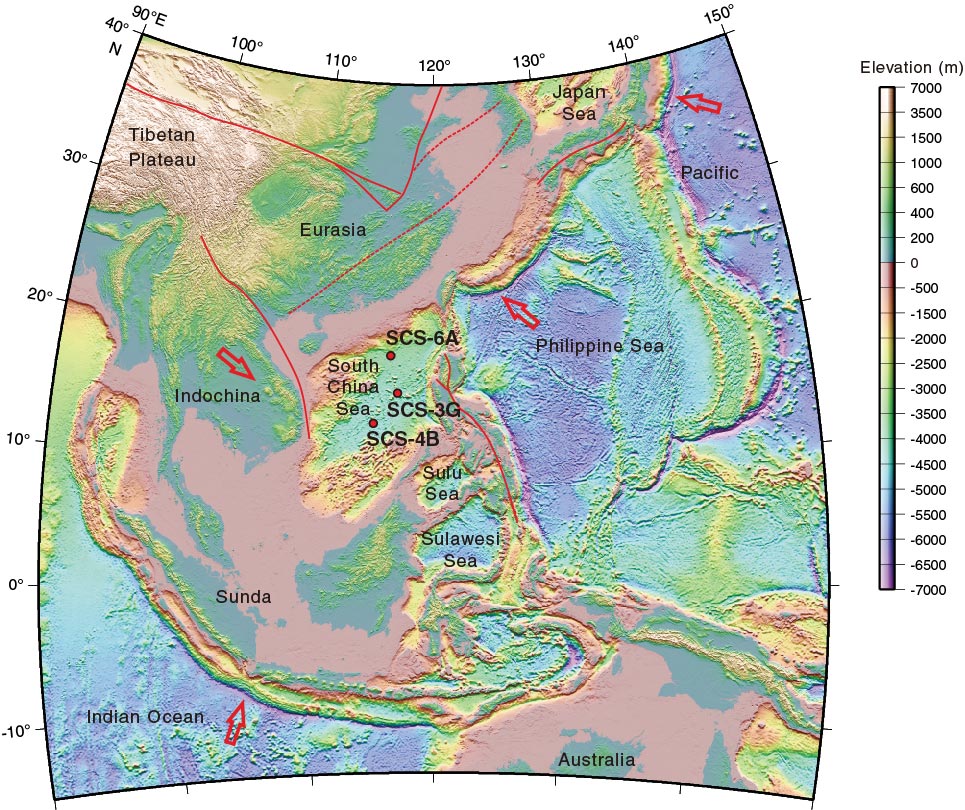
Figure F1. Regional topography and geodynamic framework of Southeast Asia. Data based on Smith and Sandwell (1997). Red lines = regional faults. Red arrows show directions of plate movements. Red dots in the South China Sea = primary drill sites for this expedition.
Close | Next | Top of page