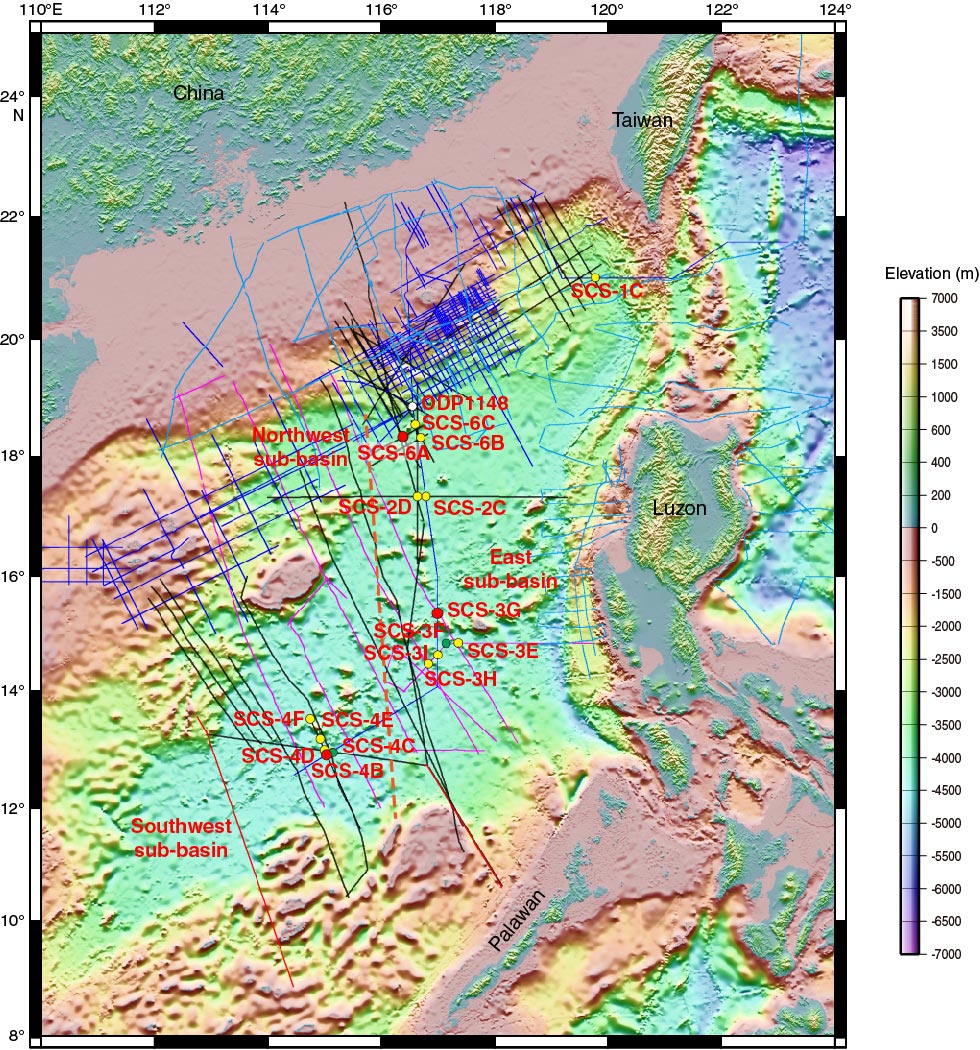
Figure F2. Topographic and bathymetric map of the South China Sea and surrounding region. Dashed red line = inferred Zhongnan fault. Red dots = primary sites for the operations plan. Green dots = primary sites for the backup operations plan (Site SCS-6A is a primary site for both operations plans). Yellow dots = alternate sites. White dot = location of ODP Site 1148. Pink lines = seismic surveys collected by the BGR using the R/V Sonne in 1987 (SO49) and 2008 (SO197). Blue, red, and black solid lines = seismic data collected by Chinese research institutes and oil companies. Turquoise lines = reflection seismic data acquired in the 1980s from Cruises V3607, V3608, V3613, V3614, and RC2006.
Previous | Close | Next | Top of page