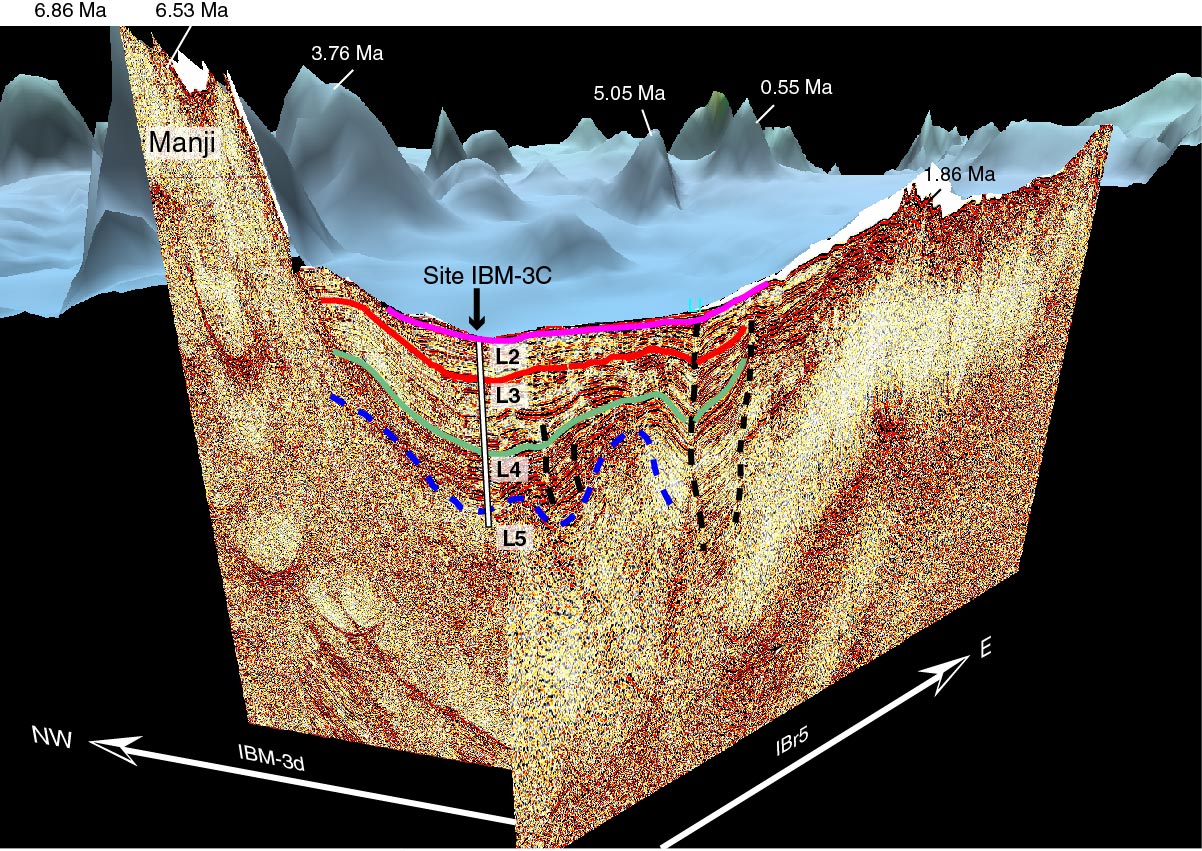
Figure F13. Seismic profile of cross point between Lines IBr5 and IBM-3d around proposed Site IBM-3C, looking toward the volcanic front. The Manji chain is to the left, and the Enpo chain to the right. Pink, red, green, and blue lines = boundaries between seismic Layers L1–L5. Black dotted line = fault.
Previous | Close | Next | Top of page