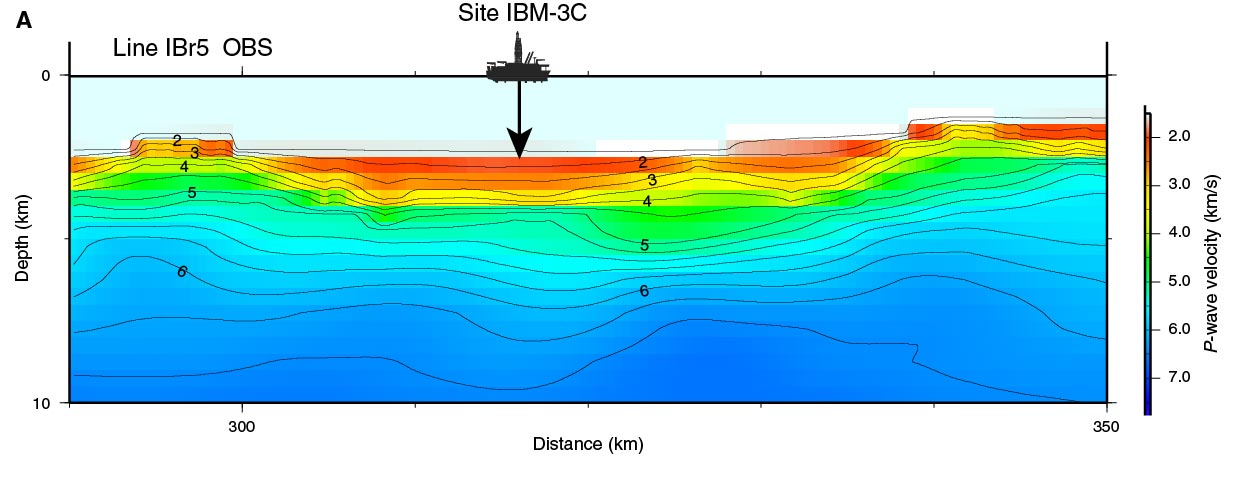
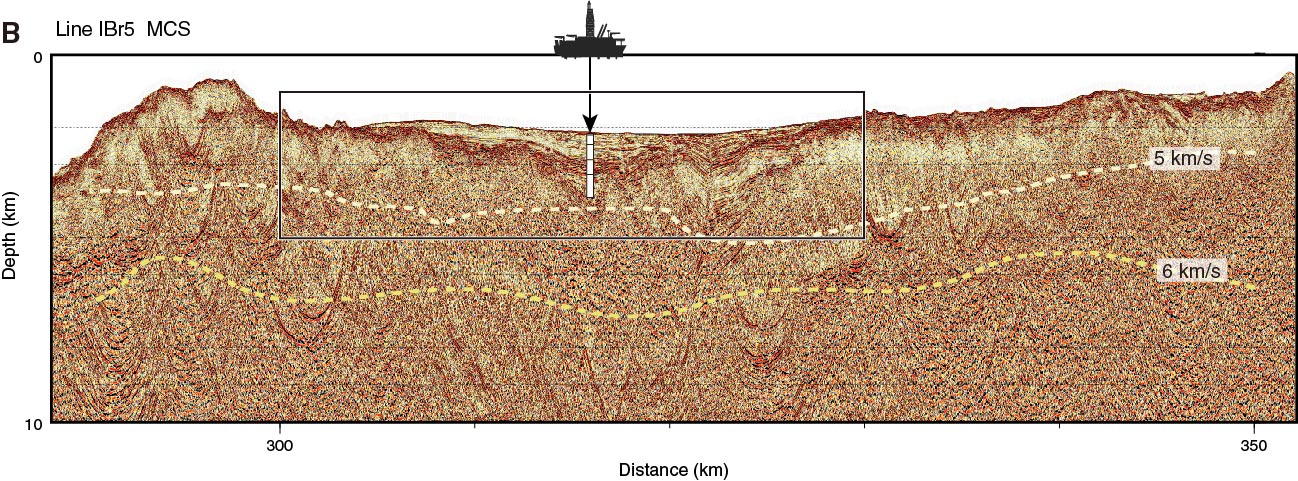
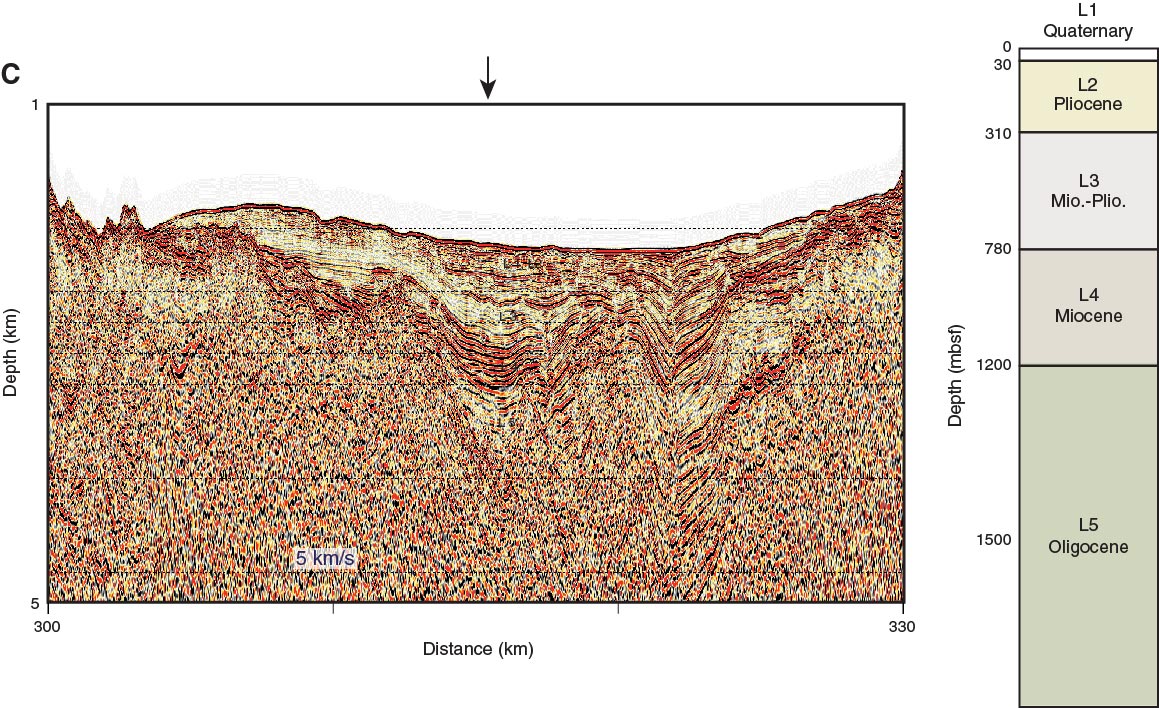
Figure F14. A. Seismic velocity image obtained from wide-angle ocean-bottom seismometer (OBS) data. OBSs are deployed every 5 km along Line IBr5. B. Depth-converted multichannel seismic (MCS) reflection profile along Line IBr5. Yellow lines = iso-velocity contours of 5 and 6 km/s obtained from the seismic velocity image in A, which are interpreted as the depth to igneous basement (upper crust) and middle crust, respectively. C. Lithologic interpretation of the seismic image.
Previous | Close | Next | Top of page