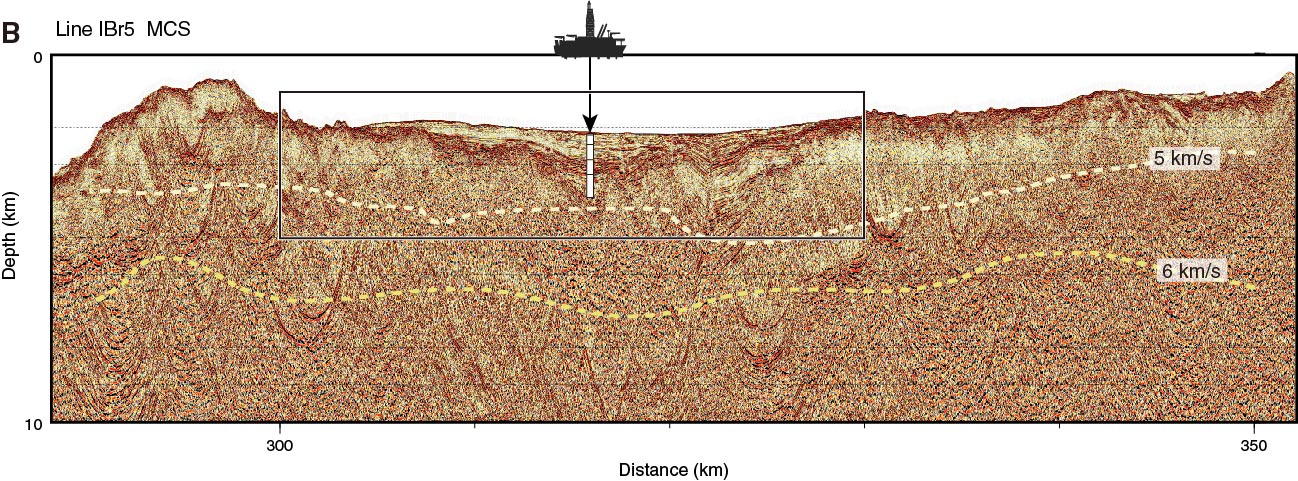
Figure F14 (continued). B. Depth-converted multichannel seismic (MCS) reflection profile along Line IBr5. Yellow lines = iso-velocity contours of 5 and 6 km/s obtained from the seismic velocity image in Figure F14A, which are interpreted as the depth to igneous basement (upper crust) and middle crust, respectively. (Continued on next page.)
Previous | Close | Next | Top of page