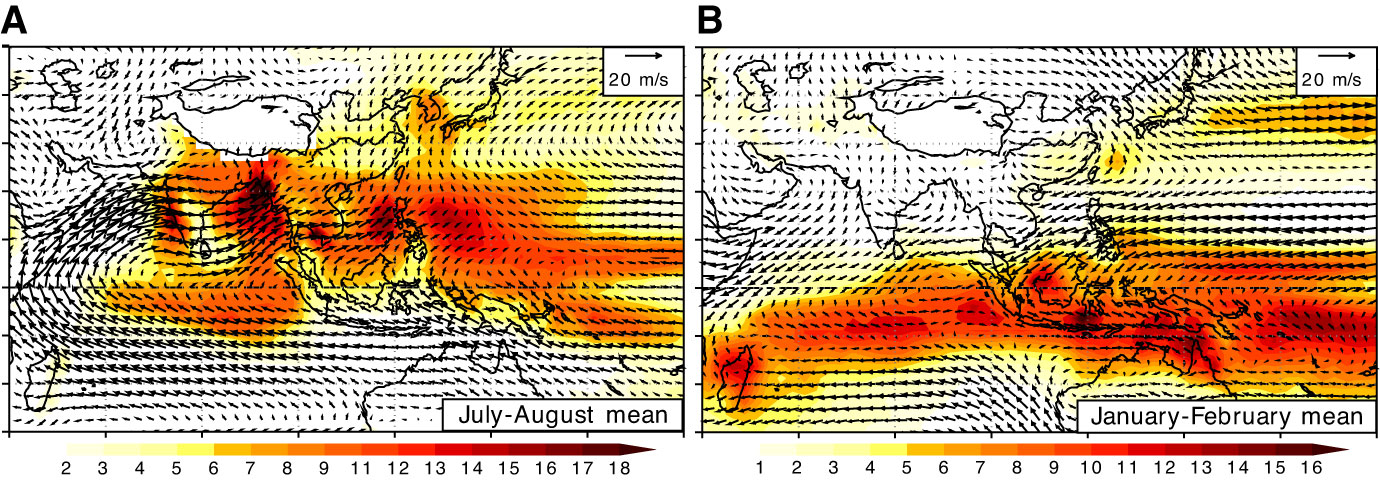
Figure F2. Climatological (A) July–August and (B) January–February mean precipitation rates (shading in mm/day) and 925 hPa wind vectors (arrows). Precipitation and wind climatology are derived from CMAP (Xie and Arkin, 1997) (1979–2000) and NCEP/NCAR reanalysis (1951–2000), respectively.
Previous | Close | Next | Top of page