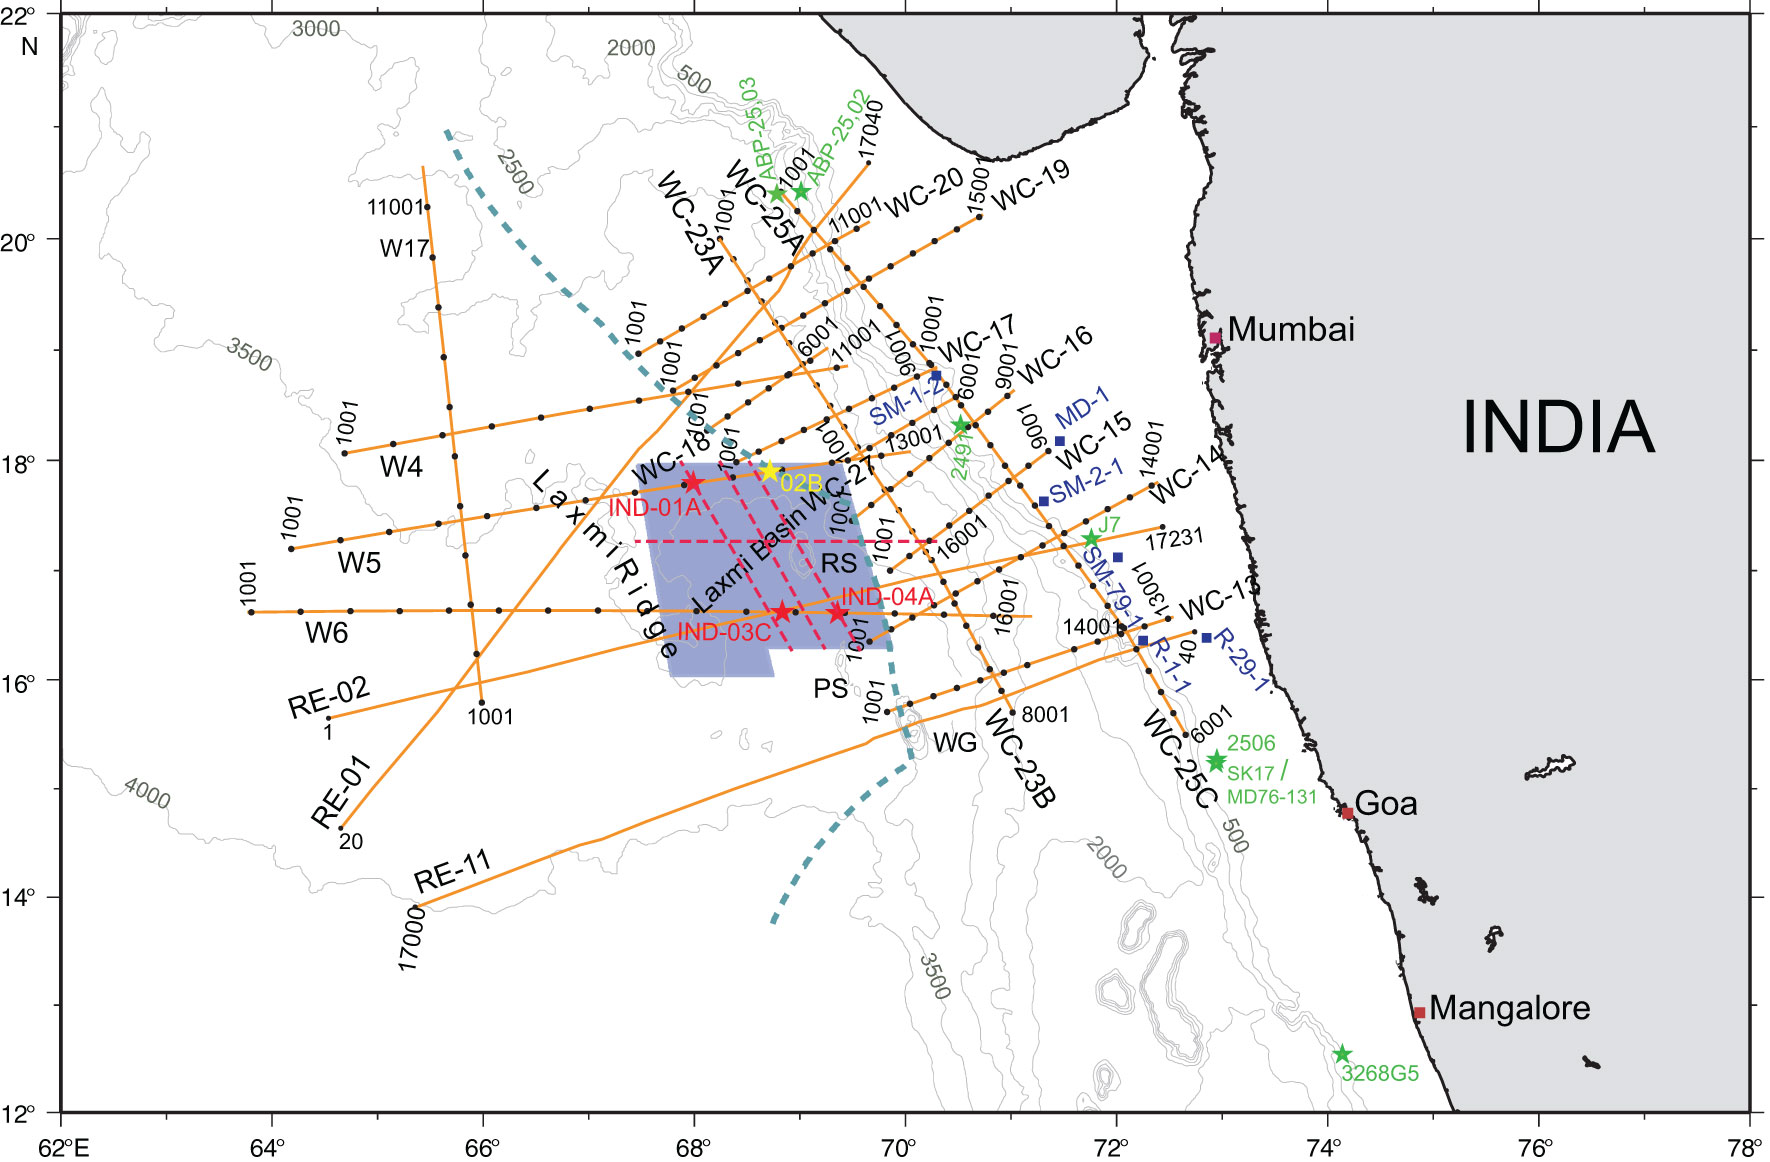
Figure F3. Multichannel seismic grid map in the eastern Arabian Sea. Solid blue circles represent industry wells. Green stars represent locations of shallow cores from published studies (ABP-25: Gupta et al., 2011; 2491, J7, 2506, 3268G5: Bhushan et al., 2001; SK17/MD76-131: Singh et al., 2011). Red stars represent Expedition 355 proposed primary sites. Yellow star represents proposed alternate site. Blue shaded area indicates high-resolution multibeam bathymetry shown in Figure F6. RS = Raman Seamount, PS = Panikkar Seamount, WG = Wadia Guyot.
Previous | Close | Next | Top of page