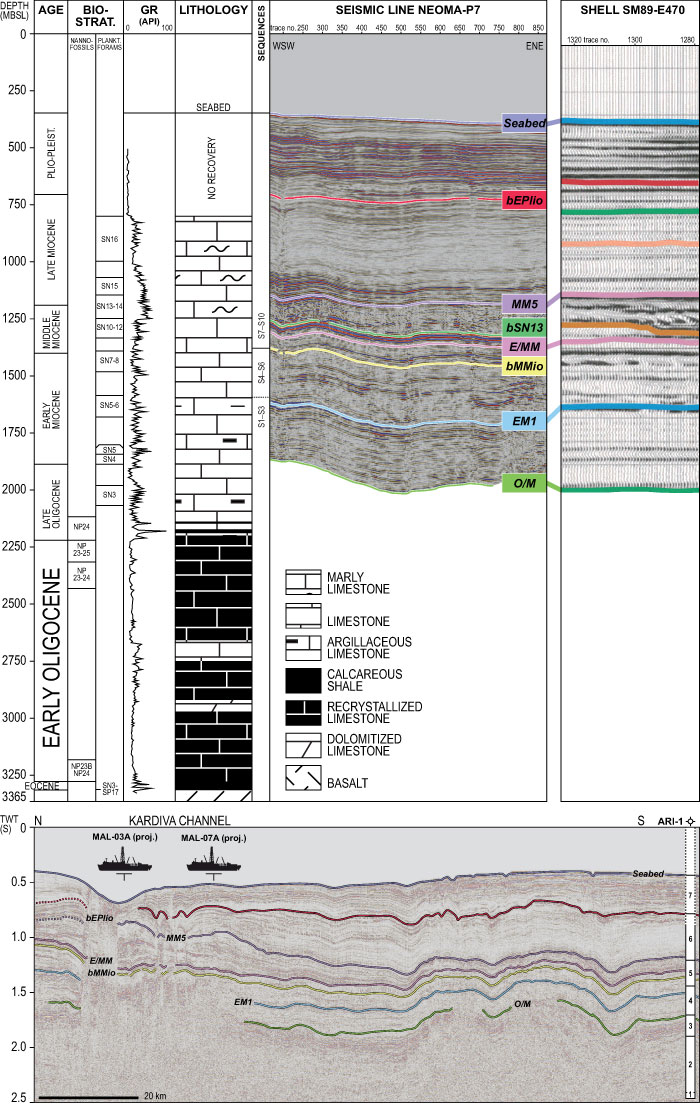
Figure F3. Top: well-to-seismic tie for establishment of chronostratigraphic framework. Age, biostratigraphy, gamma ray log, and lithology columns are taken from industry Well ARI-1 (modified after Belopolsky and Droxler, 2004a). Depth conversion of seismic Line NEOMA-P7 was done using an irregular spaced velocity log from Well ARI-1. High-resolution seismics are displayed in red to yellow and blue to turquoise colors corresponding to changes in peak and trough amplitudes, respectively (SEG normal polarity). Shell seismic line after Belopolsky and Droxler (2004b). Bottom: west–east crossing seismic Line NEOMA-P7 (vertical exaggeration = 25×) with Well ARI-1 (cf. Figure F1). 1 = Eocene, 2 = early Oligocene, 3 = late Oligocene, 4 = early Miocene, 5 = middle Miocene, 6 = late Miocene, 7 = Pliocene–Pleistocene (Betzler et al., 2013).
Previous | Close | Next | Top of page