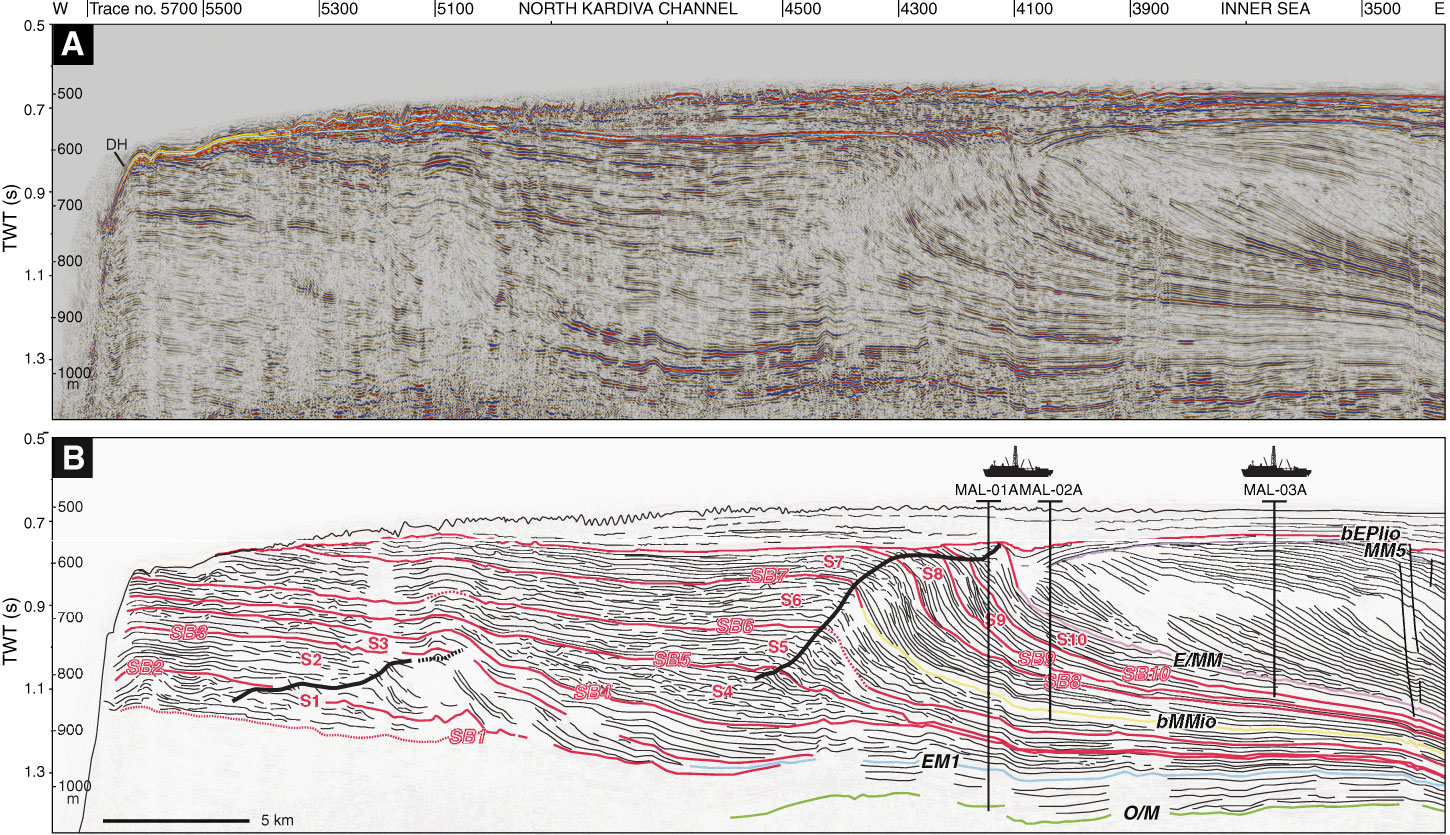
Figure F5. A. Close view of the western part of seismic Line NEOMA-P65 (vertical exaggeration = 7.5×) running west–east through northern Kardiva Channel. B. Interpretation (Betzler et al., 2013a). S1–S10 and SB1–SB10 refer to sequences and sequence boundaries, respectively. Black line = bank edge growth path.
Previous | Close | Next | Top of page