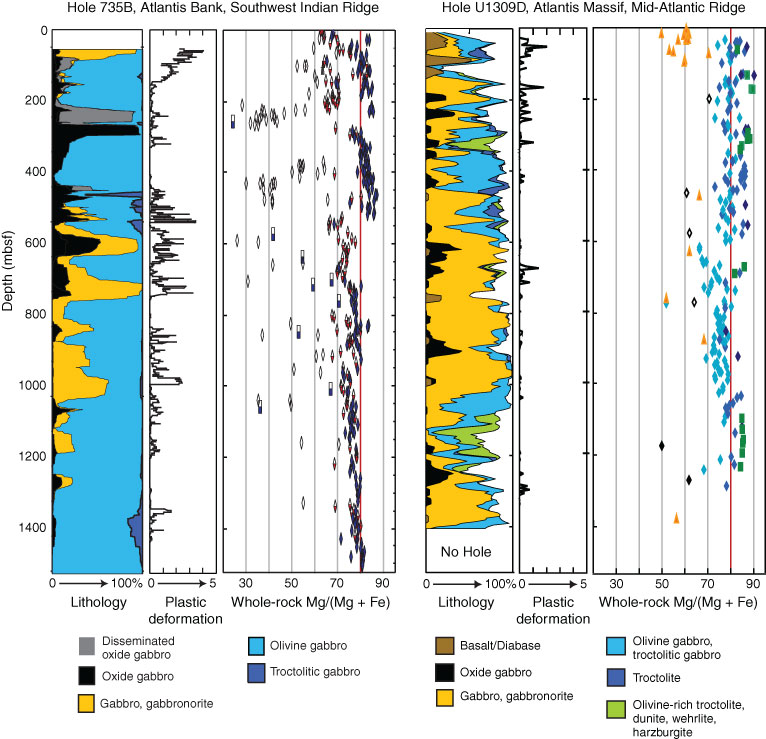
Figure F6. Lithostratigraphy of ODP Hole 735B and comparison with IODP Hole U1309D from the Mid-Atlantic Ridge at 30°N, modified from Dick et al. (2000) and Blackman et al. (2006, 2011). Lithologies are running 20 m downhole averages of the rock proportions, with those for Hole 735B normalized to 100% recovery, whereas those for Hole U1309D are shown as a proportion of the intervals drilled. Different symbols for the points in the whole rock Mg# diagram are for different lithologies based on modal mineralogy and can be found in the ODP Legs 118 and 176 Initial Reports volumes and IODP Expedition 304/305 reports (Robinson, Von Herzen, et al., 1989; Dick, Natland, Miller, et al., 1999; Blackman, Ildefonse, John, Ohara, Miller, MacLeod, and Expedition. 304/305 Scientists, 2006). These sections represent the descriptions of two different scientific parties, and whereas both followed AGI conventions on nomenclature, the exact definitions for each lithology described may vary. The red line at Mg# 80 is to emphasize the overall chemical differences in the sections. Primary melts emerging from the mantle would be in equilibrium with gabbroic cumulates and dunites with an Mg# Š90, which are largely missing in both sections.
Previous | Close | Next | Top of page