Gillis, K.M., Snow, J.E., Klaus, A., and the Expedition 345 Scientists
Proceedings of the Integrated Ocean Drilling Program Volume 345
publications.iodp.org
https://doi.org/10.2204/iodp.proc.345.201.2026
Data report: crustal structure near IODP Expedition 345, Hess Deep Plutonic Crust1
Gail L. Christeson2
1 Christeson, G.L., 2026. Data report: crustal structure near IODP Expedition 345, Hess Deep Plutonic Crust. In Gillis, K.M., Snow, J.E., Klaus, A., and the Expedition 345 Scientists, Proceedings of the Integrated Ocean Drilling Program, 345: College Station, TX (Integrated Ocean Drilling Program). https://doi.org/10.2204/iodp.proc.345.201.2026
2 University of Texas Institute for Geophysics and US National Science Foundation, USA. Correspondence author: [email protected]
Abstract
This report presents an analysis of ocean-bottom seismometer data to constrain crustal structure near Integrated Ocean Drilling Program (IODP) Expedition 345 (Hess Deep) Site U1415. Average crustal thickness is 5.0–5.5 km, which is less than the global average for oceanic crust; the decreased crustal thickness is accommodated by a thinner Layer 3 than the global average. Velocities at the top of Layer 3 of 5.9–6.1 km/s are slower than the global average of 6.33 km/s for young oceanic crust.
1. Introduction
Integrated Ocean Drilling Program (IODP) Expedition 345 (Hess Deep) Site U1415 recovered plutonic rocks (primarily olivine gabbro and troctolite) from oceanic crust formed at the fast-spreading East Pacific Rise (Expedition 345 Scientists, 2014). Low-resolution deep seismic reflection data indicate a crustal thickness of 5–5.5 km for oceanic crust north of the drill site (Zonenshain et al., 1980). This report presents an analysis of active-source ocean-bottom seismometer (OBS) data to provide improved constraints for crustal structure near Site U1415 (Figure F1).
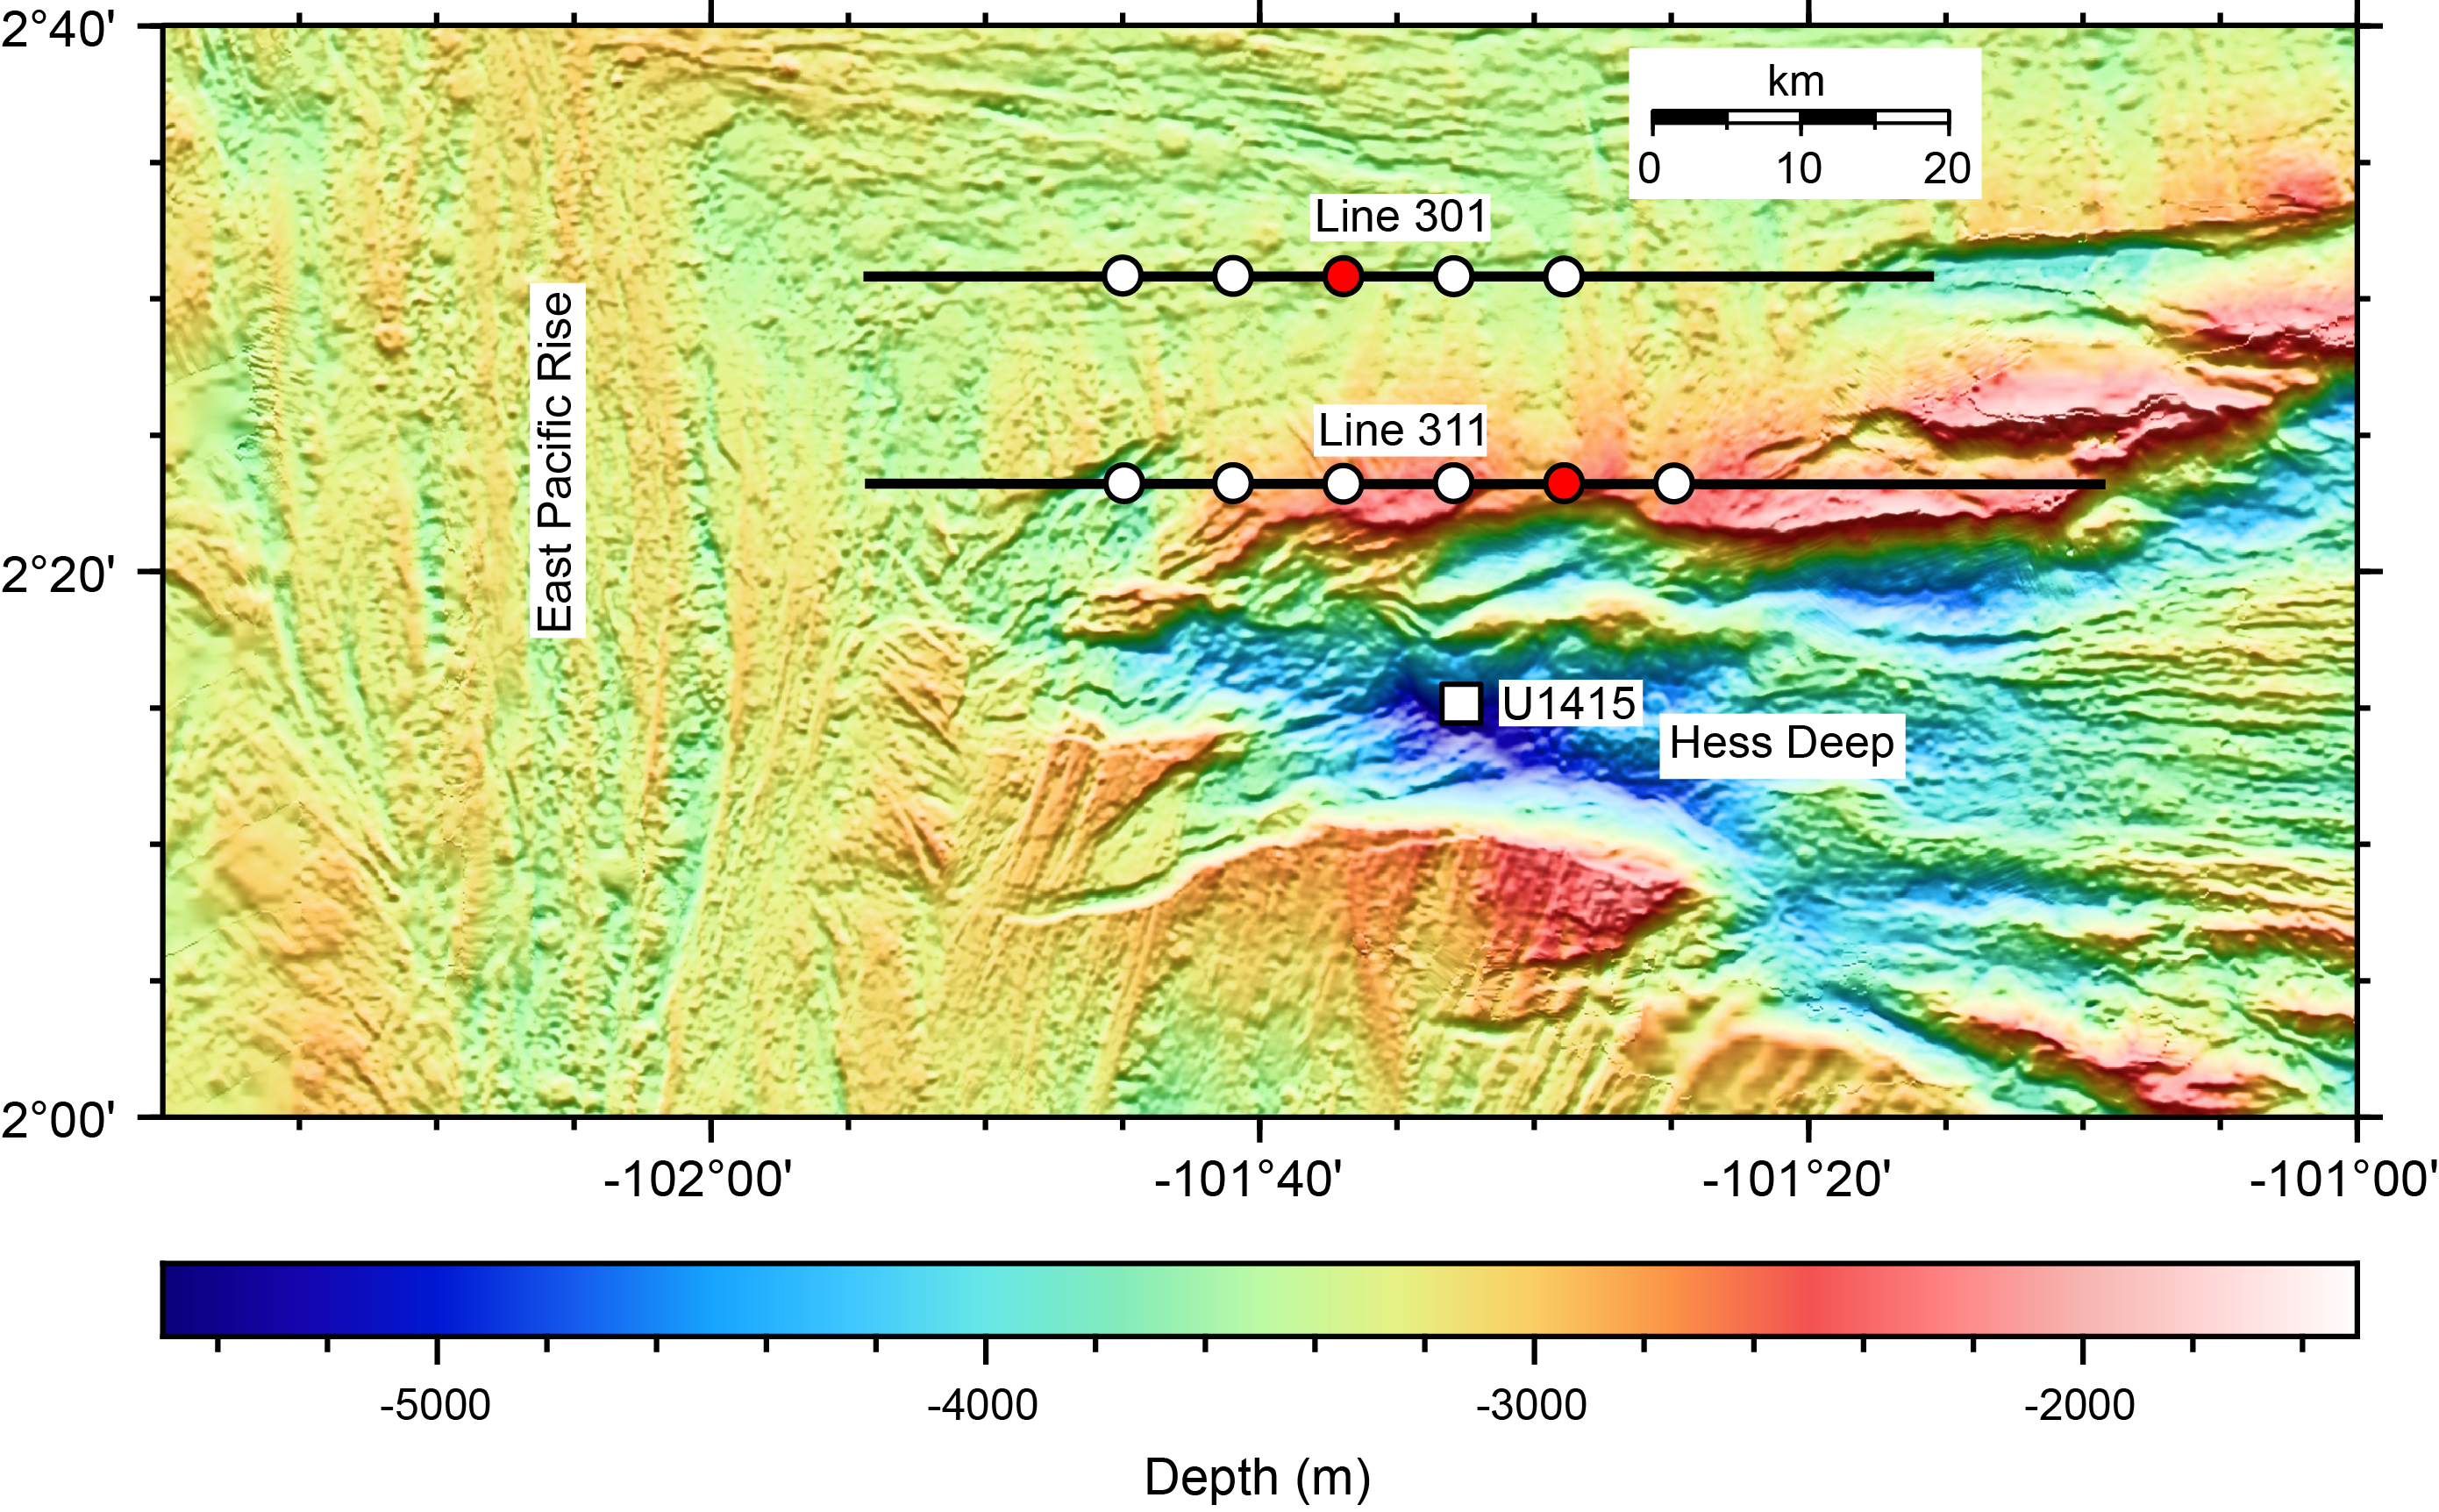
Figure F1. Location map.
2. Methods and materials
Cruise EW0305 took place in 2003 on the research vessel (R/V) Maurice Ewing. Seismic Lines 301 and 311 (Figure F1) were acquired with a 20 air gun array sound source with a total volume of 3660 inch3. Shot spacing was 150 m for Line 301 and 200 m for Line 311. A total of 5–6 OBSs were positioned at 7.5 km spacing along each profile and recorded a hydrophone, vertical channel, and 2 horizontal channels. Two sample record sections are displayed in Figure F2.
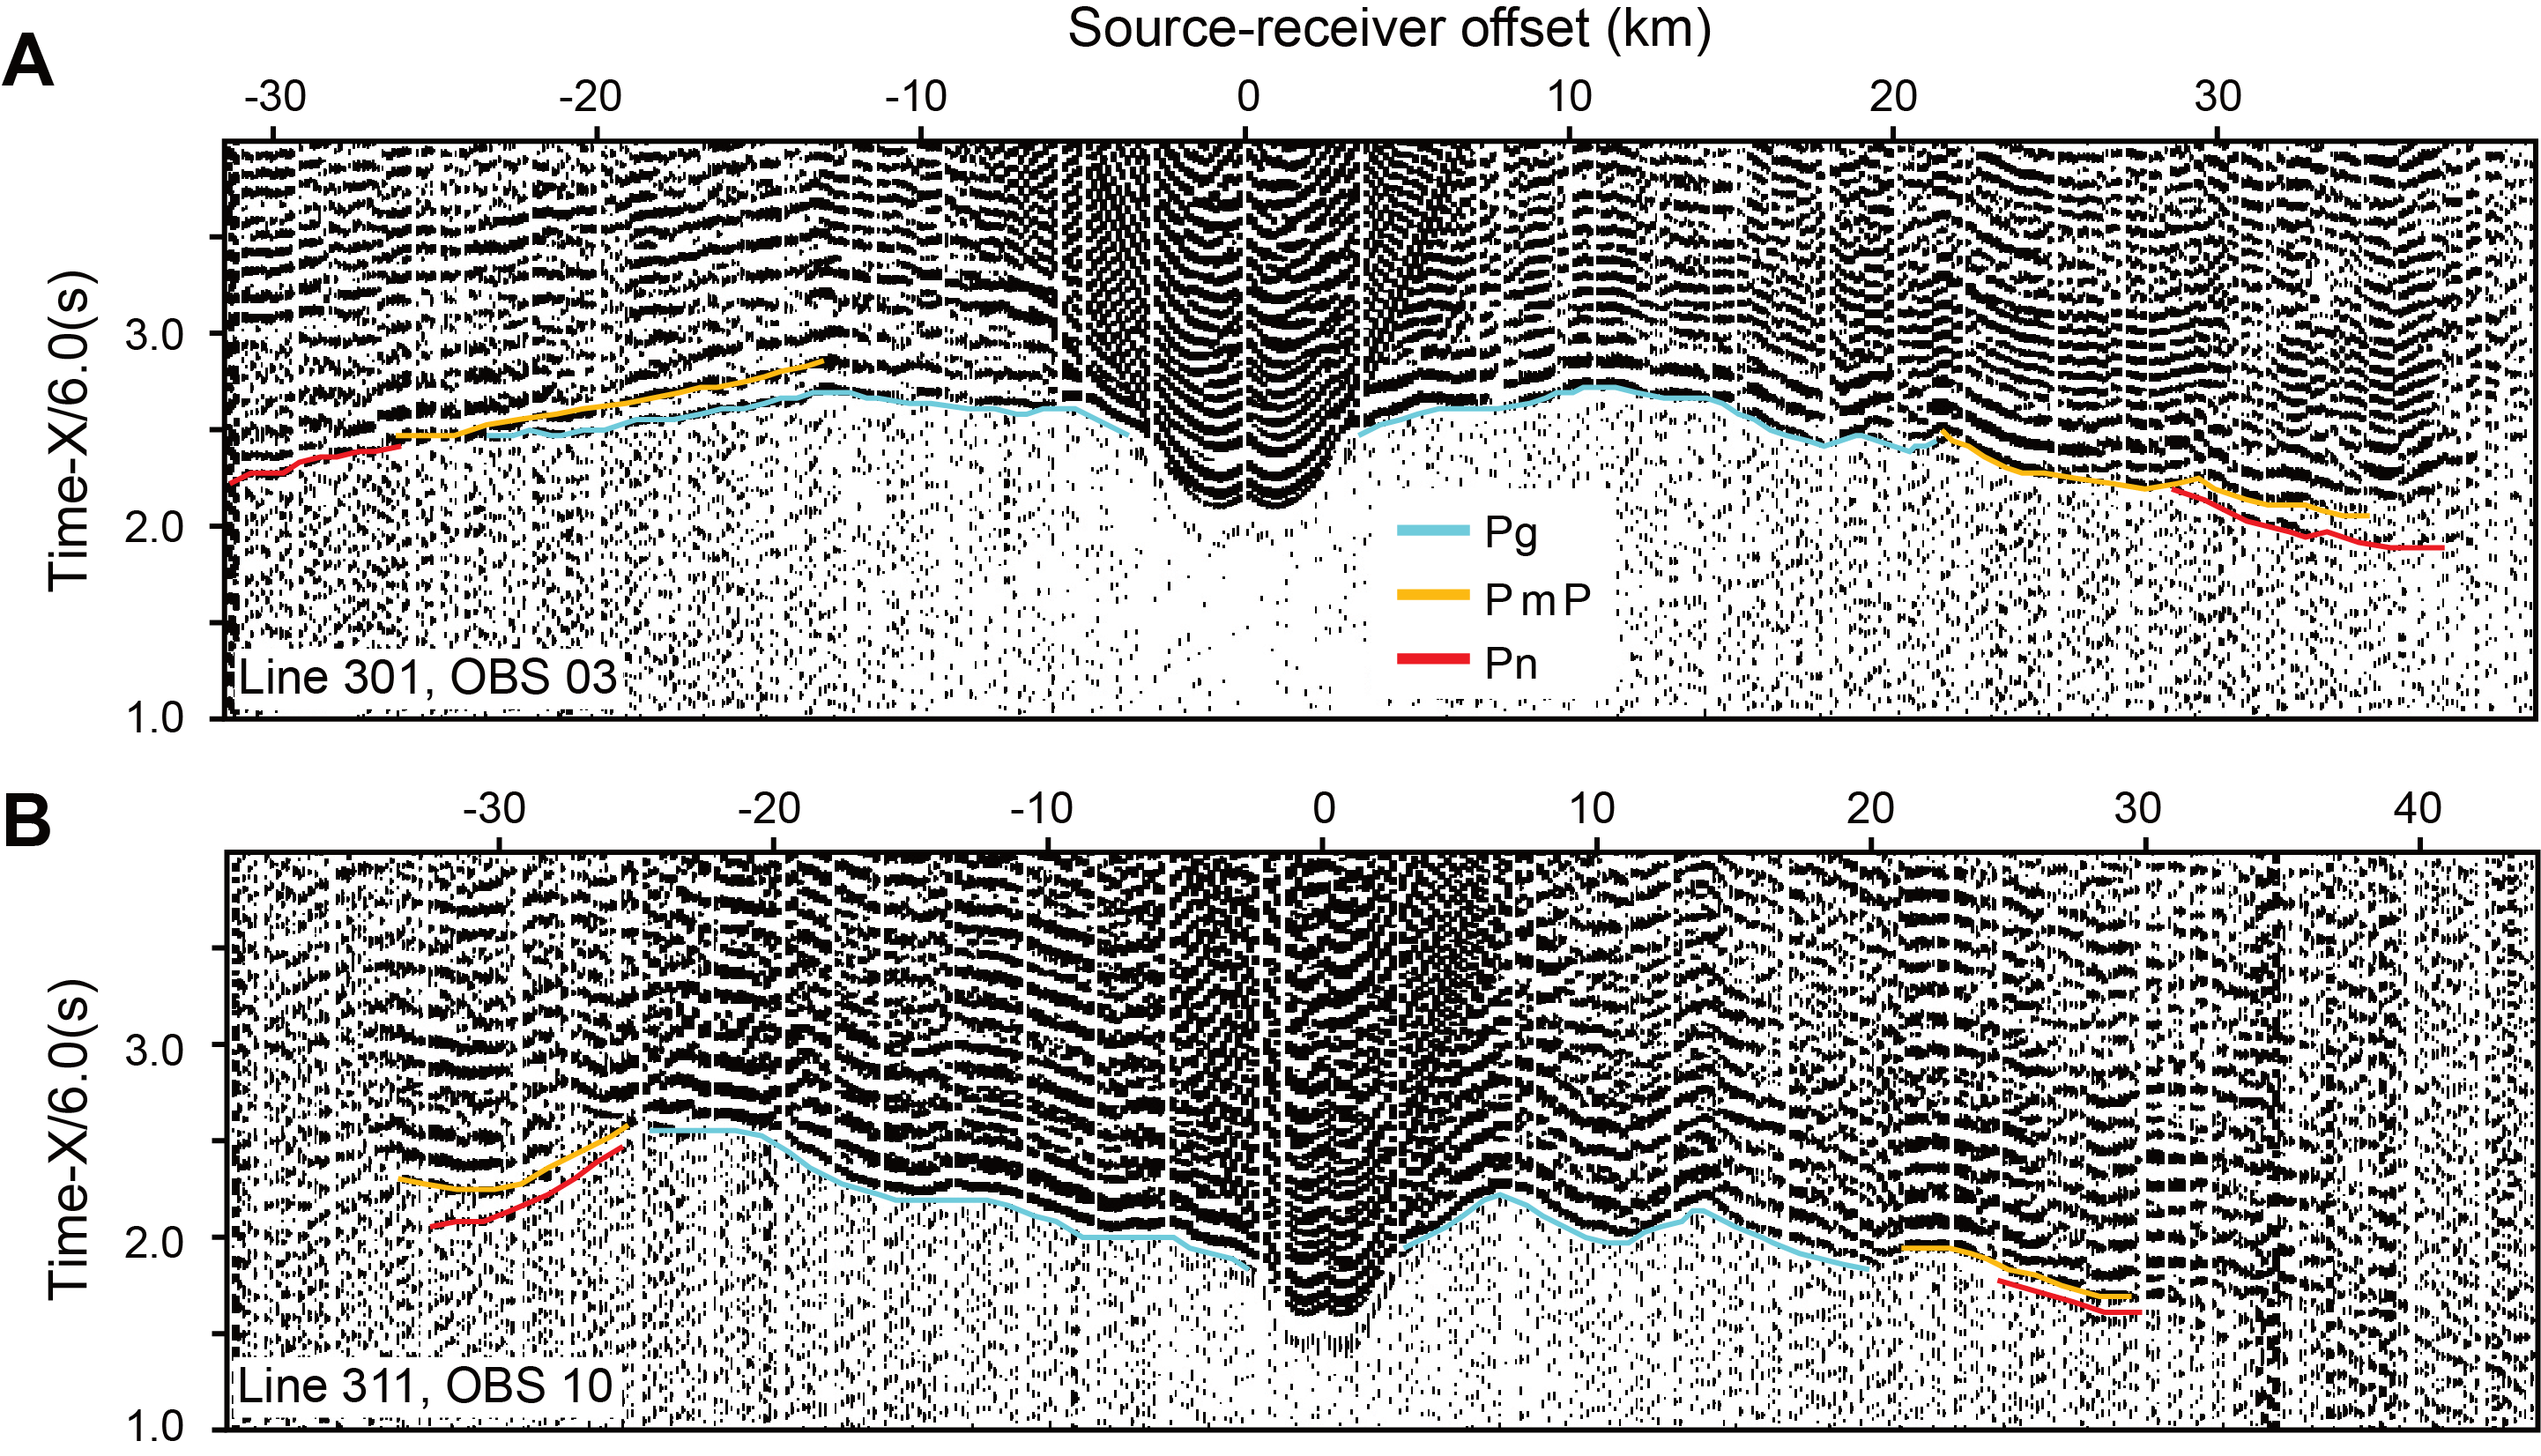
Figure F2. Record sections for vertical channel.
Velocity models were obtained using a procedure similar to that of Christeson et al. (2020). For each profile, I constructed a 3 layer starting velocity model, with layers consisting of water, crust, and mantle with a 50 m grid spacing both horizontally and vertically. Water depths were obtained from multibeam bathymetric data, and the crust/mantle interface in the initial models was set at 5 km below the seafloor. Starting velocities in the crust increased from 2.7 km/s at the top of basement, 5.0 and 6.7 km/s at depths 0.5 and 2.5 km below the seafloor, respectively, and 7.2 km/s at the base of the crust. Mantle velocities were set at 8.0 km/s at the top of mantle and 8.1 km/s at the base of the model at a 15 km depth.
The following procedure was used to pick traveltimes and obtain a velocity model for each profile:
- I calculated raypaths for crustal refractions (Pg), crust-mantle reflections (PmP), and mantle refractions (Pn) through the initial velocity models.
- I picked Pg first arrivals, using the calculated Pg traveltimes for guidance, and carried out a tomographic inversion for the crustal velocity layer using the method of Van Avendonk et al. (2004).
- I created a new initial velocity model with crustal velocities set at the average one-dimensional velocity-depth values from the tomographic inversion and calculated raypaths through this model.
- I picked Pg, PmP, and Pn traveltimes using the calculated traveltimes for guidance. Uncertainties for Pg and Pn first arrivals were set to 20, 30, 40, and 50 ms for source-receiver offsets <20, 20–35, 35–50, and >50 km, respectively. Uncertainties were set to 50 ms for the PmP secondary arrivals. All picks were interpolated to an even spacing of 0.3 km.
- I carried out a tomographic inversion for velocities in the crust and mantle layers and for the depth to the crust/mantle interface. Chi-squared misfit values in the final models are 1.0–1.1, indicating that the model fits the observations within uncertainties.
3. Results
The final velocity models for Lines 301 and 311 show little along-profile variability (Figure F3). Average crustal thickness is 5.0 ± 0.3 km for Line 301 and 5.5 ± 0.4 km for Line 311. Resolution tests on similar data sets (Christeson et al., 2020) suggest that velocities in the upper and middle crust are well resolved for velocity anomalies with horizontal dimensions of 15 km and vertical dimensions of 1.5 km; the Mohorovicic discontinuity (Moho) interface has a depth resolution of 0.1–0.25 km. The gridded velocity models and seismic data are available at https://www.marine-geo.org/tools/search/entry.php?id=EW0305.
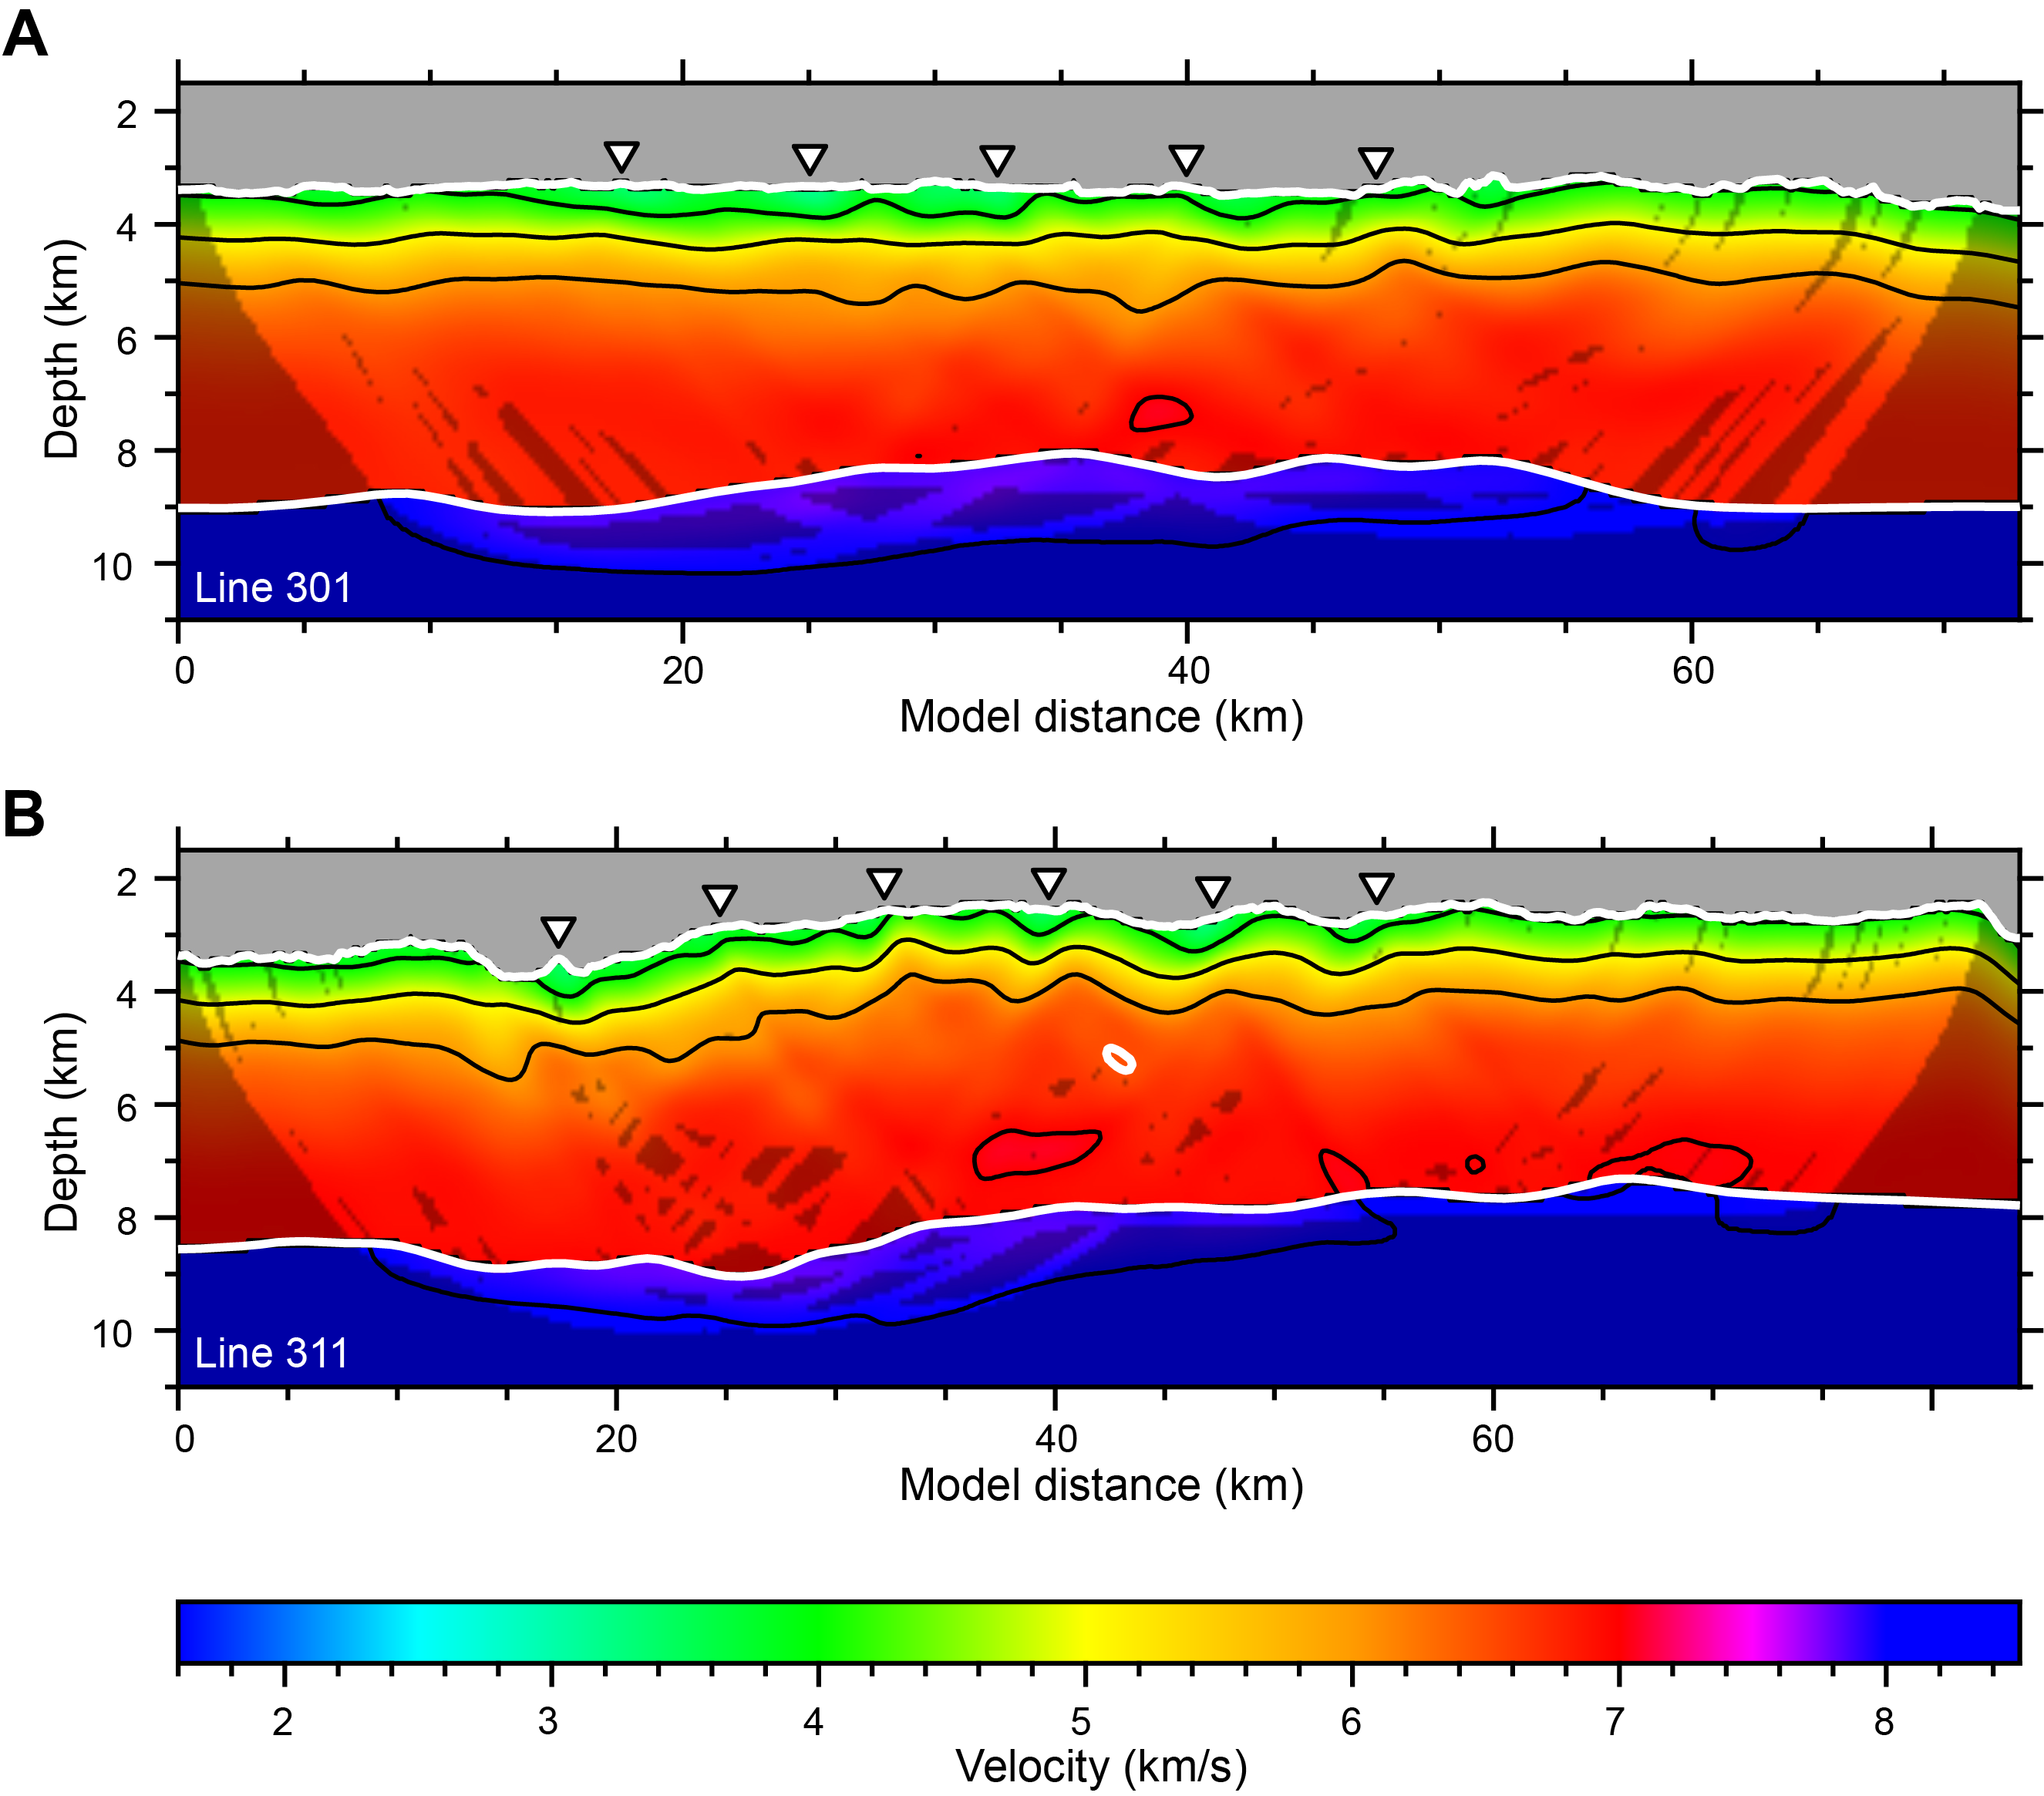
Figure F3. Tomographic inversion velocity models.
Figure F4 displays the average velocity-depth functions for Line 301 (Table T1) and Line 311 (Table T2) compared with the young (<7.5 Ma), fast/superfast (>40 mm/y half-spreading rate) subgroup from the oceanic crustal structure synthesis of Christeson et al. (2019). The average crustal thicknesses of 5.0 and 5.5 km (Lines 301 and 311, respectively) are less than the average thickness of 6.18 km for the young, fast/superfast subgroup. Oceanic crustal velocity models are often divided into two primary layers (e.g., Christeson et al., 2019), with velocities within the upper crust (Layer 2) increasing more rapidly with depth than the lower crust (Layer 3). The change in velocity gradient for the two profiles of this study is located at a ~1.5 km depth, with velocities at the top of Layer 3 averaging ~5.9 and 6.1 km/s (Lines 301 and 311, respectively) (Figure F4). A Layer 2 thickness of 1.5 km is similar to that of the young, fast/superfast subgroup of Christeson et al. (2019); the decrease in overall crustal thickness compared to that of average oceanic crust is accommodated by a thinner Layer 3 than the global average. Velocities at the top of Layer 3 of 5.9–6.1 km/s are slower than the global average of 6.33 km/s for young oceanic crust (Christeson et al., 2019).
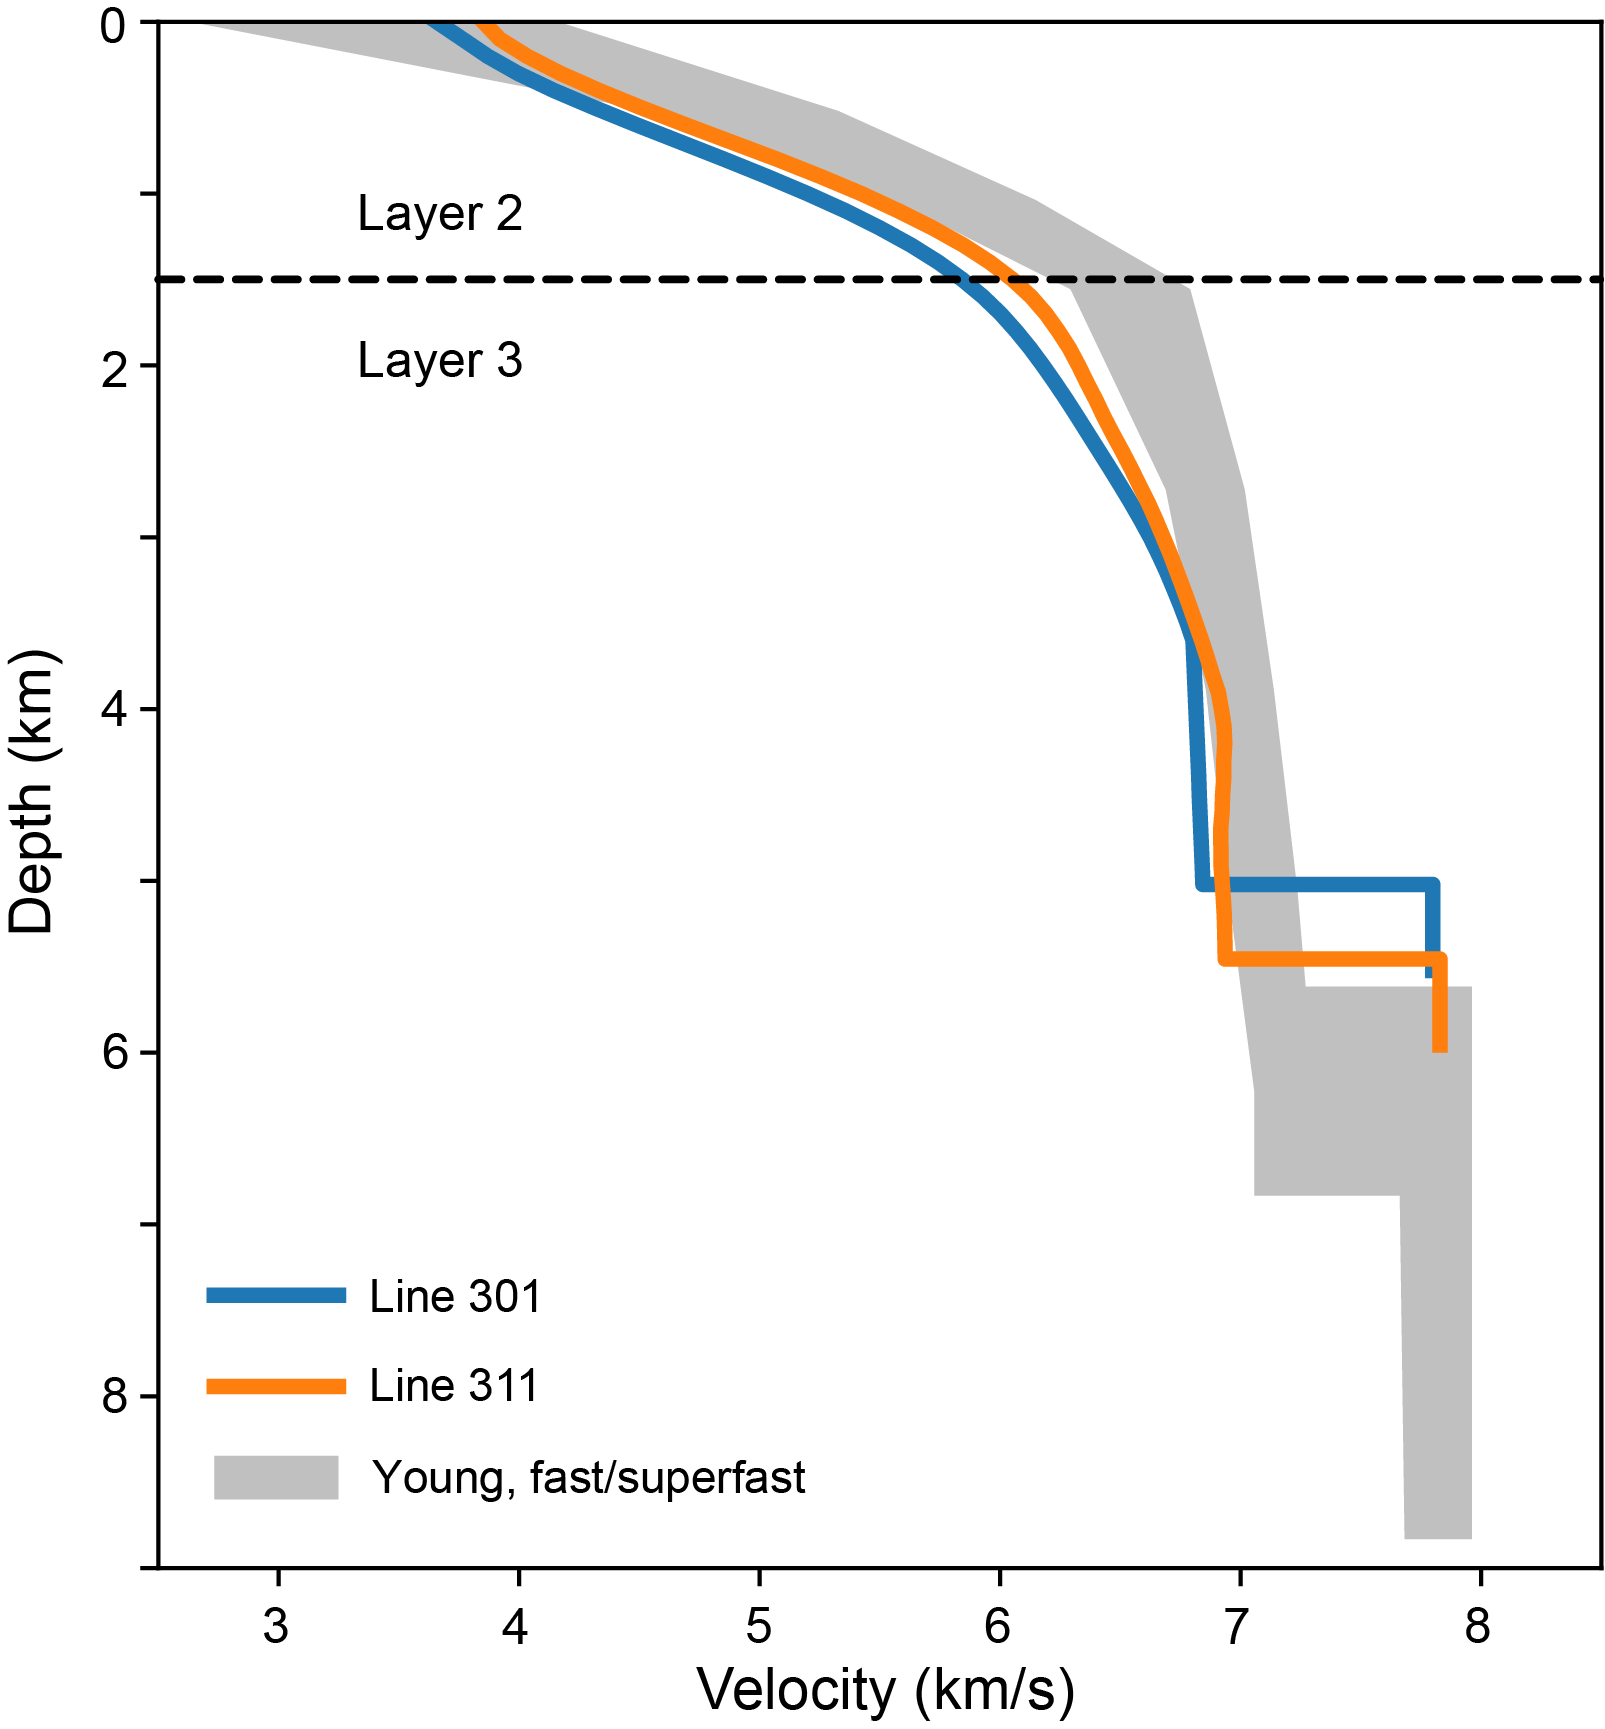
Figure F4. Average velocity-depth functions.
4. Acknowledgments
I am grateful to the captain, crew, and science party of Cruise EW0305 of the R/V Maurice Ewing for their assistance. This work was supported by US National Science Foundation Award 0137286. This material is based upon work supported by (while serving at) the National Science Foundation. Any opinion, findings, and conclusions or recommendations expressed in this material are those of the authors and do not necessarily reflect the views of the National Science Foundation.
References
Christeson, G.L., Goff, J.A., and Reece, R.S., 2019. Synthesis of oceanic crustal structure from two-dimensional seismic profiles. Reviews of Geophysics, 57(2):504–529. https://doi.org/10.1029/2019RG000641
Christeson, G.L., Reece, R.S., Kardell, D.A., Estep, J.D., Fedotova, A., and Goff, J.A., 2020. South Atlantic transect: variations in oceanic crustal structure at 31°S. Geochemistry, Geophysics, Geosystems, 21(7):e2020GC009017. https://doi.org/10.1029/2020GC009017
Expedition 345 Scientists, 2014. Hess Deep plutonic crust: exploring the plutonic crust at a fast-spreading ridge: new drilling at Hess Deep. Integrated Ocean Drilling Program Preliminary Report, 345. https://doi.org/10.2204/iodp.pr.345.2014
Ryan, W.B.F., Carbotte, S.M., Coplan, J.O., O'Hara, S., Melkonian, A., Arko, R., Weissel, R.A., Ferrini, V., Goodwillie, A., Nitsche, F., Bonczkowski, J., and Zemsky, R., 2009. Global multi-resolution topography synthesis. Geochemistry, Geophysics, Geosystems, 10(3):Q03014. https://doi.org/10.1029/2008GC002332
Van Avendonk, H.J.A., Shillington, D.J., Holbrook, W.S., and Hornbach, M.J., 2004. Inferring crustal structure in the Aleutian island arc from a sparse wide-angle seismic data set. Geochemistry, Geophysics, Geosystems, 5(8):Q08008. https://doi.org/10.1029/2003GC000664
Zonenshain, L.P., Kogan, L.I., Savostin, L.A., Golmstock, A.J., and Gorodnitskii, A.M., 1980. Tectonics, crustal structure and evolution of the Galapagos triple junction. Marine Geology, 37(3):209–230. https://doi.org/10.1016/0025-3227(80)90102-4