Wallace, L.M., Saffer, D.M., Barnes, P.M., Pecher, I.A., Petronotis, K.E., LeVay, L.J., and the Expedition 372/375 Scientists
Proceedings of the International Ocean Discovery Program Volume 372B/375
publications.iodp.org
https://doi.org/10.14379/iodp.proc.372B375.213.2025
Data report: thermal diffusivity, thermal conductivity, and volumetric heat capacity at borehole observatory Sites U1518 and U1519, Hikurangi Subduction Zone, IODP Expedition 3751
Patrick M. Fulton2 and Hiroko Kitajima3
1 Fulton, P.M., and Kitajima, H., 2025. Data report: thermal diffusivity, thermal conductivity, and volumetric heat capacity at borehole observatory Sites U1518 and U1519, Hikurangi Subduction Zone, IODP Expedition 375. In Wallace, L.M., Saffer, D.M., Barnes, P.M., Pecher, I.A., Petronotis, K.E., LeVay, L.J., and the Expedition 372/375 Scientists, Hikurangi Subduction Margin Coring, Logging, and Observatories. Proceedings of the International Ocean Discovery Program, 372B/375: College Station, TX (International Ocean Discovery Program). https://doi.org/10.14379/iodp.proc.372B375.213.2025
2 Department of Earth and Atmospheric Sciences, Cornell University, USA. Correspondence author: [email protected]
3 Department of Geology and Geophysics, Texas A&M University, USA.
Abstract
We report laboratory measurements of thermal conductivity and thermal diffusivity and calculated values of volumetric heat capacity for 56 core samples collected during International Ocean Discovery Program Expedition 375 from Sites U1518 and U1519 in the Hikurangi subduction zone. These sites are instrumented with borehole observatories that include downhole temperature sensors, enabling eventual integration of laboratory-derived thermal properties with in situ thermal data. Measurements were conducted under saturated conditions using a transient plane source technique and include repeated tests for quality control. Volumetric heat capacity was calculated as the ratio of thermal conductivity to thermal diffusivity, using measurements obtained simultaneously on the same sample. At Site U1518, thermal diffusivity averages 5.055 ± 0.610 × 10⁻⁷ m2/s (± one standard deviation) and volumetric heat capacity averages 2.588 ± 0.277 MJ/(m3·K). At Site U1519, thermal diffusivity averages 5.395 ± 1.027 × 10⁻⁷ m2/s and volumetric heat capacity averages 2.574 ± 0.350 MJ/(m3·K). Measured thermal conductivity values average 1.294 ± 0.123 W/(m·K) at Site U1518 and 1.354 ± 0.131 W/(m·K) at Site U1519 and are consistent with previous shipboard results. These new constraints on thermal properties provide key input for interpreting borehole temperature records and modeling transient heat transport in subduction zone fault systems.
1. Introduction
Characterization of rock and sediment thermal properties is important in the analysis and interpretation of subsurface temperature data. Borehole temperature data and corresponding geologic thermal property measurements are particularly useful in fault and fracture zones for determining the background geothermal heat flux and characterizing hydrologic and thermal processes such as frictional heating associated with earthquake slip and advection by transient and/or sustained fluid flow (e.g., Kano et al., 2006; Tanaka et al., 2006, 2007; Fulton et al., 2013; Fulton and Brodsky, 2016; Li et al., 2015).
2. Expedition 375 samples
As part of the International Ocean Discovery Program (IODP) Expedition 375, drilling was conducted in the Hikurangi subduction zone offshore New Zealand to investigate the mechanics of subduction zone faulting, slow slip events, and associated fluid flow processes (Saffer et al. , 2019a). This expedition targeted the frontal thrust of the Hikurangi margin and the hanging wall of the subduction megathrust, where slow slip events occur. Boreholes were drilled at multiple sites to recover core samples and install borehole observatories within the overlying prism to monitor temperature, pressure, and fluid flow within the fault zone.
In this study, we report thermal property measurements on 56 core samples recovered during Expedition 375 from Sites U1518 and U1519 on the northern Hikurangi margin. Both sites are instrumented with borehole observatories that include downhole temperature sensor strings, allowing laboratory-based thermal property measurements to be interpreted alongside in situ temperature observations. The temperature sensors installed in the observatory at Site U1518 span 52.66–370.15 meters below seafloor (mbsf) (Saffer et al., 2019a), and at Site U1519 they span 48.05–262.28 mbsf (Barnes et al., 2019). The holes at each site are located relatively close together, with typical distances between holes ranging 20–80 m, allowing for integration of core, log, and observatory data across a spatially coherent area. This combination enables more detailed assessments of heat transport, including potential influences from fluid flow or other transient processes within the fault zone.
Site U1518 is located within the frontal thrust zone of the accretionary wedge and was targeted to investigate fault zone structure and physical properties. Core samples were selected from Holes U1518E and U1518F, and the observatory was installed in Hole U1518H (Saffer et al., 2019a; Saffer et al., 2019b). Samples span depths from the seafloor to approximately 488.85 mbsf. Lithologies at Site U1518 consist of silty clay(stone) alternating with thin beds of silt(stone) that contain variable amounts of sand in the upper sections (Unit I; 0–304.53 mbsf), transitioning to mudstone and siltstone (Unit II; 304.53–370.4 mbsf), and further into mudstone, siltstone to sandy siltstone, and contorted mudstone clasts (Unit III; 370.4–492.26 mbsf) (Saffer et al., 2019a; Saffer et al., 2019b).
Site U1519 is located farther landward within the accretionary prism and was designed to characterize the material and fluid conditions above the megathrust. Core samples used in this analysis were retrieved from Holes U1519C–U1519E, and the observatory string was installed in Hole U1519B (Barnes et al., 2019). Samples span depths from the seafloor to approximately 626.71 mbsf. The lithostratigraphy includes mud(stone), silt(stone), and sand(stone), with Unit I (0–282.66 mbsf) composed predominantly of mud(stone) and sparse silt(stone) and Unit II (282.66–635.65 mbsf) comprising mudstone with interbeds of silt(stone), very fine to coarse sand(stone), contorted mudstone, and matrix-supported mass transport deposits (Barnes et al., 2019).
3. Thermal properties
The thermal properties of particular importance in this study are thermal conductivity and thermal diffusivity, along with the volumetric heat capacity that relates the two.
Thermal conductivity λ describes the ability of a material to conduct heat. Vertical conductive heat flow, q [W/m2], is defined by Fourier’s Law as the product of thermal conductivity λ [W/(m·K)] and the vertical temperature gradient dT/dz (K/m):
(1)
where the minus sign indicates that heat is flowing in the opposite direction to the thermal gradient.
For a given heat flux through the earth, depth variations in thermal conductivity tend to result in corresponding variations in temperature gradient. Similarly, though not apparent by Equation 1, large thermal conductivity contrasts along interfaces that are not orthogonal to the geothermal heat flux can result in heat refraction and local variations in vertical heat flow (Bullard et al., 1956; Lee and Henyey, 1974; Mildren and Sandiford, 1995; Fulton and Saffer, 2009).
An understanding of depth variations in thermal conductivity, therefore, is important in modeling the thermal subsurface conditions and distinguishing whether observed temperature anomalies represent additional sources of heat from heat generation or fluid advection, or alternatively, reflect the steady-state effects of heat conduction (e.g., Tanaka et al., 2007; Fulton et al., 2010; Lin et al., 2014).
Further discrimination of features within borehole temperature data is possible through observation and/or modeling of the temporal changes in temperature. Heat transport, including that which is not steady-state, is controlled by the advection-diffusion equation:
(2)
where the first group of terms on the right represents fluid advection due to fluid flow with velocity u (m/s), and the second grouping of terms reflects heat diffusion (i.e., conduction) controlled by thermal diffusivity, α (m2/s).
Thermal diffusivity α is related to thermal conductivity λ by density ρ (kg/m3) and specific heat c (J/[kg·K]) by
(3)
Together, the product of ρ and c defines the volumetric heat capacity.
Thermal diffusivity controls how heat diffuses into the surroundings in response to a thermal perturbation. Particular solutions to Equation 2 depend upon the boundary conditions, source or perturbation characteristics, and whether or not there is advection. However, in general, the time-frame and spatial extent over which diffusion operates can often be represented by a characteristic length scale, L:
(4)
based on a given an amount of time t since the perturbation, or alternatively, by a characteristic time scale, θ, describing the time it takes for a perturbation signal to considerably affect a location l (m) distance away:
(5)
Both of these terms depend on the bulk thermal diffusivity α.
Understanding the thermal diffusivity of the subsurface, along with its spatial variability, is essential for interpreting whether observed temperature changes over time reflect purely conductive diffusion or indicate additional processes. This can be particularly important in assessing potential frictional heat signals following earthquakes (Brodsky et al., 2010; Fulton et al., 2013; Li et al., 2015), as well as potentially enabling estimates to be determined of formation permeability affected by borehole fluid infiltration (Fulton et al., 2013; Purwamaska and Fulton, 2022, submitted) or active fluid flow rates through particular subsurface zones (Read et al., 2013; Maldaner et al., 2019).
Thermal conductivity measurements are generally undersampled, potentially because they can be time consuming, requiring steady-state thermal conditions and large samples. Measurements of thermal diffusivity in geologic materials are even more rare, and models often rely on assumed or literature-based values that are not well constrained by site-specific data. The scarcity of thermal diffusivity measurements likely stems from the complexity of the method, which requires specialized instrumentation to perform and interpret transient heating experiments. Additionally, the practical application of diffusivity data alongside time-series temperature observations remains relatively novel.
4. Methods
Here we report a full suite of thermal conductivity, diffusivity, and volumetric heat capacity values for Expedition 375 samples based on measurements conducted under water-saturated (wet) conditions using a HotDisk TPS 2500 thermal properties instrument at the Texas A&M University Materials Characterization Laboratory (USA). The instrument utilizes the transient plane source technique (recognized in ISO 22007-2 [International Organization for Standardization, 2008]), in which a foil coil acting as both a sensor and heat source is placed between two subsamples. A known quantity of heat energy is supplied for a period of time, and the temperature response and recovery at the same source location is monitored and recorded (Gustafson, 1991). These experiments utilized a Kapton-insulated sensor (Model 5465) with a 6.4 mm diameter heating element.
4.1. Sample set-up
For these experiments, the two-sided or sandwich configuration was employed, in which heat is applied symmetrically into both subsamples from the sensor placed in between (Figure F1). This setup ensures that heat radiates entirely into the sample material rather than being partially lost to an insulating material, as would occur in a single-sided approach.
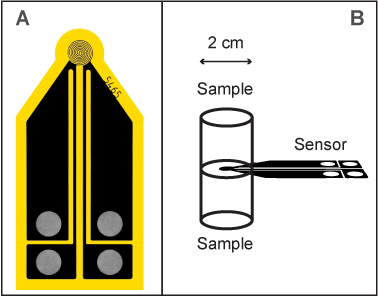
Figure F1. Hot Disk sensor and experimental setup.
For each sample, two cylindrical subsamples measuring approximately 2 cm in diameter and at least 1 cm in height were prepared. These intact subsamples were cut using a plastic cylinder from 2 cm long 10 cm3 wedge samples taken directly from the working half of the core. The use of intact material, rather than chips or reconstituted fragments, helped ensure uniform thermal contact and preserved the original structure of the sample. The paired subsamples were aligned on either side of the planar sensor, ensuring that the smoothest, most intact surfaces were in contact with the sensor.
Samples were wrapped in plastic film to preserve integrity and reduce moisture loss during handling and setup. Compression was applied uniformly across the sample stack to maintain contact between the sensor and sample surfaces. All measurements were conducted within an enclosed chamber to minimize the influence of ambient temperature fluctuations.
4.2. Transient plane source technique theory
As described in further detail by Gustafsson (1991), the temperature response to a transient plane heat source over time enables simultaneous inversion for both thermal conductivity and thermal diffusivity.
In short, the observed temperature rise recorded by the Hot Disk sensor ΔT follows the theoretical form of
(6)
where P₀ is the controlled output power into the heating coil, r is the heating coil radius, and λ is the sample thermal conductivity. H(τ) is a dimensionless time-dependent function related to the error function (Gustafson, 1991), with
(7)
where t is the time since the start of heating and θ is the characteristic time defined by Equation 5 with l = r:
(8)Optimal values of thermal diffusivity result in the temperature data fitting a straight line when plotted against H(τ), which allows for inversion for thermal diffusivity α. The resulting slope of the straight line follows Equation 6 and allows for determination of the thermal conductivity λ. Different aspects of the same observations therefore allow for the determination of both λ and α from the same experiment. Volumetric heat capacity is then determined by Equation 3.
4.3. Example data and model fit
Figure F2 illustrates representative results from a set of three repeated experiments on Sample 375-U1518F-13R-1, 61–63 cm. Panel A shows the observed temperature rise over time for each replicate measurement. Panel B presents the same data plotted against the dimensionless function H(τ), demonstrating the linear relationship that enables inversion for thermal conductivity and diffusivity. Panel C displays the residuals between the observed and modeled temperature rise as a function of the square root of time, confirming the quality of the model fit and the consistency of the measurements.
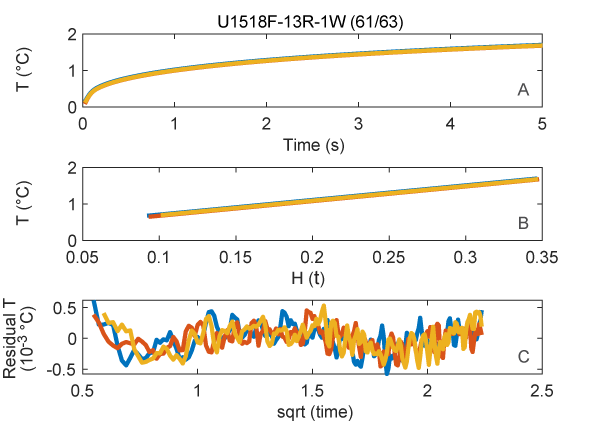
Figure F2. Thermal property measurements and model fitting results.
4.4. Experimental conditions
Each experiment was preceded by a stabilization period of at least 15 min to allow the water-saturated Hikurangi subduction zone samples to equilibrate thermally with laboratory conditions. Following stabilization, a series of 100 baseline temperature measurements were collected at evenly spaced time intervals over 40 s to assess any background temperature drift. Measurements showing significant drift were excluded from further analysis.
Thermal experiments were then conducted using a heating duration of 5 s at a constant input power of 100 mW. These conditions were selected to ensure a moderate and measurable temperature rise of approximately 2°C while minimizing the potential for nonlinear thermal responses or departures from purely conductive behavior. With the characteristic probe depth for these settings extending several millimeters into the sample, this approach ensured sufficient sampling of the bulk properties of each subsample pair.
Each paired sample (with the sensor sandwiched in between) was measured three times to evaluate precision and reproducibility. Between each measurement, a thermal reequilibration period of 5 min was implemented. This reequilibration interval exceeds the theoretical minimum recommendation of 36 times the heating duration (i.e., 3 min), providing additional confidence in the repeatability of the results.
Determinations of thermal conductivity and diffusivity were based on model fits to subsets of the temperature rise data, typically excluding the earliest time steps to minimize the influence of near-sensor complexities and initial heat transfer effects. High-quality results were identified based on mean residuals between observed and modeled temperatures of less than 10−3°C.
5. Results
5.1. Site U1518
Thermal property measurements for core samples from Site U1518 are presented in Table T1 and Figure F3. Thermal conductivity values (Figure F3A) range 1.100–1.632 W/(m·K) and average 1.294 ± 0.123 W/(m·K). These values are generally consistent with shipboard-determined thermal conductivity measurements (Saffer et al., 2019a), which are shown in Figure F3A as open circles. Error bars representing the standard deviation of repeated measurements are generally smaller than the marker size for all properties and thus are not plotted. The reported ± values represent one standard deviation.
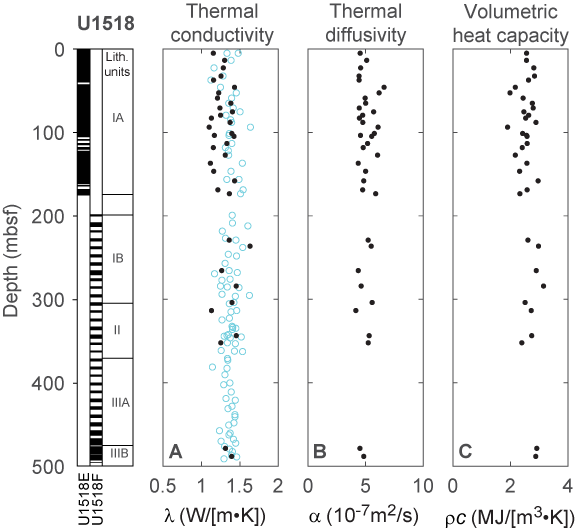
Figure F3. Thermal property measurements, Site U1518.
Thermal diffusivity values (Figure F3B) range 4.154 × 10⁻⁷ m2/s to 6.602 × 10⁻⁷ m2/s, with a mean of 5.055 ± 0.610 × 10⁻⁷ m2/s. The diffusivity values are relatively uniform across the sampled depth range at this site.
Volumetric heat capacity values (Figure F3C) range 1.899–3.148 MJ/(m3·K) and average 2.588 ± 0.277 MJ/(m3·K).
5.2. Site U1519
Thermal property measurements for core samples from Site U1519 are presented in Table T2 and Figure F4. Thermal conductivity values (Figure F4A) range 0.985–1.527 W/(m·K) and average 1.354 ± 0.131 W/(m·K). As with Site U1518, shipboard-determined thermal conductivity measurements (Barnes et al., 2019) are shown as open circles for comparison and are broadly consistent with our results. Error bars indicating standard deviations from repeated measurements are smaller than the marker size and are not plotted. The reported ± values represent one standard deviation.
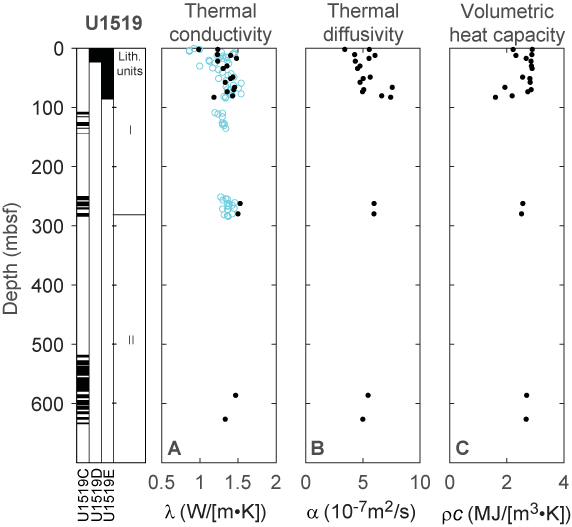
Figure F4. Thermal property measurements, Site U1519.
Thermal diffusivity values (Figure F4B) range 3.413 × 10⁻⁷ m2/s to 7.563 × 10⁻⁷ m2/s, with a mean of 5.395 ± 1.027 × 10⁻⁷ m2/s. Volumetric heat capacity values (Figure F4C) range 1.602–2.887 MJ/(m3·K) and average 2.574 ± 0.350 MJ/(m3·K). Overall, thermal properties show limited variation with depth throughout the sampled interval at this site.
Despite site-to-site variability in lithology and depth, the average values and standard deviations of thermal conductivity, thermal diffusivity, and volumetric heat capacity broadly overlap between Sites U1518 and U1519, indicating similar thermal properties across the sampled intervals at both locations.
6. Acknowledgments
We thank Jeron Beard, Constantine Stoilis, Ivan Purwamaska, and Josh Edgington for their assistance in preparing and measuring samples. We are also grateful to reviewers Glenn Spinelli and Rob Harris for their constructive feedback, which improved the quality of this manuscript. This work was supported by the U.S. Science Support Program (USSSP) and the National Science Foundation under grant numbers 1458947, 1649977, 1929120, and 213609.
References
Barnes, P.M., Wallace, L.M., Saffer, D.M., Pecher, I.A., Petronotis, K.E., LeVay, L.J., Bell, R.E., Crundwell, M.P., Engelmann de Oliveira, C.H., Fagereng, A., Fulton, P.M., Greve, A., Harris, R.N., Hashimoto, Y., Hüpers, A., Ikari, M.J., Ito, Y., Kitajima, H., Kutterolf, S., Lee, H., Li, X., Luo, M., Malie, P.R., Meneghini, F., Morgan, J.K., Noda, A., Rabinowitz, H.S., Savage, H.M., Shepherd, C.L., Shreedharan, S., Solomon, E.A., Underwood, M.B., Wang, M., Woodhouse, A.D., Bourlange, S.M., Brunet, M.M.Y., Cardona, S., Clennell, M.B., Cook, A.E., Dugan, B., Elger, J., Gamboa, D., Georgiopoulou, A., Han, S., Heeschen, K.U., Hu, G., Kim, G.Y., Koge, H., Machado, K.S., McNamara, D.D., Moore, G.F., Mountjoy, J.J., Nole, M.A., Owari, S., Paganoni, M., Rose, P.S., Screaton, E.J., Shankar, U., Torres, M.E., Wang, X., and Wu, H.-Y., 2019. Site U1519. In Wallace, L.M., Saffer, D.M., Barnes, P.M., Pecher, I.A., Petronotis, K.E., LeVay, L.J., and the Expedition 372/375 Scientists, Hikurangi Subduction Margin Coring, Logging, and Observatories. Proceedings of the International Ocean Discovery Program, 372B/375: College Station, TX (International Ocean Discovery Program). https://doi.org/10.14379/iodp.proc.372B375.104.2019
Brodsky, E.E., Mori, J., and Fulton, P.M., 2010. Drilling into faults quickly after earthquakes. Eos, Transactions American Geophysical Union, 91(27):237–238. https://doi.org/10.1029/2010EO270001
Bullard, E.C., Maxwell, A.E. and Revelle, R., 1956. Heat flow through the deep sea floor. In Advances in geophysics (Vol. 3, pp. 153-181). Elsevier.
Fulton, P.M., and Brodsky, E.E., 2016. In situ observations of earthquake-driven fluid pulses within the Japan Trench plate boundary fault zone. Geology, 44(10):851–854. https://doi.org/10.1130/G38034.1
Fulton, P.M., Brodsky, E.E., Kano, Y., Mori, J.J., Chester, F.M., Ishikawa, T., Harris, R.N., Lin, W., Eguchi, N., and Toczko, S., 2013. Low coseismic friction on the Tōhoku-Oki fault determined from temperature measurements. Science, 342(6163):1214–1217. https://doi.org/10.1126/science.1243641
Fulton, P.M., Harris, R.N., Saffer, D.M., and Brodsky, E.E., 2010. Does hydrologic circulation mask frictional heat on faults after large earthquakes? Journal of Geophysical Research: Solid Earth, 115:B09402. https://doi.org/10.1029/2009JB007103
Fulton, P.M., and Saffer, D.M., 2009. Effect of thermal refraction on heat flow near the San Andreas Fault, Parkfield, California. Journal of Geophysical Research: Solid Earth, 114:B06408. https://doi.org/10.1029/2008JB005796
Gustafsson, S.E., 1991. Transient plane source techniques for thermal conductivity and thermal diffusivity measurements of solid materials. Review of Scientific Instruments, 62(3):797–804. https://doi.org/10.1063/1.1142087
International Organization for Standardization, 2008. Plastics - Determination of thermal conductivity and thermal diffusivity - Part 2: Transient plane heat source (hot disc) method (ISO Standard No. 22007-2).
Kano, Y., Mori, J., Fujio, R., Ito, H., Yanagidani, T., Nakao, S., and Ma, K.-F., 2006. Heat signature on the Chelungpu fault associated with the 1999 Chi-Chi, Taiwan earthquake. Geophysical Research Letters, 33(14):L14306. https://doi.org/10.1029/2006GL026733
Lee, T.-C., and Henyey, T.L., 1974. Heat-flow refraction across dissimilar media. Geophysical Journal International, 39(2):319–333. https://doi.org/10.1111/j.1365-246X.1974.tb05457.x
Li, H., Xue, L., Brodsky, E.E., Mori, J.J., Fulton, P.M., Wang, H., Kano, Y., Yun, K., Harris, R.N., Gong, Z., Li, C., Si, J., Sun, Z., Pei, J., Zheng, Y., and Xu, Z., 2015. Long-term temperature records following the Mw 7.9 Wenchuan (China) earthquake are consistent with low friction. Geology, 43(2):163–166. https://doi.org/10.1130/G35515.1
Lin, W., Fulton, P.M., Harris, R.N., Tadai, O., Matsubayashi, O., Tanikawa, W., and Kinoshita, M., 2014. Thermal conductivities, thermal diffusivities, and volumetric heat capacities of core samples obtained from the Japan Trench Fast Drilling Project (JFAST). Earth, Planets and Space, 66(1):48. https://doi.org/10.1186/1880-5981-66-48
Maldaner, C.H., Munn, J.D., Coleman, T.I., Molson, J.W., and Parker, B.L., 2019. Groundwater flow quantification in fractured rock boreholes using active distributed temperature sensing under natural gradient conditions. Water Resources Research, 55(4):3285–3306. https://doi.org/10.1029/2018WR024319
Mildren, S.D., and Sandiford, M., 1995. Heat refraction and low‐pressure metamorphism in the northern Flinders Ranges, South Australia. Australian Journal of Earth Sciences, 42(3):241–247. https://doi.org/10.1080/08120099508728198
Purwamaska, I., and P.M. Fulton, 2022. Hydrologic thermal response tests: How borehole thermal response can constrain permeability as a function of depth. Presented at the AGU Fall Meeting 2022, Chicago, IL, 12-16 December 2022.
Purwamaska, I., and Fulton, P.M., submitted. Borehole Thermal Recovery as a Method for Quantifying Subsurface Permeability. Geochemistry, Geophysics, Geosystems.
Read, T., Bour, O., Bense, V., Le Borgne, T., Goderniaux, P., Klepikova, M.V., Hochreutener, R., Lavenant, N., and Boschero, V., 2013. Characterizing groundwater flow and heat transport in fractured rock using fiber-optic distributed temperature sensing. Geophysical Research Letters, 40(10):2055–2059. https://doi.org/10.1002/grl.50397
Saffer, D.M., Wallace, L.M., Barnes, P.M., Pecher, I.A., Petronotis, K.E., LeVay, L.J., Bell, R.E., Crundwell, M.P., Engelmann de Oliveira, C.H., Fagereng, A., Fulton, P.M., Greve, A., Harris, R.N., Hashimoto, Y., Hüpers, A., Ikari, M.J., Ito, Y., Kitajima, H., Kutterolf, S., Lee, H., Li, X., Luo, M., Malie, P.R., Meneghini, F., Morgan, J.K., Noda, A., Rabinowitz, H.S., Savage, H.M., Shepherd, C.L., Shreedharan, S., Solomon, E.A., Underwood, M.B., Wang, M., Woodhouse, A.D., Bourlange, S.M., Brunet, M.M.Y., Cardona, S., Clennell, M.B., Cook, A.E., Dugan, B., Elger, J., Gamboa, D., Georgiopoulou, A., Han, S., Heeschen, K.U., Hu, G., Kim, G.Y., Koge, H., Machado, K.S., McNamara, D.D., Moore, G.F., Mountjoy, J.J., Nole, M.A., Owari, S., Paganoni, M., Rose, P.S., Screaton, E.J., Shankar, U., Torres, M.E., Wang, X., and Wu, H.-Y., 2019a. Expedition 372B/375 summary. In Wallace, L.M., Saffer, D.M., Barnes, P.M., Pecher, I.A., Petronotis, K.E., LeVay, L.J., and the Expedition 372/375 Scientists, Hikurangi Subduction Margin Coring, Logging, and Observatories. Proceedings of the International Ocean Discovery Program, 372B/375: College Station, TX (Proceedings of the International Ocean Discovery Program). https://doi.org/10.14379/iodp.proc.372B375.101.2019
Saffer, D.M., Wallace, L.M., Barnes, P.M., Pecher, I.A., Petronotis, K.E., LeVay, L.J., Bell, R.E., Crundwell, M.P., Engelmann de Oliveira, C.H., Fagereng, A., Fulton, P.M., Greve, A., Harris, R.N., Hashimoto, Y., Hüpers, A., Ikari, M.J., Ito, Y., Kitajima, H., Kutterolf, S., Lee, H., Li, X., Luo, M., Malie, P.R., Meneghini, F., Morgan, J.K., Noda, A., Rabinowitz, H.S., Savage, H.M., Shepherd, C.L., Shreedharan, S., Solomon, E.A., Underwood, M.B., Wang, M., Woodhouse, A.D., Bourlange, S.M., Brunet, M.M.Y., Cardona, S., Clennell, M.B., Cook, A.E., Dugan, B., Elger, J., Gamboa, D., Georgiopoulou, A., Han, S., Heeschen, K.U., Hu, G., Kim, G.Y., Koge, H., Machado, K.S., McNamara, D.D., Moore, G.F., Mountjoy, J.J., Nole, M.A., Owari, S., Paganoni, M., Rose, P.S., Screaton, E.J., Shankar, U., Torres, M.E., Wang, X., and Wu, H.-Y., 2019b. Site U1518. In Wallace, L.M., Saffer, D.M., Barnes, P.M., Pecher, I.A., Petronotis, K.E., LeVay, L.J., and the Expedition 372/375 Scientists, Hikurangi Subduction Margin Coring, Logging, and Observatories. Proceedings of the International Ocean Discovery Program, 372B/375: College Station, TX (International Ocean Discovery Program). https://doi.org/10.14379/iodp.proc.372B375.103.2019
Tanaka, H., Chen, W.M., Kawabata, K., and Urata, N., 2007. Thermal properties across the Chelungpu fault zone and evaluations of positive thermal anomaly on the slip zones: Are these residuals of heat from faulting? Geophysical Research Letters, 34(1):L01309. https://doi.org/10.1029/2006GL028153
Tanaka, H., Chen, W.M., Wang, C.Y., Ma, K.F., Urata, N., Mori, J., and Ando, M., 2006. Frictional heat from faulting of the 1999 Chi-Chi, Taiwan earthquake. Geophysical Research Letters, 33(16):L16316. https://doi.org/10.1029/2006GL026673