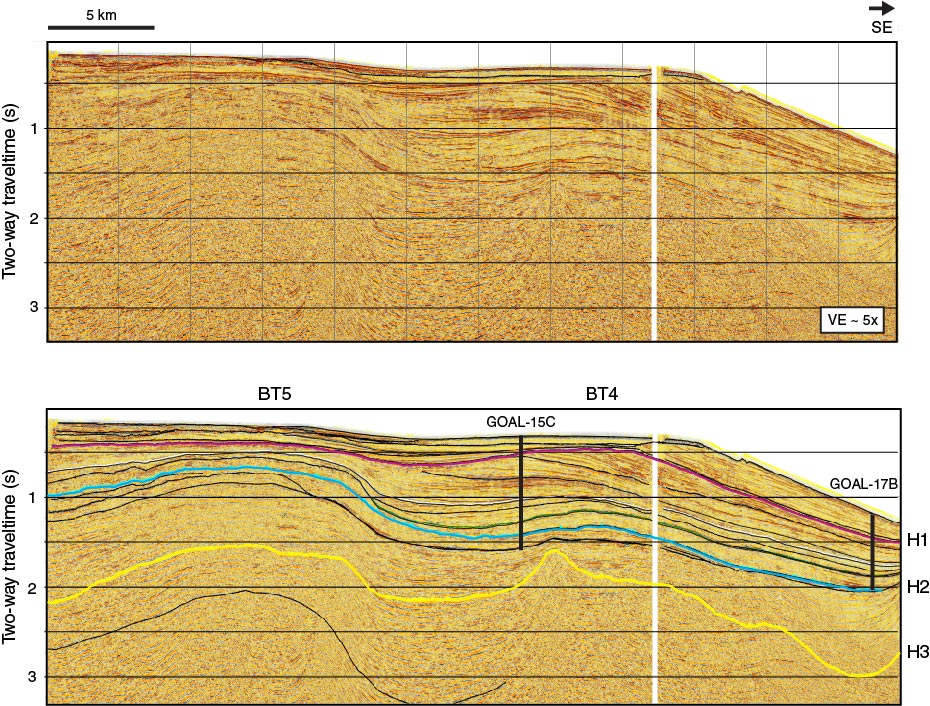
Figure F9. GOA-2505 seismic section, uninterpreted (top) and interpreted (bottom). Interpreted section shows structures BT4 and BT5, and key horizons (H1, H2, and H3). Colored horizons are regional horizons interpreted throughout the study area. Black horizons are interpreted locally to define glacial depositional sequences in the upper 2 s of the record. VE = vertical exaggeration. From Worthington et al. (2010).
Previous | Close | Next | Top of page