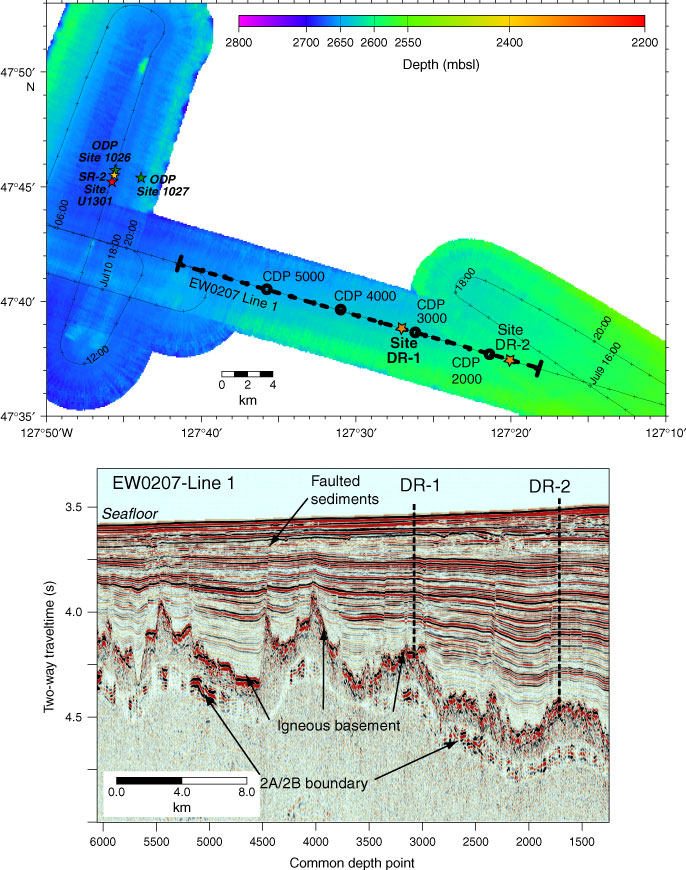
Figure F11. Track chart for Deep Ridge and section of EW0207 Line 1. Bathymetric data are plotted using the same depth scale and color palette as used in Figure F3. In contrast to all other seismic displays presented in this paper, automatic gain control was applied to Deep Ridge data in order to better image deep reflections and basement Layer 2A/2B boundary. CDP = common depth point.
Previous | Close | Next | Top of page