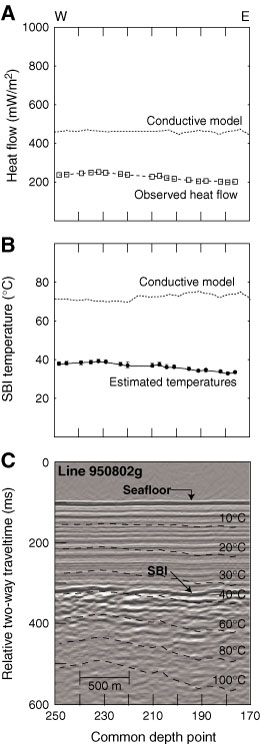
Figure F13. Seismic data, heat flow, and calculated sediment/basement interface (SBI) temperatures along Line 950802g (line location shown in Fig. F4). This location is characteristic of an area having heat flow and basement temperatures that are considerably lower than predicted by conductive cooling models for oceanic lithosphere and where there is little significant basement relief. A. Measured seafloor heat flow (open squares), with uncertainties in measured values being smaller than the symbols. Dotted line is output of two dimensional conductive model, using lithospheric cooling curve as lower thermal boundary condition. B. Calculated SBI temperatures (circles) based on heat flow and seismic data and output of two-dimensional conductive model (dotted line). Uncertainties in upper basement temperatures are indicated by vertical bars, based on the accumulation of errors through downward-continuation calculations, as described in the text. C. Seismic data overlain by isotherms calculated from measured seafloor heat flow. Vertical exaggeration = ~3.
Previous | Close | Next | Top of page