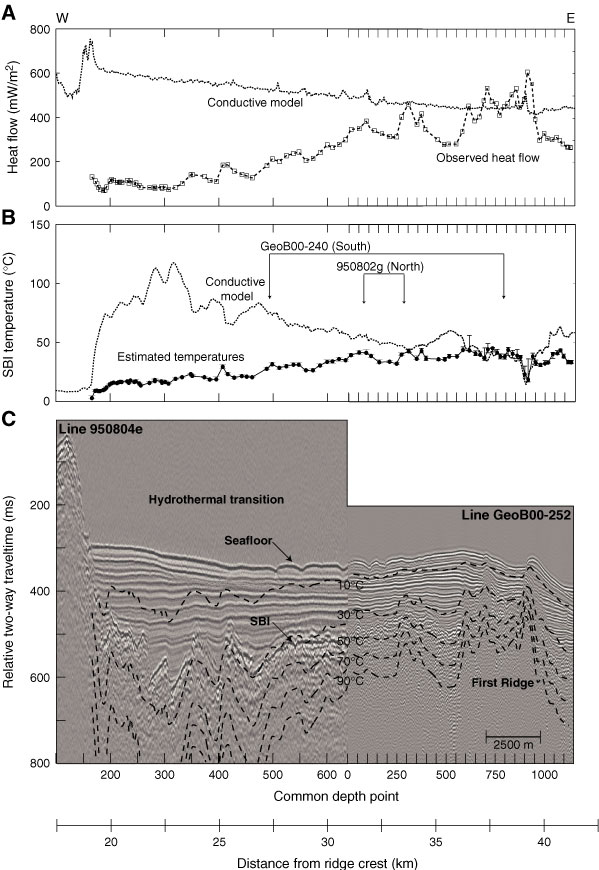
Figure F14. Seismic data, heat flow, and calculated sediment/basement interface (SBI) temperatures along Lines 950804e and GeoB00-252 (line locations shown in Fig. F4). These data cross the hydrothermal transition area and First Ridge, showing a progression in heat flow and basement temperatures. Locations of Lines 950802g (to the north; Fig. F13) and GeoB00-240 (to the south; Fig. F15) are shown, as is the perpendicular distance to the active ridge axis to the west. A. Measured seafloor heat flow (open squares), with uncertainties in measured values being smaller than the symbols. Dotted line is output of two dimensional conductive model, using lithospheric cooling curve as lower thermal boundary condition. B. Calculated SBI temperatures (circles) based on heat flow and seismic data and output of two-dimensional conductive model (dotted line). Uncertainties in upper basement temperatures are indicated by vertical bars, based on the accumulation of errors through downward-continuation calculations, as described in the text. C. Seismic data overlain by isotherms calculated from measured seafloor heat flow. Vertical exaggeration = ~25.
Previous | Close | Next | Top of page