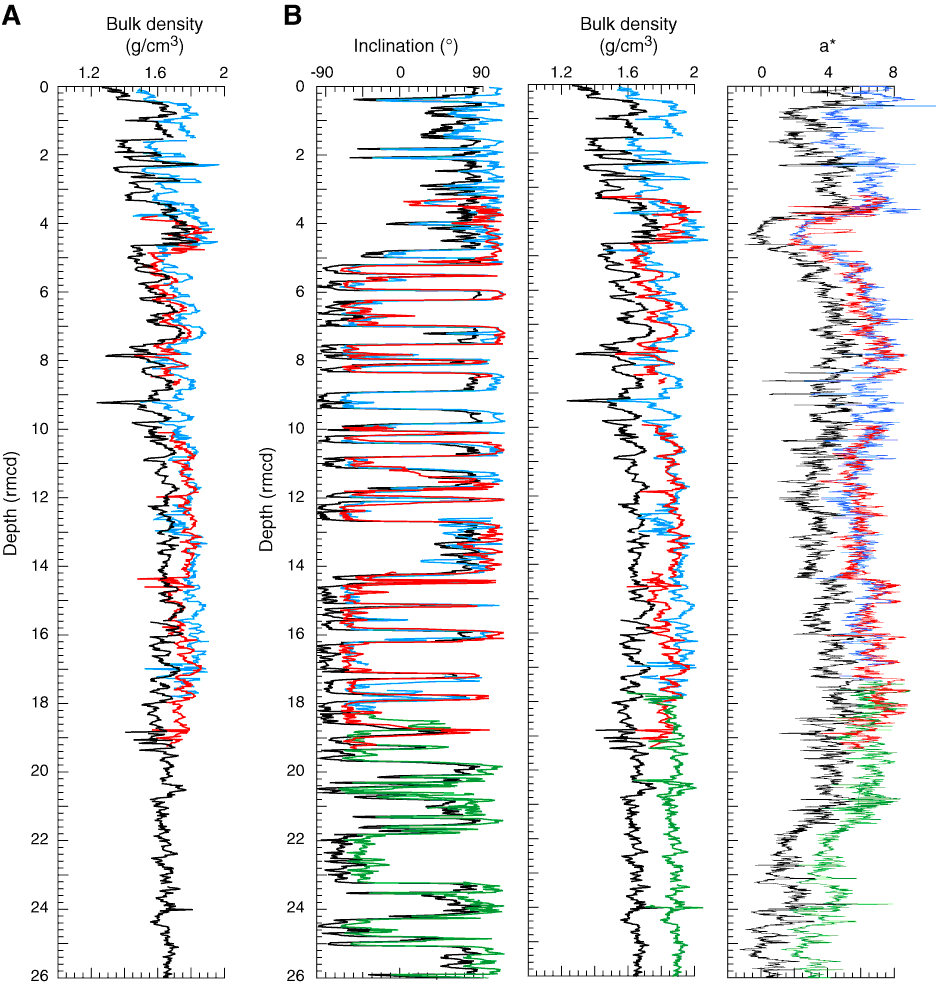
Figure F12. Tuning the rmcd depths. A. Bulk density records from Sites M0003A (red) and M0004C (blue) shown against the composite section in rmcd. Small offsets in the data can be seen where material from either site lies outside the splice trail. B. Bulk density, paleomagnetic inclination, and color reflectance (a*) values for Holes M0003A (red), M0004C (blue), and M0004A (green) displayed offset from the composite records. These records have been tuned to get the best fit between the material outside the splice trail and the composite splice. Ties for this tuning are given in Table T3.

Previous | Close | Next | Top of page