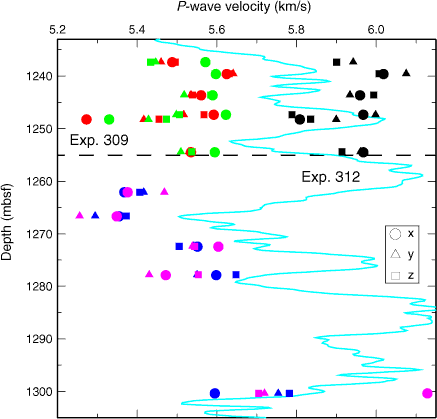
Figure F330. Uncorrected compressional velocities measured on Expedition 312 samples (blue) are significantly lower than velocities measured on samples during Expedition 309 (black). To test whether this offset is an artifact of instrument calibration, velocities of six Expedition 309 samples were measured during Expedition 312 (red = observer 1, green = observer 2). Velocities measured on minicubes during Expedition 309 are higher than velocities measured on the same rock samples during Expedition 312. During March 2006, J. Inwood from the Borehole Research Group at the University of Leicester measured the velocity of five Expedition 312 samples using the JOIDES Resolution Hamilton Frame at the IODP core repository in Bremen, Germany. These values (magenta) do not differ significantly from values measured during Expedition 312, indicating that drying and storage do not affect velocity. Velocities from the smoothed sonic log (light blue line) are generally lower than velocities measured during Expedition 309 consistent with the presence of cracks and fractures on scales larger than a few centimeters. Remeasured velocity values are listed in Tables T48 and T49. Circles = velocities measured on the x-axis, triangles = y-axis velocities, squares = z-axis velocities.

Previous | Close | Next | Top of page