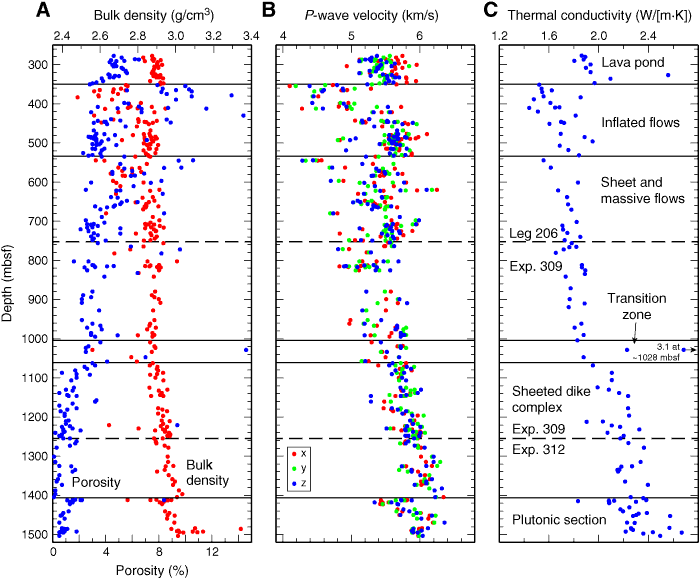
Figure F331. Hole 1256D shipboard laboratory measurements of (A) bulk density (red) and porosity (blue) show downhole variations similar to (B) compressional velocity and (C) thermal conductivity. There are no consistent differences between measurements along different axes (x, y, and z). Velocities of Expedition 312 samples were shifted 0.42 km/s higher to be consistent with the results of interexpedition calibration shown in Figure F330.

Previous | Close | Next | Top of page