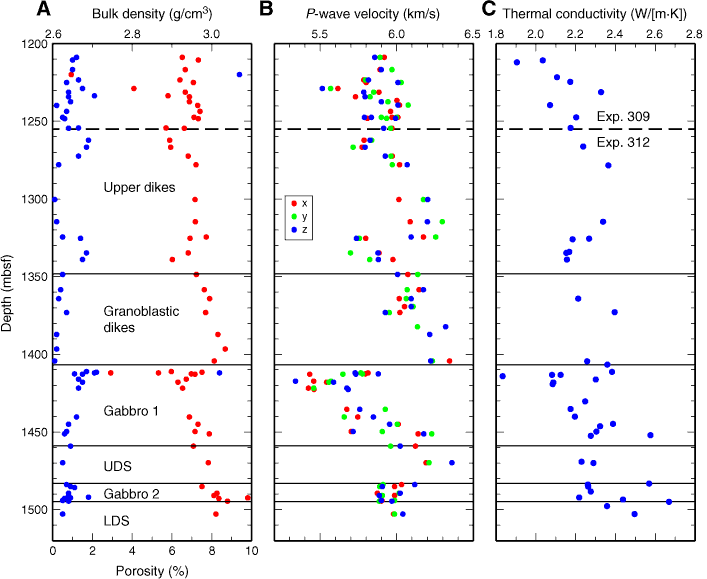
Figure F332. Expedition 312 shipboard laboratory measurements of (A) bulk density (red) and porosity (blue) show downhole variations similar to (B) compressional velocity and (C) thermal conductivity. There are no consistent differences between measurements along different axes (x, y, and z). Velocities of Expedition 312 samples were shifted 0.42 km/s higher to be consistent with the results of interleg calibration shown in Figure F330. P-wave velocity increases downhole but drops suddenly across intrusive contacts at 1325 mbsf (Unit 1256D-76), 1407 mbsf (Unit 1256D-81), and 1483 mbsf (Unit 1256D-91). UDS = upper dike screen, LDS = lower dike screen.

Previous | Close | Next | Top of page