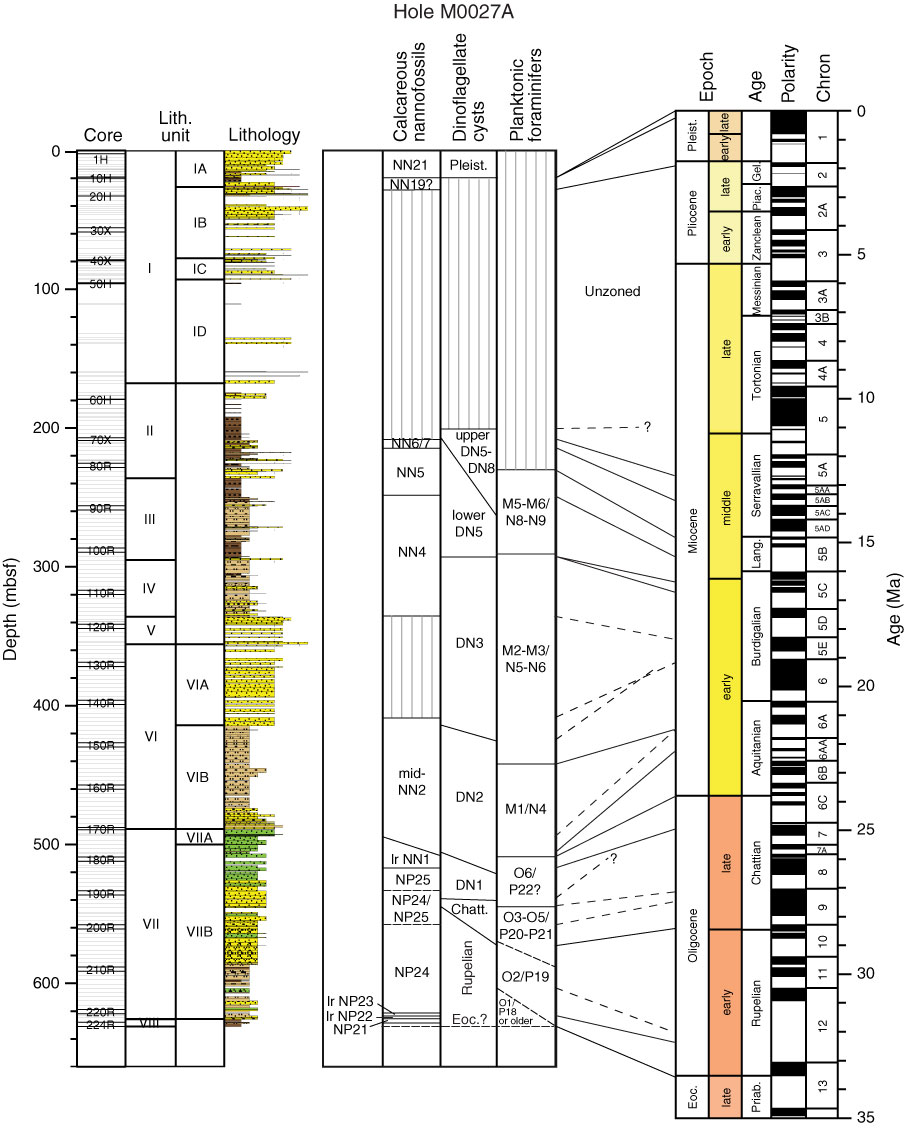
Figure F33. Biostratigraphic summary interpreted from calcareous nannofossils, planktonic foraminifers, and dinocysts, showing Miocene stages in Hole M0027A. See Figure F12 in the "Methods" chapter for an explanation of the datums used. Zone boundaries are drawn diagonally to indicate uncertainty in zonation between samples because of either the absence of sampling between points or of age-diagnostic taxa. Zonal boundaries are correlated to the geologic timescale. Dashed lines indicate some uncertainty in age assignment. The geologic timescale is that of Berggren et al. (1995), based on the geomagnetic polarity timescale of Cande and Kent (1995). See Figure F4 in the "Methods" chapter for lithology legend.
Previous | Close | Next | Top of page