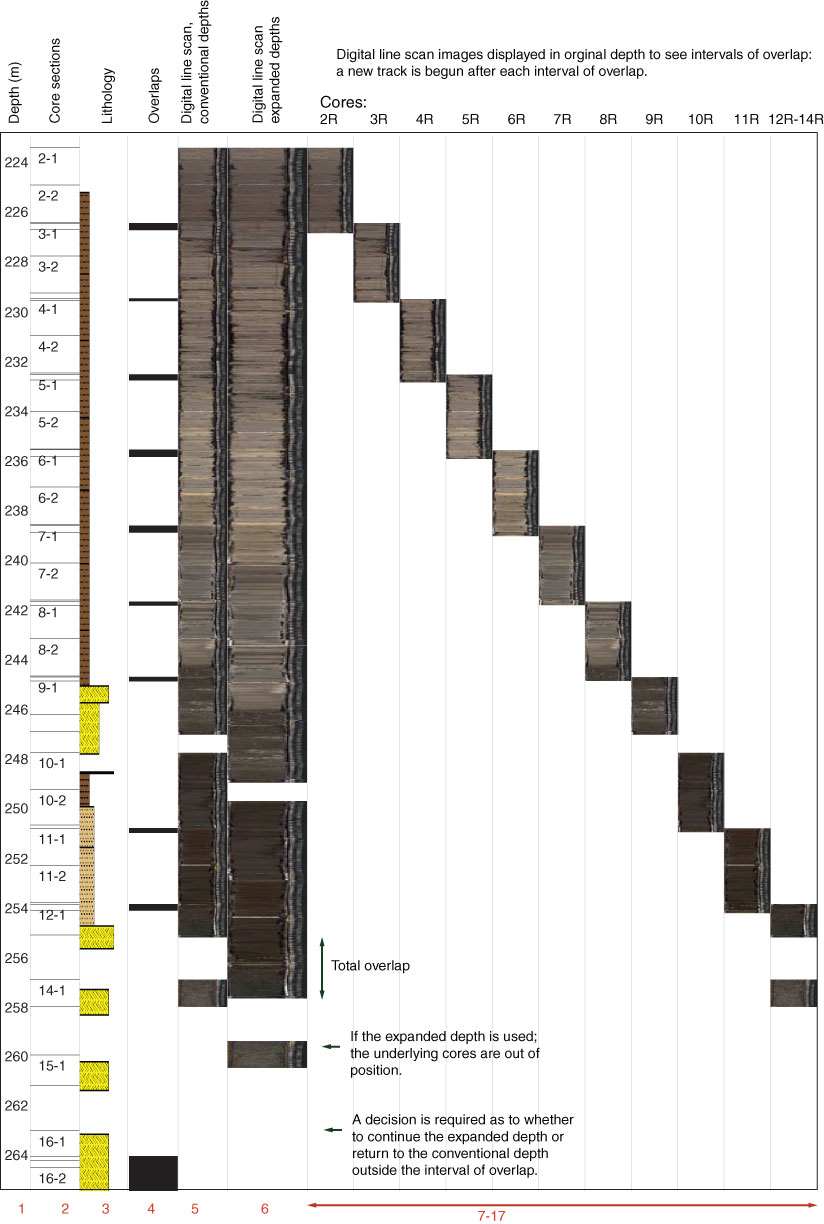
Figure F5. Upper expanding clay interval, Hole M0028A. Column numbers (red): 1 = depth (CSF-A with the exception of Column 6), 2 = core sections, 3 = lithology (see Figure F4 in the “Methods” chapter [Expedition 313 Scientists, 2010a] for lithology pattern definitions), 4 = overlaps (black bars), 5 = digital lines scan images at conventional depth, 6 = digital linescan images at expanded depth (note that the expanded depth used here is not a conventionally used IODP depth scale), 7–18 = digital linescan images at conventional depth but separated to show overlapping intervals. Refer to Figure F1 for location within the borehole.
Previous | Close | Next | Top of page