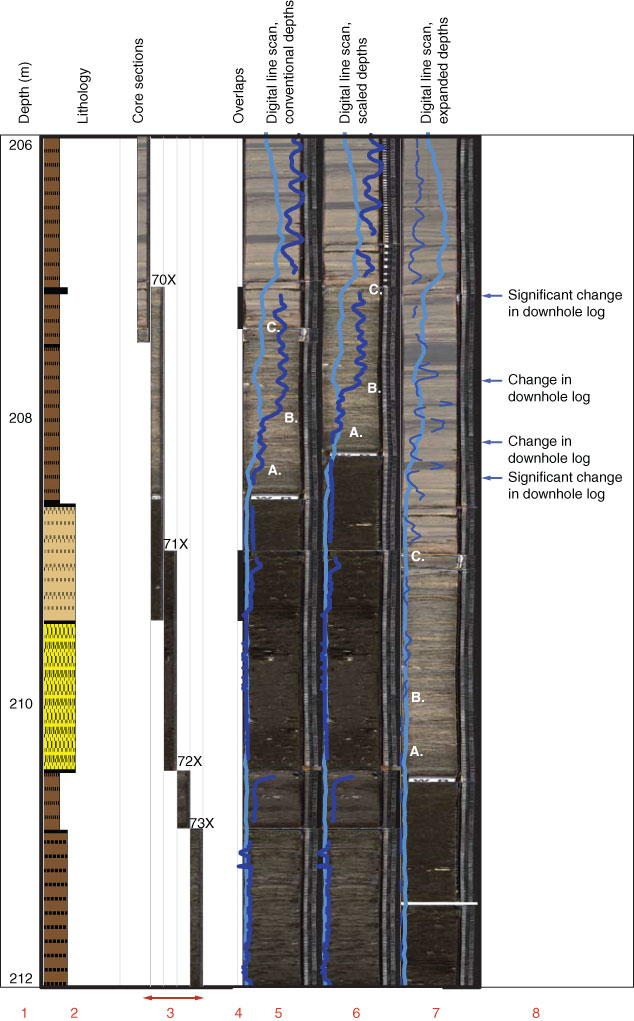
Figure F6. Expanding clay interval, Hole M0027A. Column numbers (red): 1 = depth (CSF-A, except where specified; refer to IODP Depth Scales Terminology at http://www.iodp.org/top-resources/program-documents/policies-and-guidelines), 2 = lithology (see Figure F4 in the “Methods” chapter [Expedition 313 Scientists, 2010a] for lithology pattern definitions), 3 = digital linescan images separated to show overlaps, 4 = overlaps (black bars), 5 = digital linescan images at conventional depth, 6 = digital linescan images at scaled depth (CSF-B), 7 = digital linescan images at expanded depth (not a conventionally used IODP depth scale), 8 = key magnetic susceptibility downhole log changes. Core magnetic susceptibility at the same depth scale as the associated core data (dark blue) and wireline magnetic susceptibility (light blue; WSF) are overlain on Columns 5–7. Note that the core magnetic susceptibility is shown as a log scale for Columns 5 and 6 and as a linear scale for Column 7 (see text). A, B, C = key changes in core magnetic susceptibility. Refer to Figure F1 for location within the borehole and Figure F4 for location within the clay interval.
Previous | Close | Top of page