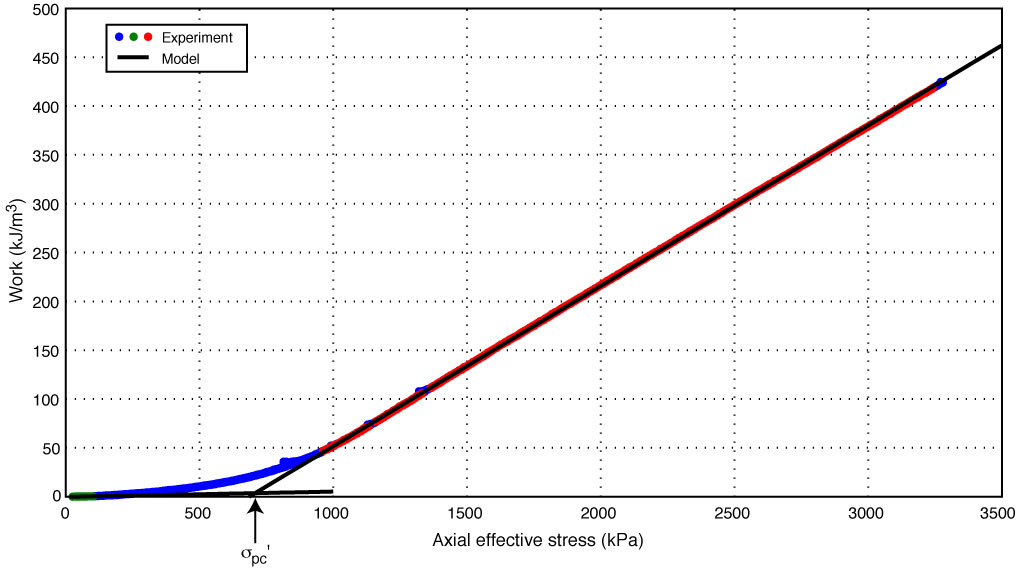
Figure F3. Work-stress analysis (Becker et al., 1987) of experiment CRS036 (Table T1). Red circles are interpreted normal consolidation data, green circles are early time, low-strain data, and blue circles are the entire data set. Solid black lines are best-fit models to the normal consolidation and early time data. Intersection of the best-fit models defines the preconsolidation stress (σpc′) (Becker et al., 1987). Complete data for all CRS consolidation experiments are available in 316_CONSOL in “Supplementary material.”
Previous | Close | Next | Top of page