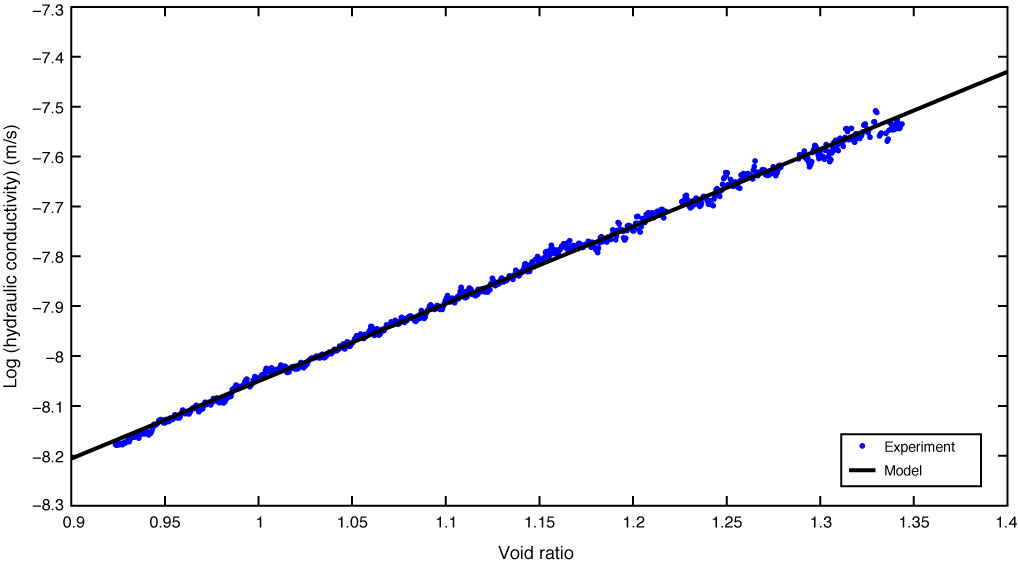
Figure F2. Logarithm of hydraulic conductivity (Equation 1) plotted as a function of void ratio. Data shown are the normal consolidation data from Figure F1 (green circles). Black line is best-fit model to the hydraulic conductivity-void ratio data assuming a log-linear relationship (Lambe and Whitman, 1969). Example is from Experiment CRS036 (Table T1). Complete data for all CRS consolidation experiments are available in 316_CONSOL in “Supplementary material.”
Previous | Close | Next | Top of page