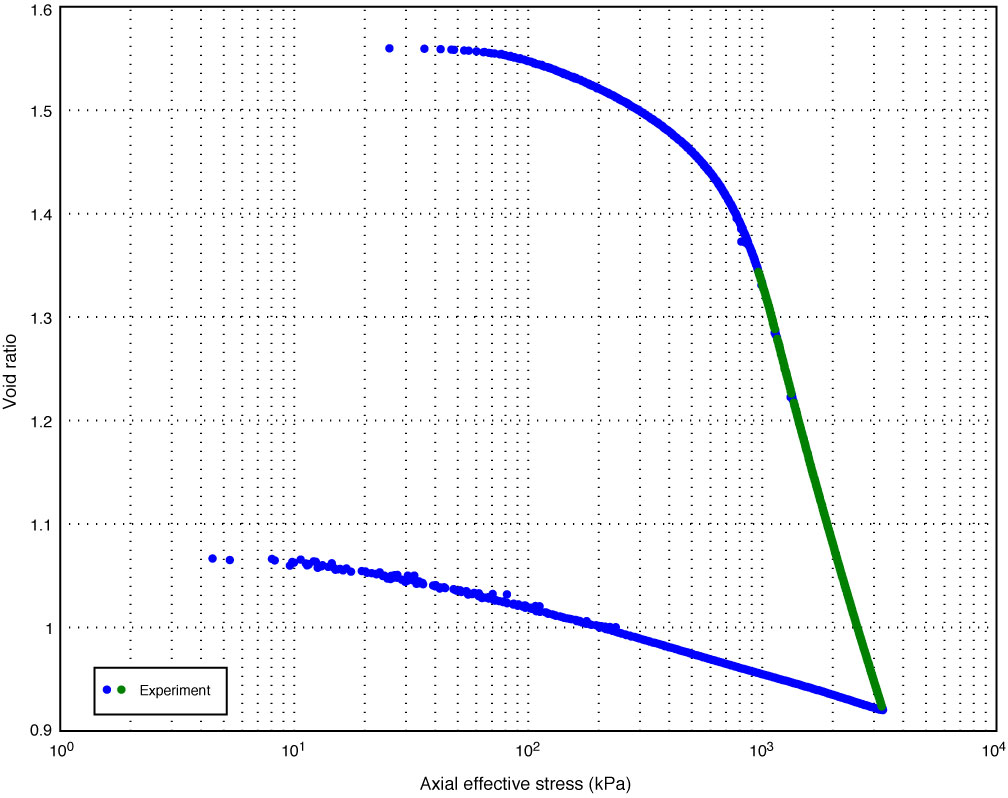
Figure F1. Constant-rate-of-strain (CRS) consolidation experiment data from Experiment CRS036 (Table T1). Blue circles are the entire data set; green circles are interpreted normal consolidation data that are used for hydraulic conductivity (Fig. F2), compression index (Equation 3), and preconsolidation stress (Fig. F3) analysis. Solid black line is the best-fit model to the normal consolidation data to define the compression index. Complete data for all CRS consolidation experiments are available in 316_CONSOL in “Supplementary material.”
Close | Next | Top of page