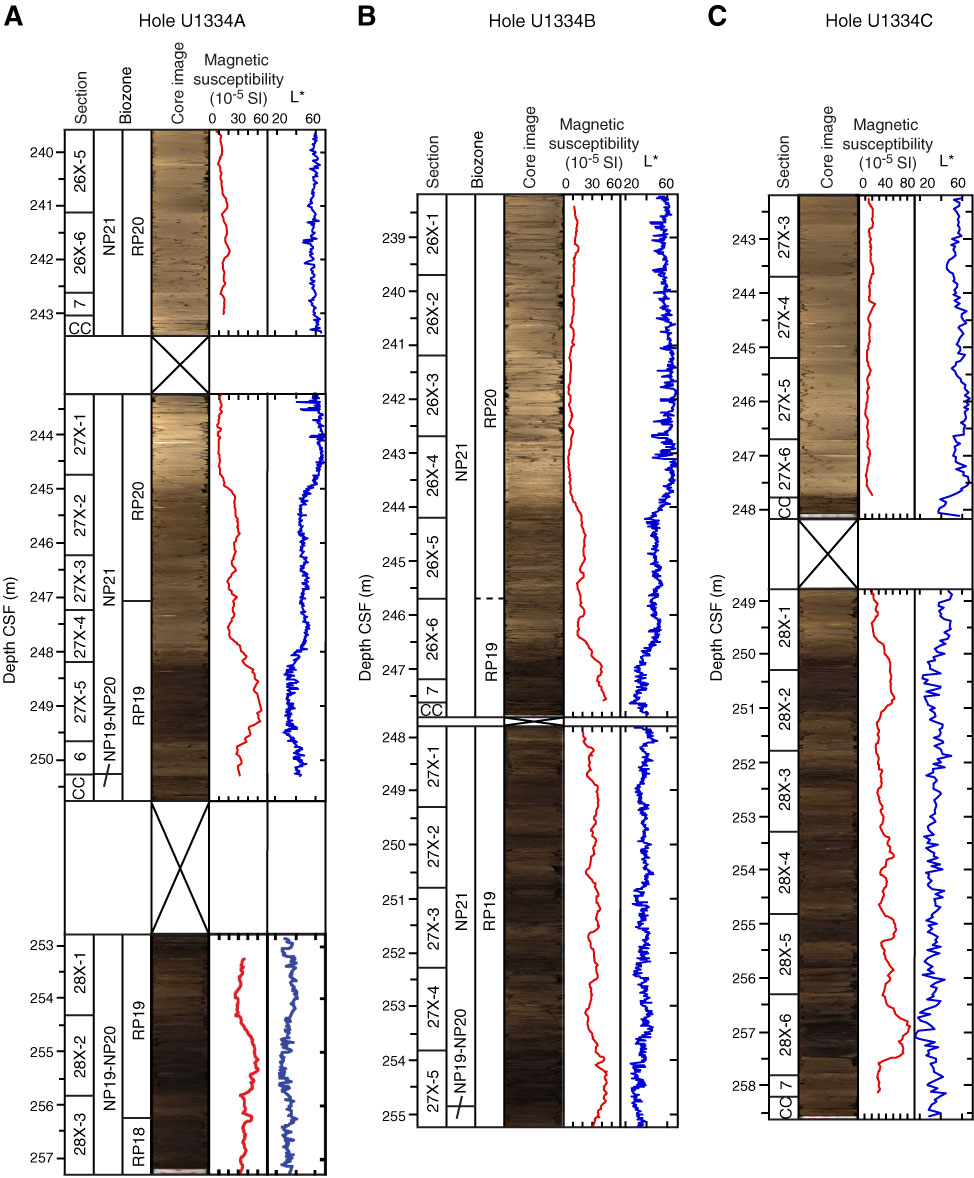
Figure F10. Line scan images of Eocene–Oligocene transition. A. Hole U1334A. B. Hole U1334B. C. Hole U1334C. Images were manipulated by applying a shadow-highlight adjustment to the whole image for better visual inspection of the darker strata. Nonmanipulated images are shown in Figure F12. L* = reflectance value of sediment as defined in the LAB color model.
Previous | Close | Next | Top of page