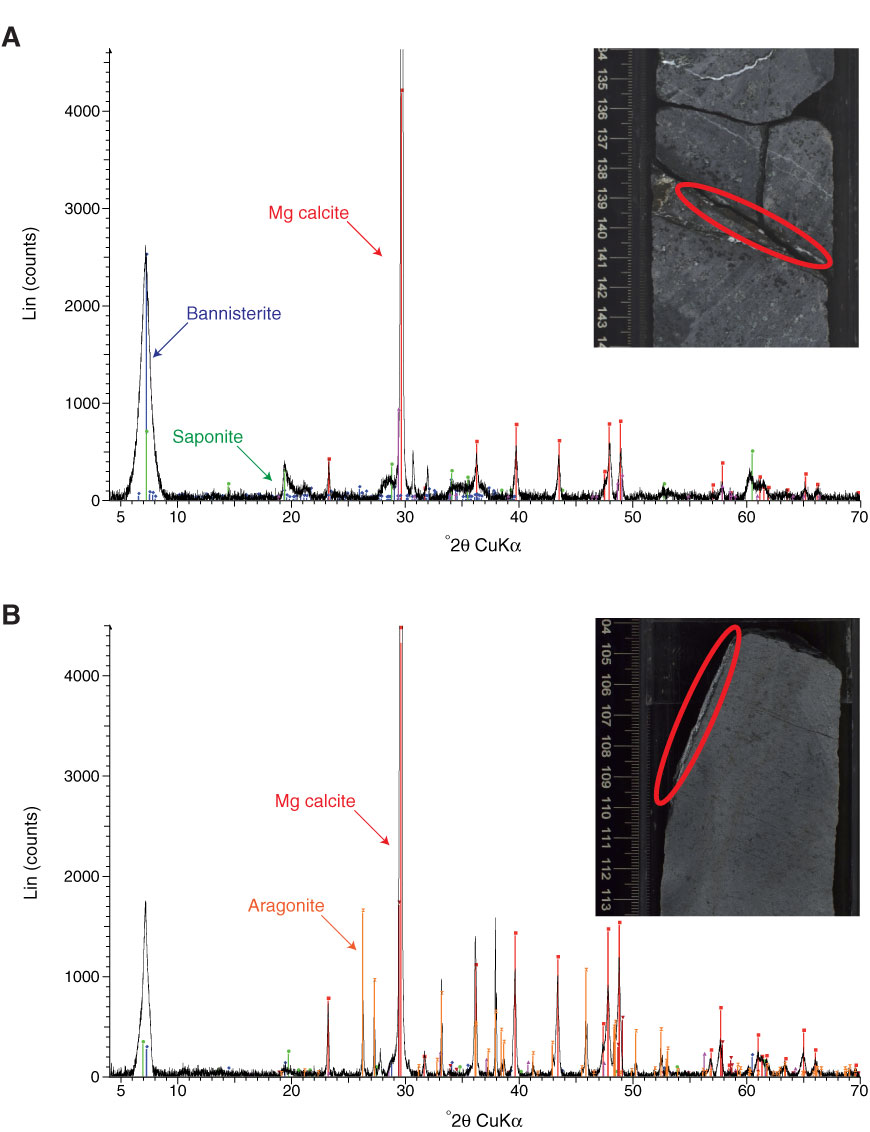
Figure F24. X-ray diffraction spectra and associated core photographs. Red ovals = analyzed zones. A. Composite banded vein (Sample 330-U1373A-7R-2, 141–142 cm) filled with Mg calcite, clay minerals (bannisterite and saponite), and small proportions of pyrite/chalcopyrite (pink lines). B. Composite and banded vein (Sample 330-U1373A-10R-2, 108–110 cm) filled with Mg calcite, aragonite, clay minerals (green lines = montmorillonite, blue lines = saponite), and small proportions of pyrite/chalcopyrite (pink lines).
Previous | Close | Next | Top of page