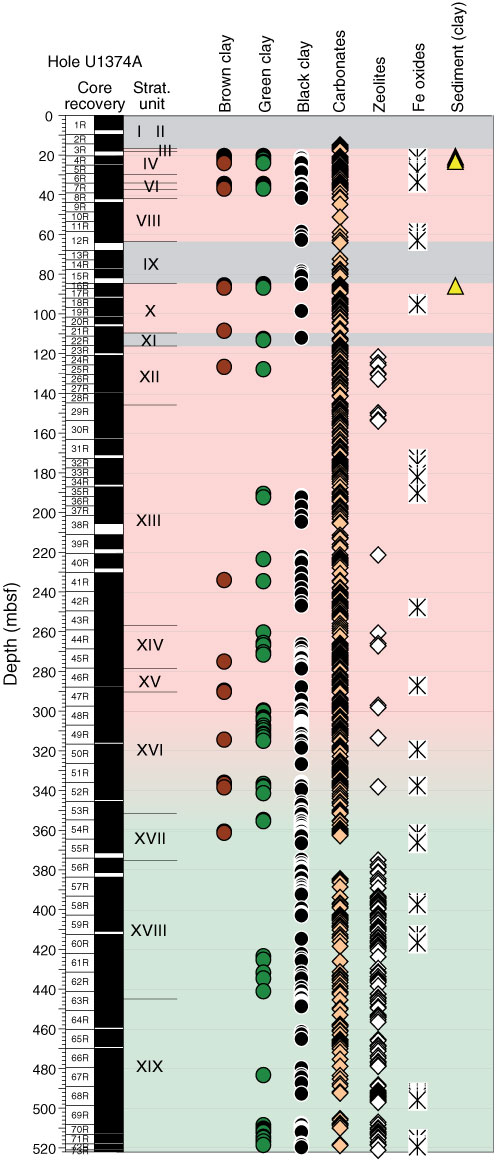
Figure F46. Plot of downhole distribution of vein minerals for each alteration interval defined by the alteration petrology group. Symbols are located at center depth for each interval. Note the predominance of carbonate throughout and the occurrence of zeolite mainly from ~370 mbsf to the bottom of the hole. The background color represents the main alteration color of the core (from Fig. F38). Gray shading represents sedimentary units, pink and green shading represents basalts that were altered under oxidized and reduced conditions, respectively.
Previous | Close | Next | Top of page