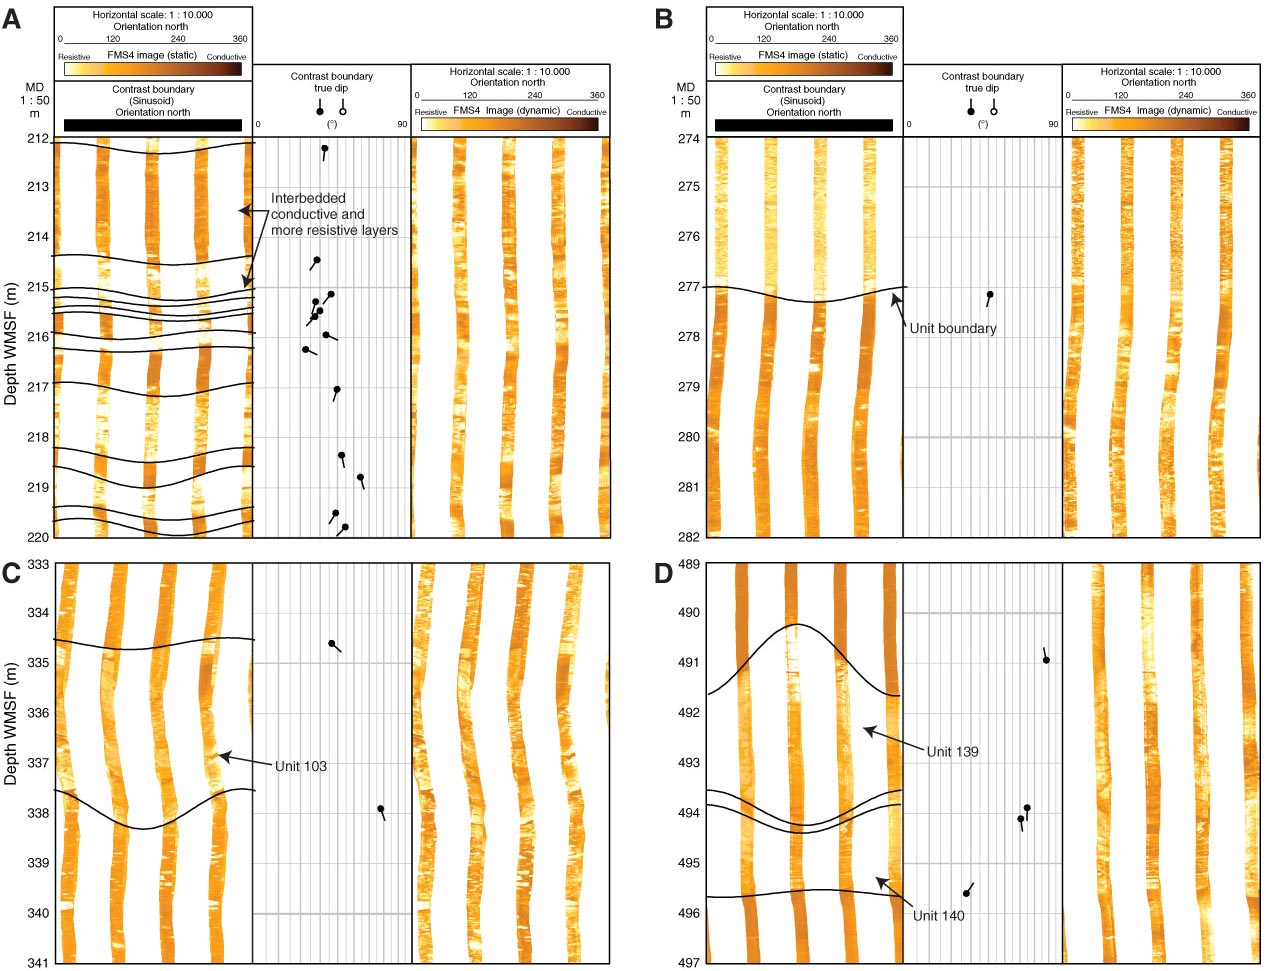
Figure F93. A–D. Summary figure of Formation MicroScanner (FMS) images showing examples of structural relationships between electrically contrasting layers, Hole U1374A. Best-fit sinusoids were picked on major features (in black), and tadpole plots of these dip angles and directions are shown next to FMS image (note that direction of tadpole tail indicates true azimuth of dip, and angle of dip is where circle is plotted). Both static- and dynamic-normalized FMS images are shown.
Previous | Close | Next | Top of page