Previous | Close | Next
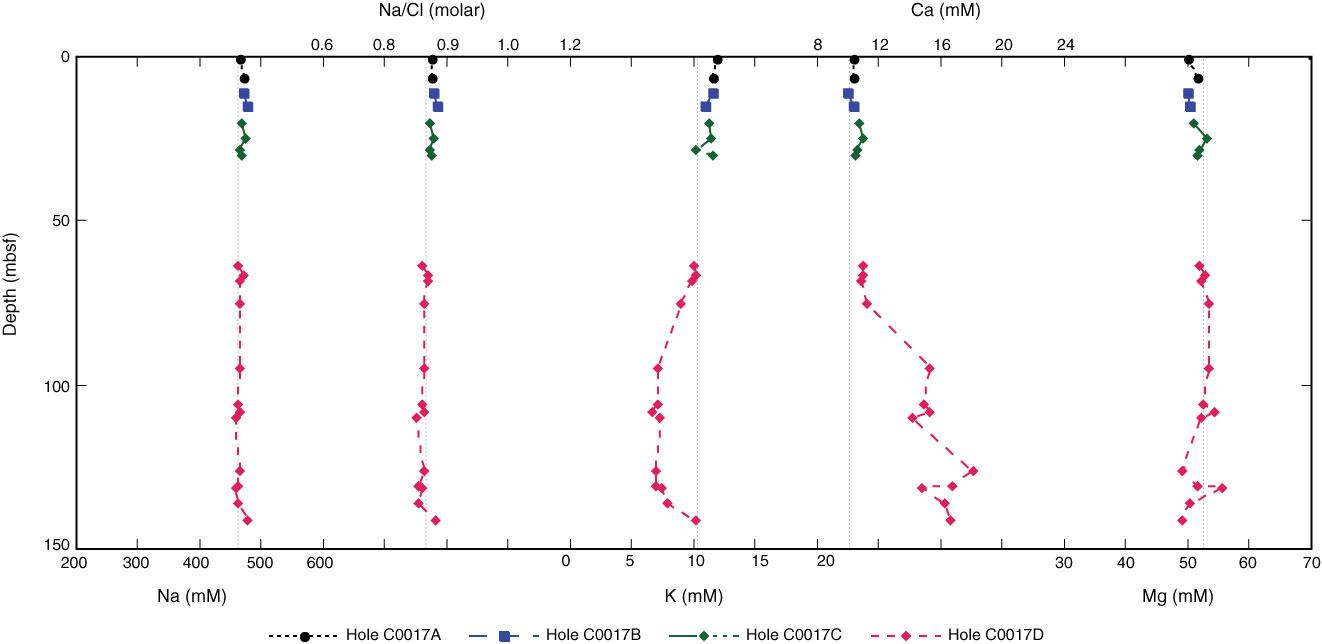
Figure F8. Plot of Na, Na/Cl, Mg, Ca, and K in pore water from Site C0017. Dashed lines indicate values in seawater as given in Table T6.
Previous | Close | Next | Top of page