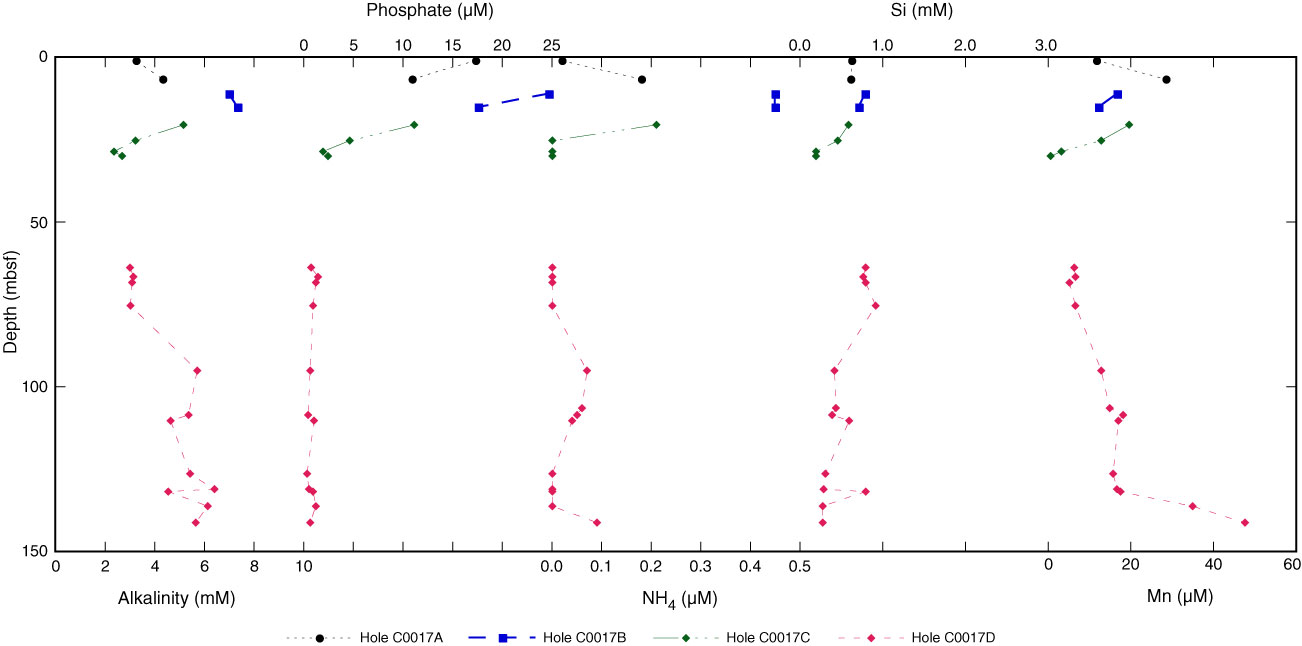
Figure F9. Plot of alkalinity, phosphate, ammonium, silicon (measured colorimetrically), and manganese in pore water from Site C0017. Note that values for ammonium that are labeled BD in Table T6 are plotted here as 0 µM.

Previous | Close | Next | Top of page