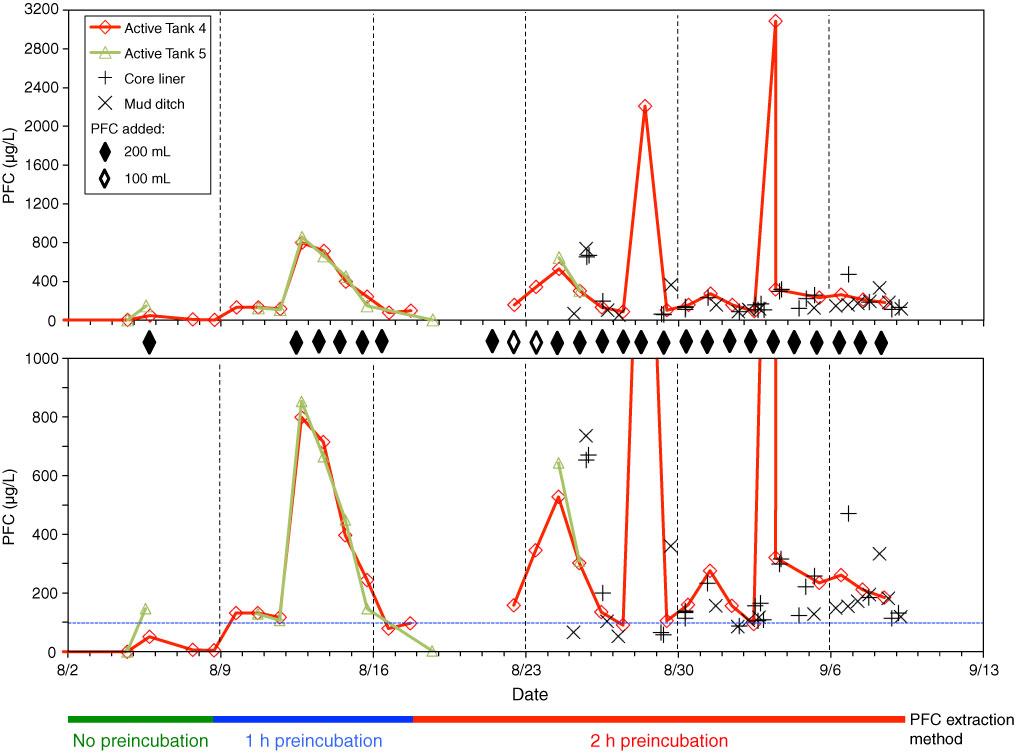
Figure F56. Time course of perfluorocarbon (PFC) concentration monitoring in drilling mud from actively mixed mud tanks (active Tanks 4 and 5), core liner fluid, and drilling mud that had circulated back on board the ship and was sampled in the mud ditch, from 2 August to 9 September 2012 (see x-axis) during Expedition 337. The two panels show the same data, but over different PFC concentration (y-axis) ranges. PFC was added on 25 days (diamonds). The very high PFC concentrations measured on two dates (upper panel) suggest lack of homogenization because of insufficient mixing at the time of sampling. Dashed blue line (lower panel) = PFC concentration (100 µg/L) assumed in all calculations of drilling mud and contaminant cell intrusion. The line at the bottom displays optimization of the PFC extraction protocol over the course of the expedition. All core samples underwent the final sampling protocol, which included 2 h of preincubation.
Previous | Close | Next | Top of page