Li, C.-F., Lin, J., Kulhanek, D.K., and the Expedition 349 Scientists, 2015
Proceedings of the International Ocean Discovery Program Volume 349
publications.iodp.org

doi:10.14379/iodp.proc.349.103.2015
Site U14311
C.-F. Li, J. Lin, D.K. Kulhanek, T. Williams, R. Bao, A. Briais, E.A. Brown, Y. Chen, P.D. Clift, F.S. Colwell, K.A. Dadd, W.-W. Ding, I. Hernández-Almeida, X.-L. Huang, S. Hyun, T. Jiang, A.A.P. Koppers, Q. Li, C. Liu, Q. Liu, Z. Liu, R.H. Nagai, A. Peleo-Alampay, X. Su, Z. Sun, M.L.G. Tejada, H.S. Trinh, Y.-C. Yeh, C. Zhang, F. Zhang, G.-L. Zhang, and X. Zhao2
Keywords: International Ocean Discovery Program, IODP, JOIDES Resolution, Expedition 349, Site U1431, South China Sea, deep-marine turbidite, pelagic red clay, seamount volcaniclastics, Ar-Ar dating, interflow sediment, mid-ocean-ridge basalt, basement magnetization, basalt alteration, radiolarians, Nereites ichnofacies, debris flow
MS 349-103: Published 30 March 2015
Background and objectives
International Ocean Discovery Program (IODP) Site U1431 is located near the relict spreading ridge where the youngest crustal magnetic anomalies are observed in the East Subbasin of the South China Sea (Figure F1). A positive magnetic anomaly lineation that runs through this site will possibly allow regional correlation of crustal age (Figure F2). This site is also surrounded by abyssal highs in the ocean crust and younger seamounts (Figure F3), whose volcanic and/or redepositional events are recorded in sediments recovered from this site.
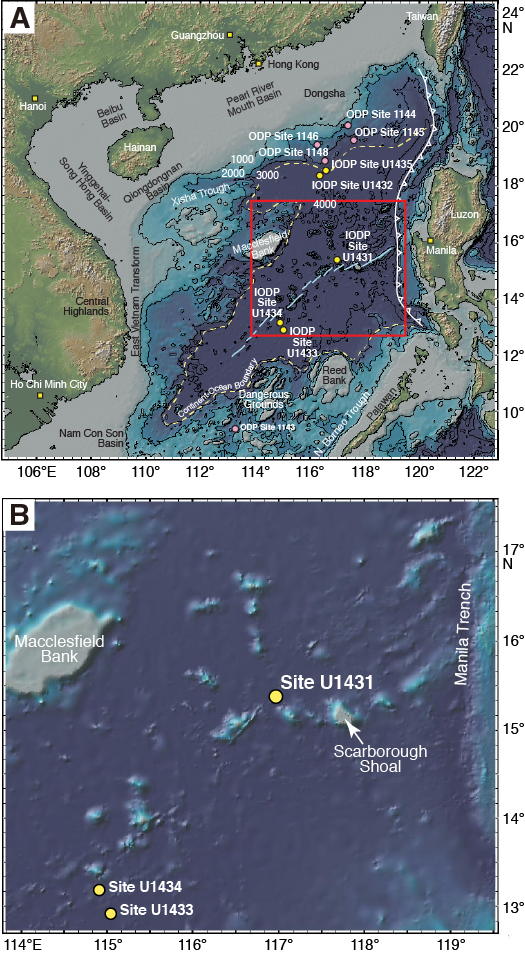
Figure F1. SCS regional bathymetry.
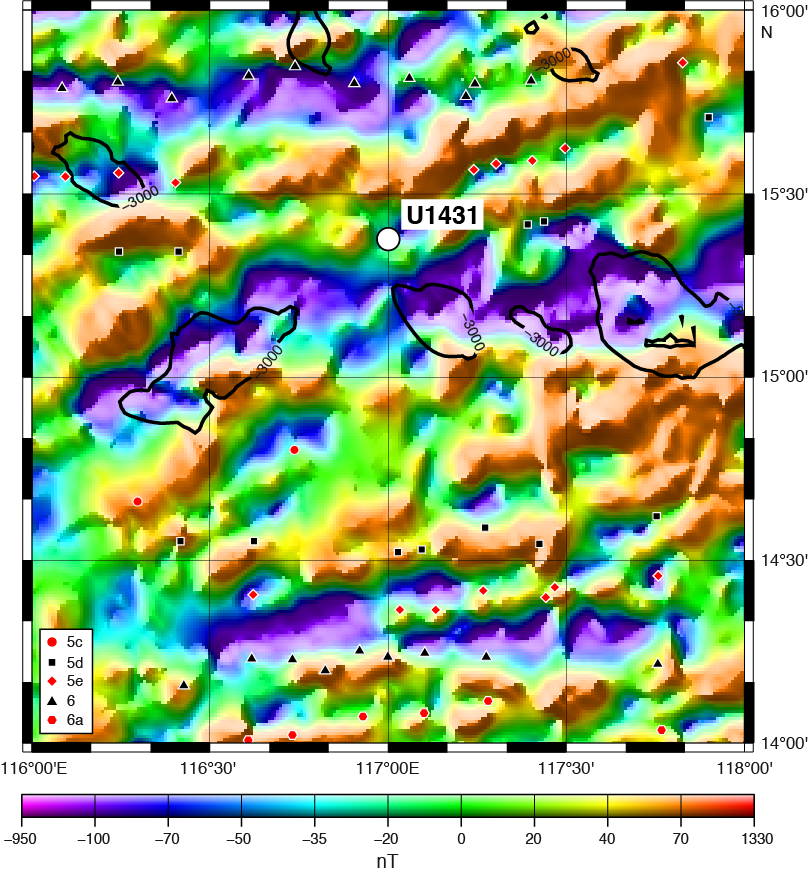
Figure F2. Magnetic anomalies.
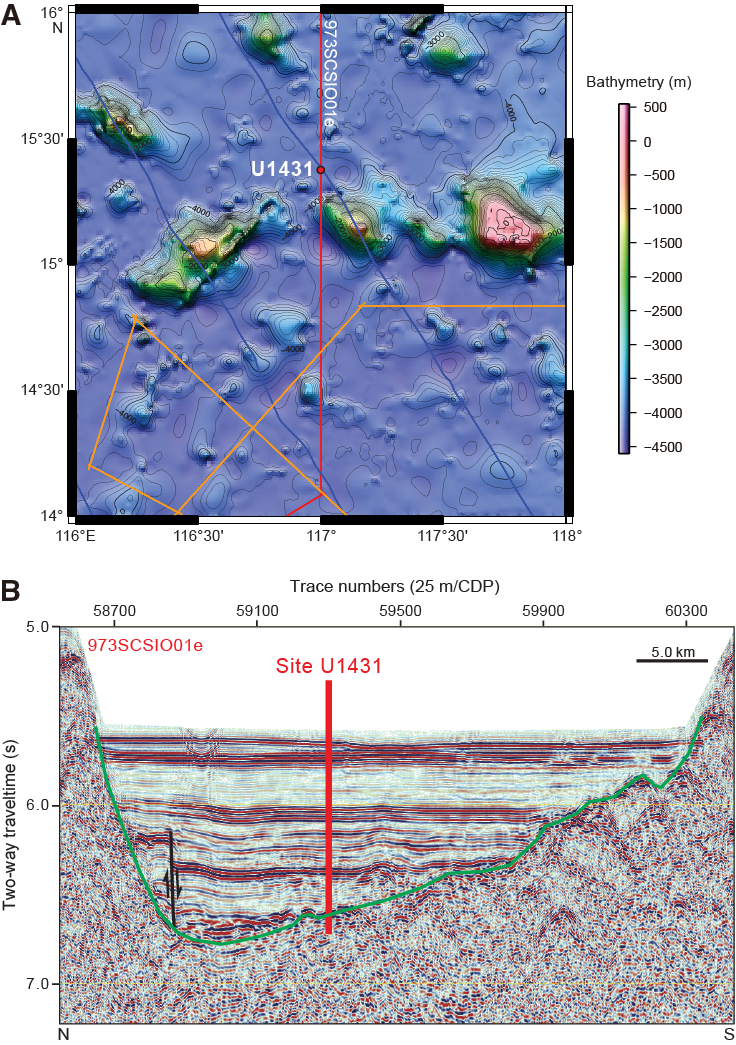
Figure F3. Regional contoured bathymetry.
The primary objective at Site U1431 is to core into the oceanic basement to determine the termination age of seafloor spreading in the East Subbasin. The thick package of sediment (~900 m) overlying basement will also provide important constraints on the evolution of the ridge and associated late-stage magmatism, deep-marine sedimentary processes, and the paleoceanographic history following the termination of seafloor spreading in the South China Sea. Additionally, this site will allow for correlation of biostratigraphic, magnetostratigraphic, and radiometric ages to the observed crustal magnetic anomalies. Physical property and paleomagnetism measurements of basement rocks will help elucidate the cause of the distinct magnetic contrasts between the East and Southwest Subbasins. Furthermore, this site will provide constraints on mantle source, melting, and magma crystallization processes in the latest stages of basin formation. Physical property measurements of core samples and wireline logging measurements will provide stratigraphic information for correlation with regional seismic profiles. Microbiological analyses will help explore the deep biosphere in the South China Sea to examine how sharp changes in lithology (interfaces) affect subsurface community structure and function, as well as how posteruption processes have influenced past ecosystems in the deep-sea basin.
Operations
The original operations plan for Site U1431 (proposed Site SCS-3G) called for one hole to a depth of ~1061 m below seafloor (mbsf), which included ~100 m of basement. The plan was modified during transit to include two additional short holes for high-resolution sampling of the upper ~20 m of section (Table T1). Hole U1431A was successfully cored using the advanced piston corer (APC) to 28.4 mbsf, and Hole U1431B was cored to 17.0 mbsf. After the first core from Hole U1431C retrieved a split core liner and no mudline, we opted to abandon the hole, which was completed to 14.2 mbsf, and spudded Hole U1431D. Hole U1431D was cored to 617.0 mbsf when the extended core barrel (XCB) failed, leaving the cutting shoe, core catcher sub assembly, and breakoff sub in the hole. We abandoned Hole U1431D and switched to the rotary core barrel (RCB) to spud Hole U1431E, which was drilled to 507.0 mbsf, spot cored, and then cored continuously from 575.0 mbsf to total depth at 1008.8 mbsf in igneous basement. After conditioning the hole for logging, two logging runs were performed. The triple combination (triple combo) tool string was run to 463.0 m wireline depth below seafloor (WSF), and the Formation MicroScanner (FMS)-sonic tool string was run to 444 m WSF with two passes. Total time spent at Site U1431 was 385.7 h (16.1 days).
Table T1. Coring summary, Site U1431. Download table in .csv format.
A total of 122 cores were collected at this site. The APC was deployed 26 times, recovering 225.61 m of core over 228.50 m of penetration (98.7% recovery). The XCB was deployed 48 times, recovering 236.50 m of core over 448.10 m (52.8% recovery). The RCB was deployed 48 times, recovering 243.00 m of core over 443.5 m of penetration (54.8% recovery).
Transit to Site U1431
After a 463 nmi transit from Hong Kong averaging 11.0 kt, the vessel arrived at Site U1431. A prespud meeting was held prior to arrival to review operations at the first site. The vessel stabilized and switched from cruise mode to dynamic positioning over Site U1431 at 0640 h (UTC + 8 h) on 31 January 2014. The positioning beacon was then deployed at 0712 h. The position reference was a combination of GPS signals and a single acoustic beacon.
Hole U1431A
After arriving on site and deploying the acoustic positioning beacon, the bottom-hole assembly (BHA) was picked up and assembled and then run in the hole with drill pipe to 4165.25 meters below rig floor (mbrf). All drill pipe was measured (strapped) and the internal diameter verified (drifted) during the pipe trip. There were no operational problems running the drill string to near the seafloor. The top drive was picked up, the drill string circulated out, and a pig was pumped to remove any debris that might have accumulated in the string. The calculated precision depth recorder depth for the site was 4252.1 mbrf, and after some consideration, 4248 mbrf was selected as the shoot depth for the first core. The bit was spaced out to 4248 mbrf, and the APC core barrel was run in the hole by wireline and landed. Hole U1431A was spudded at 0040 h on 1 February 2014. The mudline core recovered 9.45 m of sediment, and the seafloor was calculated to be 4248.1 mbrf (4237.3 meters below sea level [mbsl]). Nonmagnetic core barrels were used for APC coring from Core 349-U1431A-1H through 3H. Hole U1431A was terminated by plan at a final depth of 4276.5 mbrf (28.4 mbsf). At the conclusion of coring, the drill string was pulled from the hole. The seafloor was cleared at 0345 h, ending Hole U1431A. Three piston cores were taken over a 28.4 m interval, with a total recovery of 28.39 m of core. Overall core recovery for Hole U1431A was 100.0%. The total time spent in Hole U1431A was 21.0 h (0.9 days).
Hole U1431B
After the bit cleared the seafloor, the vessel was offset 20 m east of Hole U1431A. As part of the planned microbiological analyses, the perfluorocarbon tracer (PFT) pump was turned on and the drill string displaced with contamination testing fluid. The pump remained on for the remainder of coring operations in Hole U1431B. The bit was spaced out to 4245.5 mbrf in an attempt to recover ~7.0 m in the mudline core. The mudline core recovery was 7.5 m. The seafloor depth was calculated to be 4247.5 mbrf (4236.7 mbsl). Hole U1431B was spudded at 0420 h on 1 February 2014. Nonmagnetic core barrels were used for APC coring from Core 349-U1431B-1H through 2H to a final depth of 17.0 mbsf. At the conclusion of coring, the drill string was pulled from the hole. The bit cleared the seafloor at 0620 h, ending Hole U1431B. Two piston cores were taken over a 17.0 m interval in Hole U1431B, with a total recovery of 17.16 m of core (100.9% recovery). The total time spent on Hole U1431B was 2.58 h (0.1 days).
Hole U1431C
After the bit cleared the seafloor, the vessel was offset 20 m south of Hole U1431B. The bit was spaced out to 4245.5 mbrf. The mudline core recovery was 4.7 m, but the core liner was split. The seafloor depth was calculated to be 4250.3 mbrf (4239.5 mbsl). Hole U1431C was spudded at 0700 h on 1 February 2014. Nonmagnetic core barrels were used for APC coring from Core 349-U1431C-1H through 2H to a final depth of 14.2 mbsf. The PFT pump remained running during coring in Hole U1431C. Hole U1431C was terminated when we determined that the mudline core would not meet sampling requirements. At the conclusion of coring, the drill string was pulled from the hole. The bit cleared the seafloor at 0852 h, ending Hole U1431C. A total of 2 piston cores were taken over a 14.2 m interval in Hole U1431C, with a total recovery of 14.45 m of core (101.8% recovery). The total time spent on Hole U1431C was 2.42 h (0.1 days).
Hole U1431D
After the bit cleared the seafloor, the vessel was offset 20 m west of Hole U1431C. The bit was spaced out to 4245.0 mbrf. The mudline core recovery was 3.22 m. The seafloor depth was calculated to be 4251.3 mbrf (4240.5 mbsl). Hole U1431D was spudded at 0925 h on 1 February 2014. Nonmagnetic core barrels were used for APC coring from Core 349-U1431D-1H through 19H to 168.9 mbsf. Temperature measurements were taken with the advanced piston corer temperature tool (APCT-3) on Cores 4H, 7H, 10H, and 13H with good results. After 6 partial strokes of the APC, the coring system was switched over to the XCB. XCB coring continued from Core 20X through 67X at a final depth of 4868.3 mbrf (617.0 mbsf). The PFT pumps remained on through Core 23X. While cutting Core 67X, the rate of penetration dropped severely, and the core barrel was retrieved after a 2.7 m advance. While recovering the core barrel at the surface, we discovered that the cutting shoe, core catcher sub assembly, and the breakoff sub were missing from the XCB coring assembly. With ~1 m of junk metal remaining in the hole, we decided to pull out of the hole, offset, and begin a new hole with the RCB coring system. The top drive was then set back and the bit tripped from the hole, clearing the seafloor at 0355 h on 6 February. The bit was then tripped to the surface and cleared the rig floor at 1415 h, ending Hole U1431D. A total of 19 APC cores were taken over a 168.9 m interval in Hole U1431D, with a total recovery of 165.61 m of core (98.1%). The XCB was used 48 times over an interval of 448.1 m, recovering 236.50 m of core (52.8%). Overall core recovery for Hole U1431D was 402.11 m over an interval of 617.0 m (65.2% recovery). The total time spent in Hole U1431D was 125.5 h (5.2 days).
Hole U1431E
After offsetting the vessel 20 m west of Hole U1431D, an RCB BHA was assembled with a new RCB C-4 bit. The BHA was run in the hole to 4163.22 mbrf, and the rig crew performed a slip and cut of 115 ft of drilling line. The remainder of the drill pipe was then run in the hole. At 4221.46 mbrf, the top drive was picked up and spaced out to spud Hole U1431E. A center bit was dropped and pumped to land out in the bit. Hole U1431E was spudded at 0650 h on 7 February 2014. The seafloor depth for the hole was determined to be 4251.3 mbrf, calculated using an offset depth from Hole U1431D. Hole U1431E was advanced by drilling without coring from the seafloor to 507.0 mbsf. The center bit was pulled from the BHA by wireline, and a core barrel was dropped to take a spot core (349-U1431E-2R) from 507.0 mbsf. After cutting the core without recovery, the center bit was dropped and drilling continued from 516.7 to 575.0 mbsf. The center bit was then retrieved by wireline, a core barrel dropped, and continuous coring started with Core 4R from 575.0 mbsf. The next three cores (4R through 6R; 575.0–603.3 mbsf) did not recover any material. Coring continued with good recovery from Core 7R through 36R (603.3–894.3 mbsf). Core 36R was the first to recover basalt, with several small pieces present in the core catcher. Coring then continued into acoustic basement from Core 37R through 47R (894.3–991.4 mbsf). Penetration rates varied from 1.62 to 4.66 m/h over this interval, except for a sediment section in Core 45R that cored more quickly than the basalt. Microspheres were deployed in the RCB core catcher sub for Cores 12R through 43R.
With torque becoming higher and erratic, we decided to make a wiper trip to allow any debris collecting around the drill collars to fall into the hole. After pumping a sweep from the bottom of the hole, the drill string was pulled back to 862.95 mbsf. The bit was then run back to bottom, tagging fill material at 972.65 mbsf. With 18.75 m of fill in the bottom of the hole, a core barrel was dropped and the bit worked back to bottom without difficulty using circulation and rotation. The core barrel was retrieved with 0.65 m of material that was curated as ghost Core 48G. Another 50 bbl high-viscosity mud sweep was pumped after reaching 991.4 mbsf, and then another core barrel was dropped. Coring continued from 991.4 mbsf to the final depth of 1008.8 mbsf (Cores 49R and 50R). Just prior to finishing coring, a 50 bbl high-viscosity mud sweep was pumped to clean and condition the hole for logging. The total depth of Hole U1431E was reached at 0740 h on 14 February. After reaching total depth, the final core was pulled to the surface and laid out. A total of 47 RCB cores were collected in Hole U1431E over a 443.5 m interval, with a total recovery of 242.35 m of core (54.8% recovery, excluding the single 0.65 m ghost core).
At the completion of coring, the rotary shifting tool (RST) was deployed to activate the mechanical bit release and the bit was dropped in the bottom of the hole. The RST was retrieved, and the other RST run in the hole to shift the sleeve back into the closed position. The end of the drill pipe was then raised to a depth of 4900.08 mbrf (648.78 mbsf) with the top drive in place. The hole was displaced from 648 mbsf to the seafloor with 11.4 lb/gal high-viscosity mud designed to improve logging conditions. The top drive was set back, and the end of the pipe was raised to 4400.9 mbrf (149.62 mbsf) for logging operations. After holding a logging safety meeting for rig floor personnel, the triple combo tool string was rigged up and run in the hole, reaching 463.7 m WSF on 15 February. The hole was then logged up, a short repeat pass was recorded, and the tool string was then pulled to the surface and rigged down. After rigging down the triple combo tool string, the FMS-sonic tool string was rigged up and deployed to 444 m WSF. Two full passes were made with the tool string, and then the tool string was pulled to the surface and rigged down at 1915 h on 15 February. The drill string was then tripped out of the hole from 4900.9 mbrf (149.6 mbsf) and cleared the seafloor at 2010 h. While pulling out of the hole with the drill string, the starboard conveyor on the pipe racker had a hydraulic failure. The hydraulic block in the derrickman’s control booth was repaired, but 1.5 h was recorded as operational downtime. The rest of the trip out of the hole was uneventful, and the bit cleared the rig floor at 0555 h. The rig floor was secured for transit at 0600 h on 16 February, ending operations at Site U1431. Total time spent in Hole U1431E was 231.75 h (9.7 days).
Lithostratigraphy
Lithostratigraphic units
We defined 11 lithostratigraphic units (9 sedimentary and 2 igneous units) at Site U1431 based on visual core description, smear slide and thin section inspection, and scanning for an array of physical properties, including magnetic susceptibility and color spectra (see Lithostratigraphy and Physical properties in the Methods chapter [Li et al., 2015]). Although 5 holes were cored at this site, the lithostratigraphic units were determined mainly by a combination of Holes U1431D and U1431E because Holes U1431A–U1431C penetrated <30 mbsf (Figure F4). The lowermost sedimentary unit is interbedded with the basalt at the bottom of the cored stratigraphy. The dominant lithologies in the upper part of the stratigraphy (Units I–V) are clay, clayey silt, and silty sand with variable contents of nannofossil ooze and volcanic ash (Figures F4, F5). The lower part of the sedimentary stratigraphy (Units VI–VIII and X) consists mainly of volcaniclastic breccia and interbedded sandstone and claystone. The igneous lithologic units (IX and XI) mainly comprise massive basalt lava flows that are described in Igneous petrology and alteration.
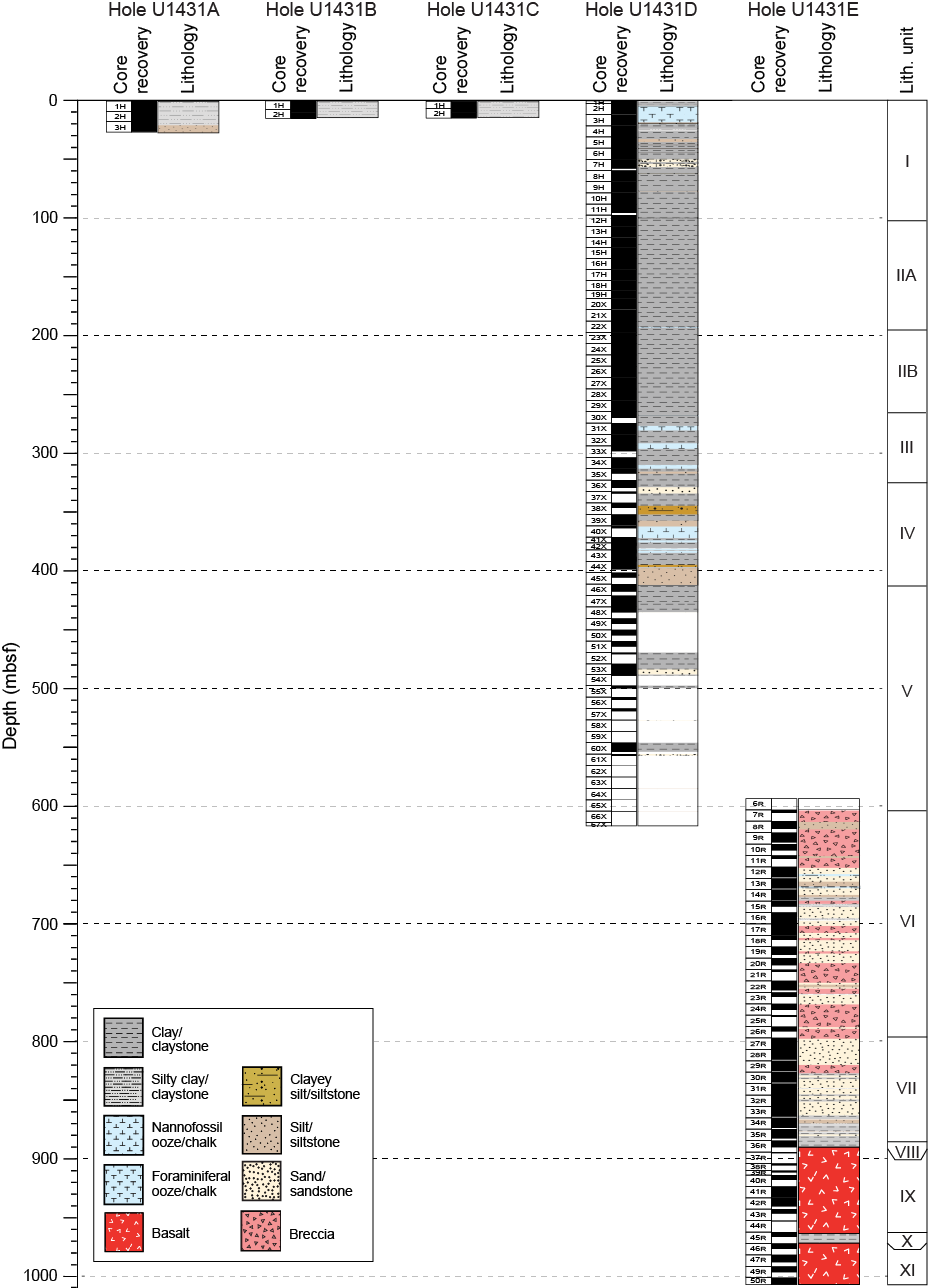
Figure F4. Lithostratigraphy summary.
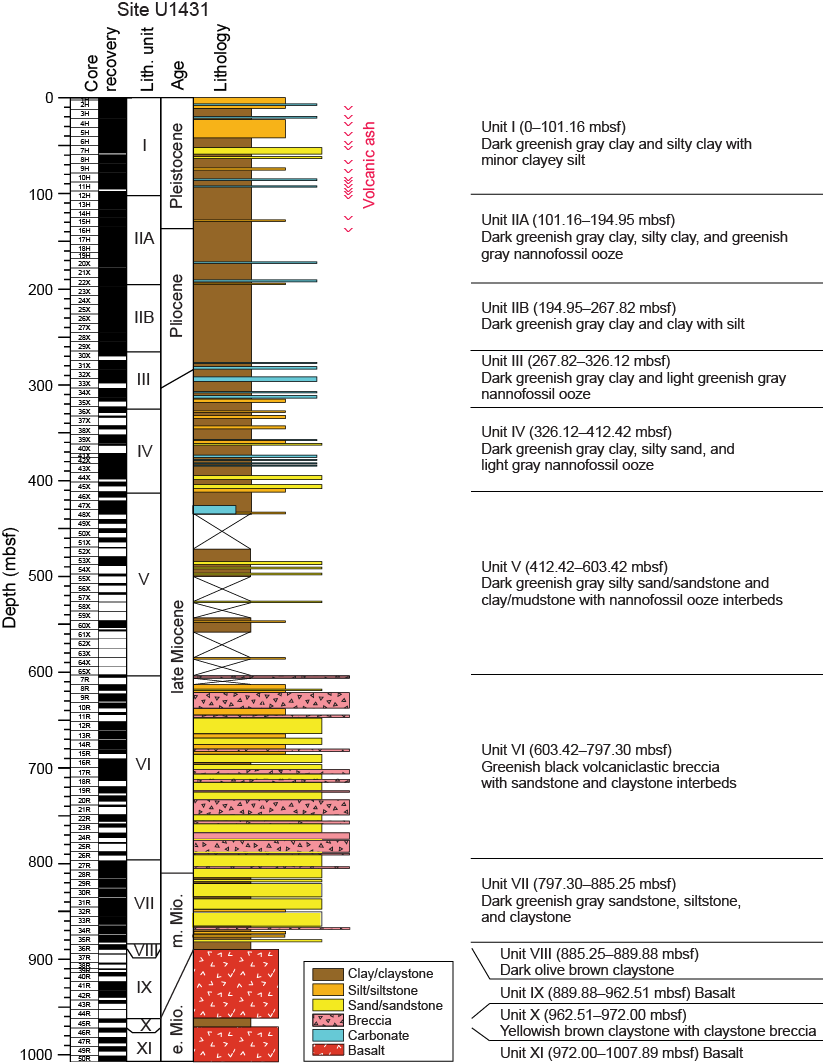
Figure F5. Synthesis sedimentary log.
Unit I is composed of dark greenish gray clay and silty clay with minor clayey silt. Unit II contains dark greenish gray clay (Subunit IIA) and silty clay with greenish gray nannofossil ooze intervals (Subunit IIB). Unit III contains dark greenish gray clay with volumetrically significant interbeds of light greenish gray nannofossil ooze. Unit IV is dominated by dark greenish gray clay and silty sand. Unit V is composed of dark greenish gray silty sand/sandstone interbedded with clay with nannofossil ooze intervals. Consolidation increases sharply at and below Core 349-U1431D-54X (~490 mbsf) in Unit V. Recovery was low between ~430 and 620 mbsf, but core catcher samples suggest that the section is primarily composed of loose sand. Unit VI is characterized by greenish black volcaniclastic breccia with significant numbers of sandstone and claystone interbeds. Sediment is completely lithified below Core 349-U1431E-7R (~603 mbsf) in Unit VI. Unit VII is defined by abundant dark greenish gray sandstone, siltstone, and claystone with minor intervals of volcaniclastic breccia. Unit VIII is composed of dark olive-brown claystone that overlies the basalt basement of Unit IX (see Igneous petrology and alteration). Unit X between the two basalt Units IX and XI consists of brown and yellowish claystone and claystone breccia. All unit boundaries are also recognized in both magnetic susceptibility and, to a lesser extent, color spectra (Figure F6).
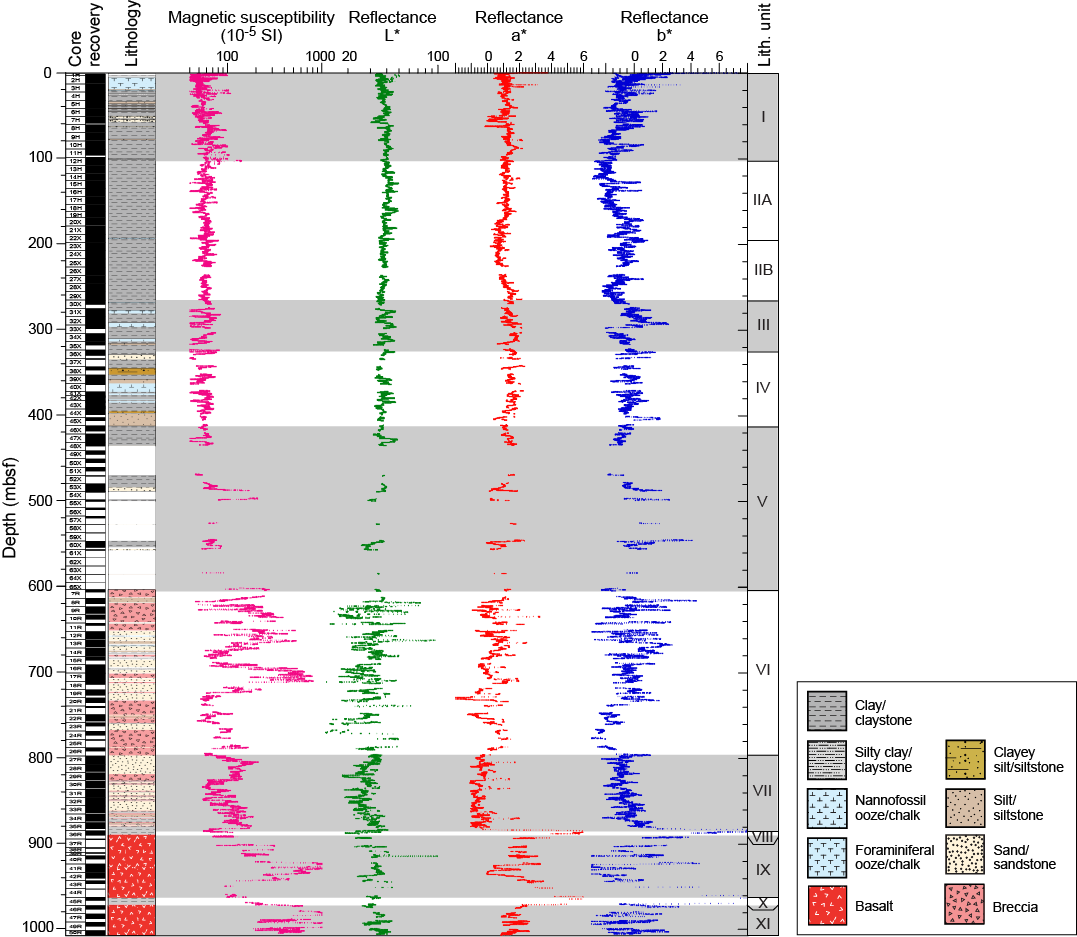
Figure F6. Spectroscopy correlation.
Unit descriptions
Unit I (0–101.16 mbsf)
- Intervals: 349-U1431A-1H through 3H; 349-U1431B-1H through 2H; 349-U1431C-1H through 2H; 349-U1431D-1H-1, 0 cm, through 349-U1431D-12H-2, 146 cm
- Depths: Hole U1431A: 0–28.06 mbsf (total depth); Hole U1431B: 0–17.03 mbsf (total depth); Hole U1431C: 0–14.36 mbsf (total depth); Hole U1431D: 0–101.16 mbsf
- Age: Pleistocene
Unit I spans the uppermost 101.16 m and is characterized by a sequence of clay, silty clay, and clayey silt. The more silty layers occur as dark greenish gray interbeds within a finer grained background and are typically marked by graded, fining-upward cycles that we interpret as turbidite sequences. Unit I is substantially more silty than the underlying Unit II. The redeposited silt-rich beds seen in this unit are usually 15–30 cm thick and are almost never thicker than 50 cm. At the base of each bed there is a sharp erosive contact between the overlying silty clay or clayey silt and the underlying clay layer. Microscopic inspection shows that the silt is composed of grains of quartz, feldspar, and smaller amounts of amphibole, mica, volcanic glass, and foraminifer shells (Figure F7). The clay layers are often massive and homogeneous but locally show the effects of bioturbation.

Figure F7. Silty sand.
Greenish gray nannofossil-rich clay and clayey nannofossil ooze occur in low abundances within Unit I and also display a fining-upward character above an erosive base. We interpret these as turbidite deposits. The thickest clayey nannofossil ooze beds have a coarser layer of foraminifer ooze at the base often showing parallel lamination indicative of current sorting. Unit I is noteworthy in having a high abundance of volcanic ash layers compared to other units. Thin volcanic ash layers (0.5–5.0 cm thick) are observed throughout this unit (e.g., Figure F8) and comprise <1% of the entire sequence, with up to 3 layers per section. Most ash layers are dark gray, blackish, or brown, suggestive of mafic to intermediate compositions.
Figure F8. Tephra.
Unit II (101.16–267.82 mbsf)
- Interval: 349-U1431D-12H-2, 146 cm, through 30X-2, 122 m
- Depth: 101.16–267.82 mbsf
- Age: early Pleistocene–Pliocene
Unit II is composed of dark greenish gray clay and silty clay with greenish gray nannofossil ooze intervals and is divided into two subunits on the basis of nannofossil content. Compared to Unit I, Unit II has very little silt, and we define the top of the unit at the base of the last major silt turbidite layer, below which silt is either admixed into the clay background or is present only as thin beds within a dominant clay section.
Subunit IIA (101.16–194.95 mbsf)
- Interval: 349-U1431D-12H-2, 146 cm, through 22X-5, 85 cm
- Depth: 101.16–194.95 mbsf
- Age: early Pleistocene–Pliocene
Subunit IIA is dominated by clay, clay with nannofossils, and silty clay. The boundary between Subunit IIA and IIB is defined at the base of the deepest major nannofossil-rich calcareous ooze bed. The thick-bedded clay is dark greenish gray in color and is interbedded with greenish gray, medium- to thick-bedded clay with nannofossil ooze and dark greenish gray, thin- to medium-bedded clayey silt layers. The clayey silt deposits that do occur fine upward into clay and have planar, sharp bases, often erosive in character, and we interpret these layers as turbidite sequences. The overlying clay is heavily bioturbated and is often completely homogeneous. Nannofossil-rich layers usually show sharp, erosive bases and fine upward from fine sand–grade foraminiferal ooze bases. These sequences are also interpreted as turbidite deposits. Deepwater trace fossil assemblages (Nereites ichnofacies) are seen in the color contrast between the lighter colored carbonate-rich sediment and the darker colored clay. Thin volcanic ash layers (0.5–2.0 cm thick) are occasionally observed in this unit but are limited to the top of the section and are much less common than in Unit I.
Subunit IIB (194.95–267.82 mbsf)
Subunit IIB is composed mostly of dark greenish gray clay and clay with silt. The clay intervals dominate and are generally thick bedded (>30 cm). The clay is typically homogeneous with faint color banding. The clay layers are interbedded with moderate- to thin-bedded clay with silt layers that fine upward and are often parallel-laminated downsection to sharp, erosive contacts with underlying clay. Sequences of clay with silt and overlying clay are mostly interpreted as turbidite deposits. Interbeds of greenish gray, thin- to medium-bedded clay with nannofossils form a minor lithology within the subunit. These interbeds do not exceed 5% of the total section and are also interpreted as turbidite deposits based on sedimentary structures. The tops of the carbonate turbidites often contain the Nereites ichnofacies, especially Chondrites. Volcanic ash layers are entirely absent from this subunit.
Unit III (267.82–326.12 mbsf)
- Interval: 349-U1431D-30X-2, 122 cm, through 36X-2, 132 cm
- Depth: 267.82–326.12 mbsf
- Age: early Pliocene to late Miocene
Unit III comprises clay together with significant volumes of interbedded nannofossil ooze that distinguish it from Unit II. The top of the unit is defined by the first prominent nannofossil ooze with foraminifers. Clay, which still dominates the section, is dark greenish gray and is found in thick-bedded layers interbedded with light greenish gray, moderate- to thick-bedded nannofossil ooze. The clay in particular shows strong bioturbation. Thin-bedded silty clay layers occur frequently within the dominant clay but account for <5% of the section. In contrast, nannofossil ooze layers are the most frequently occurring secondary lithology, and the base of Unit III is placed at the base of a large, 90 cm thick nannofossil ooze bed in Core 349-U1431D-36X. The nannofossil ooze beds are interpreted as calcareous turbidite deposits because they usually have planar, erosive contacts with the underlying clay layers and fine upward. They also show well-developed deepwater trace fossil assemblages (Figure F9). The thick nannofossil ooze beds have thin, parallel-laminated, sand-grade foraminifer ooze sections at their base. The foraminifer ooze is dominated by unbroken or large fragments of planktonic species. Volcanic ash layers are absent.
Figure F9. Deepwater trace fossil assemblage.
Unit IV (326.12–412.42 mbsf)
- Interval: 349-U1431D-36X-2, 132 cm, through 46X-1, 82 cm
- Depth: 326.12–412.42 mbsf
- Age: late Miocene
Unit IV comprises clay, nannofossil ooze, silt, and sandy silt mostly recovered in strongly biscuited cores from XCB coring. This unit is essentially different from Unit III in having a much greater proportion of coarser clastic beds, reaching sand grade in the thicker-bedded examples (Figure F5). The middle of the unit contains a significant number of nannofossil ooze layers, but the top and base of the unit are defined on the basis of the first and last appearance of sand and silty sand, respectively. The unit is nonetheless still dominated by dark greenish gray clay, which is thick-bedded and strongly bioturbated, with horizontal burrows of Chondrites and/or Thalassionoides type. No vertical burrows are observed. The clay layers are interbedded with silty sand layers that have planar, erosive contacts with the underlying clay layers. Silty sand beds are often tens of centimeters thick, usually fine upward, and are interpreted as turbidite deposits. Smear slide analysis shows that the sand differs from the silt found in Units I and II by having much higher proportions of mostly mafic volcanic glass shards, although quartz grains are still commonly found in silt and sand layers. The nannofossil ooze beds in the middle of the unit are medium- (10–30 cm) and occasionally thick-bedded (>30 cm), reaching almost 2 m thick in Core 349-U1431D-41X. These beds are made up of light gray sediment above a sharp, erosive base and grade up into greenish gray clay. The lower parts of the beds are silty, or even sandy, and parallel laminated, indicative of high-energy laminar flow during sedimentation, likely from turbidity currents. Unit IV is the shallowest unit to show visible effects of diagenesis beyond consolidation. Most prominent is the occurrence of pyrite concretions, which are found in small volumes in all main lithologies of the unit (Figure F10).
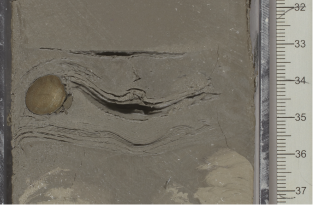
Figure F10. Thin silt turbidite.
Unit V (412.42–603.42 mbsf)
- Intervals: 349-U1431D-46X-1, 82 cm, through 66X-CC, 31 cm; 349-U1431E-7R-1, 0–12 cm
- Depths: Hole U1431D: 412.42–604.91 mbsf (total depth); Hole U1431E: 603.30–603.42 mbsf
- Age: late Miocene
The description and definition of Unit V is hampered by low recovery starting from Core 349-U1431D-48X through the total depth of Hole U1431D. Unit V is defined as lying below the base of an erosive silty turbidite in Section 349-U1431D-46X-1 and above a volcanoclastic breccia whose top is at 349-U1431E-7R-1, 12 cm. Recovered intervals of the unit are characterized by dark greenish gray silty sand and clay with nannofossil ooze layers. Core catcher samples indicate that some of the unrecovered section is sand and silt. As in Unit IV, the carbonate-rich beds fine upward with erosive or sharp, planar bases that indicate sedimentation from turbidity currents (Figure F11). Two types of clastic interbeds are noted, both showing normal grading and erosive bases. One variety is composed of greenish gray silt or silty clay that is quartz rich with low proportions of volcanic ash shards. The other clastic interbeds are generally coarser, ranging from sand to gravel, and are dominated by vesicular, mafic ash shards with minor amounts of quartz. These coarser-grained beds are generally dark green to black and less well sorted than the quartz-rich deposits. The volcanic shard–rich sands locally compose >40% of the section and are considered to be more proximal turbidite deposits than the quartz-bearing deposits. The tops of volcaniclastic turbidite beds show strong bioturbation, with prominent Nereites ichnofacies burrows that show a strong color contrast with the background sediment. Sediment becomes more lithified at and below Core 349-U1431D-54X (below ~490 mbsf) and is classified as silty sandstone and interbedded mudstone.
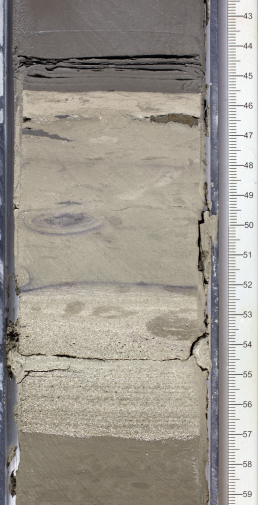
Figure F11. Normally graded calcareous turbidite.
Unit VI (603.42–797.30 mbsf)
Unit VI comprises greenish black or black volcaniclastic breccia with significant but subsidiary interbeds of sandstone and claystone. This unit is essentially different from all other units in having dominant thick-bedded volcaniclastic breccia (Figure F12). The breccia is typically massive, ungraded, and poorly sorted with angular to subangular basaltic clasts, as well as minor reworked subrounded calcareous mudstone, mudstone, and sandstone clasts. Thin- to medium-bedded breccia layers are occasionally found underlying sandstone and silty claystone sequences in the middle part of the unit. Sandstone is classified into at least two types, some more greenish gray in color, whereas others are very dark, almost black on the split core face. This color difference reflects changes in the relative abundance of dark sand grains, mostly pieces of basalt and basaltic glass. Figure F13A shows the moderate sorting of a typical fine sandstone. Close inspection (Figure F13B) shows the presence of opaque minerals within a dominant volcanic lithic, glass, and quartz framework with a clay matrix. Figure F14 shows a parallel-laminated siltstone with larger sand-sized quartz grains at the base of a turbidite bed. The cross-polarized light (XPL) image (Figure F14B) emphasizes the relatively low proportion of quartz in these deposits and thus their generally volcaniclastic provenance.
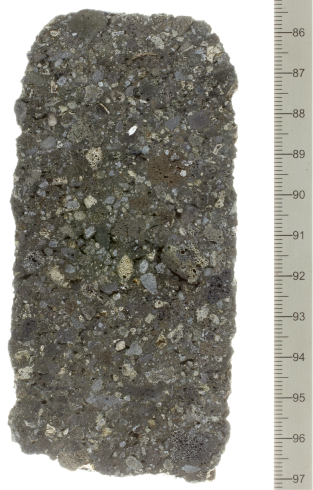
Figure F12. Volcaniclastic breccia.
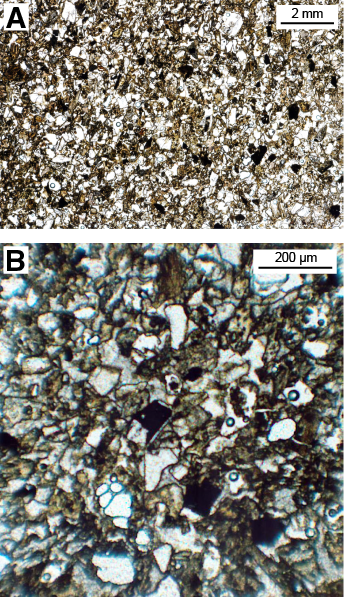
Figure F13. Black volcanic sandstone.

Figure F14. Graded sandstone base.
Four types of basaltic clasts are observed in the breccia units, including nonvesicular aphyric basalt, sparsely vesicular aphyric basalt, highly vesicular aphyric basalt, and nonvesicular glassy basalt (Figure F15). Medium- to thick-bedded dark gray volcaniclastic sandstone and claystone cycles occur as interbeds between the breccia layers. These intervals have current ripples and parallel laminations indicative of high-energy flow conditions during sedimentation (Figure F16). Bases with load structures also indicate that coarse clastic sedimentation was likely rapid and induced dewatering of the underlying claystone. The middle of the unit contains common interbedded dark greenish gray sandstone, siltstone, and silty claystone intervals. Reworked beds usually fine upward from sandstone to silty claystone over tens of centimeters and have sharp and erosive bases. These deposits are interpreted as turbidites. Sandstone and siltstone are commonly laminated or cross-laminated. In places, but only over short lengths of the core (<1 m), the lamination is not horizontal but shows steep dips (>40°) (Figure F17). We interpret this as syndepositional folding, most likely slump folding linked to mass wasting rather than tectonically induced tilting of the whole sequence. Silty claystone and claystone intervals are usually heavily bioturbated with typical Chondrites-dominated trace fossil assemblages.
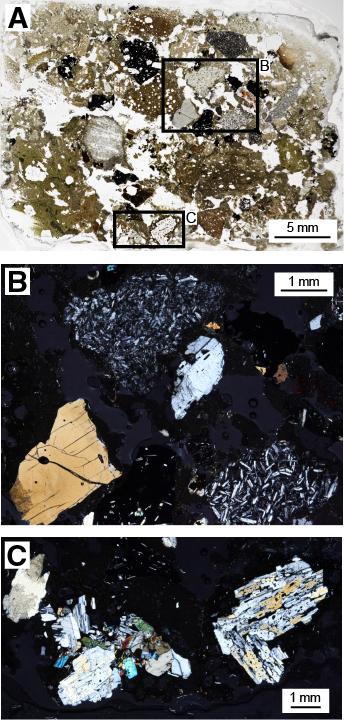
Figure F15. Volcanic breccia.
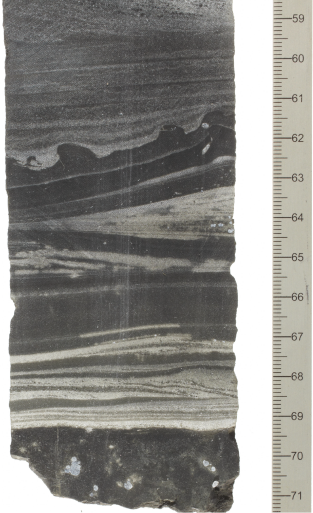
Figure F16. High-energy flow sand deposit.
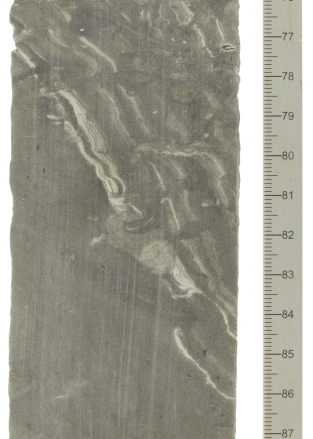
Figure F17. Greenish gray siltstone.
Carbonate beds are very rare in Unit VI, but carbonate is sometimes present as large pebble- and cobble-sized clasts in the breccia. In Section 349-U1431E-9R-5, there is a rare ~20 cm thick pelagic carbonate deposit. In thin section, this limestone is found to be micritic in texture, with minor amounts of opaque minerals and rare intact and broken planktonic foraminifers suspended in the background matrix (Figure F18). This bed is unusual in that it is clearly not redeposited and may reflect a period of quiet pelagic sedimentation.
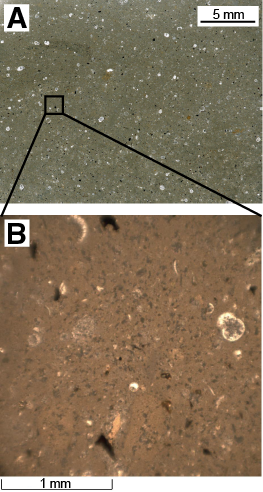
Figure F18. Carbonate interbed.
Unit VII (797.30–885.25 mbsf)
- Interval: 349-U1431E-27R-1, 0 cm, through 36R-1, 65 cm
- Depth: 797.30–885.25 mbsf
- Age: middle Miocene
The top of Unit VII is defined at the base of a thick-bedded volcaniclastic breccia that forms the lowest bed in overlying Unit VI. The unit is composed of dark greenish gray sandstone, siltstone, and claystone with minor intervals of volcaniclastic breccia. This unit is characterized by a sharp reduction in the volume of breccia compared to Unit VI. Sandstone is usually found interbedded with bioturbated and laminated siltstone and claystone. Together, these compose fining-upward, graded cycles that range from 10 cm to >1 m thick, all marked by erosive bases. These cycles are interpreted as turbidite sequences. The base of each graded unit is often composed of coarse sandstone with load casts and parallel lamination through the bottom half of the sandy interval. In the lower part of the unit, the interbedded siltstone and claystone cycles are mostly at centimeter scale with well-developed parallel and cross-lamination, especially in siltstone. Bioturbation is heavy in claystone and occasionally shows escape trace fossil structures penetrating from the underlying clay-rich siltstone into the overlying sandstone.
Unit VIII (885.25–889.88 mbsf)
- Interval: 349-U1431E-36R-1, 65 cm, through 36R-5, 17 cm
- Depth: 885.25–889.88 mbsf
- Age: middle Miocene
Unit VIII is characterized by thick-bedded, dark olive-brown to yellowish brown claystone that occurs only in Core 349-U1431E-36R. This claystone marks the base of the sedimentary sequence overlying the basement basalt. The 4.63 m thick claystone is massive and homogeneous in the lower part and laminated with silty claystone in the upper part. The core interval is variable in color and is light gray over limited sections. Figure F19 shows an example of the more homogeneous brown claystone with mottling, common small-scale burrows, and development of pyrite concretions. This sediment represents a very different sedimentary environment compared to the overlying lithostratigraphic units. We interpret it as a deep-sea pelagic deposit.
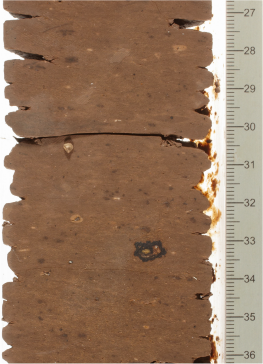
Figure F19. Claystone.
Unit X (962.51–972.00 mbsf)
Unit X is a claystone deposit interbedded within the basalt lava sequence. The recovered claystone (3.83 m thick) in Core 349-U1431E-45R differs from that in Unit VIII above the basement in being less homogeneous and characterized mostly by claystone with intraformational breccia or conglomerate. The breccia/conglomerate has rare basalt clasts with well-developed reaction rims. In the more massive claystone intervals, microscopic inspection reveals significant dispersed volcanic fragments. The upper part of Core 45R is more clastic, mostly with fragments of reworked claystone but with a few intervals containing granule and pebble grade basalt clasts (Figure F20). Black-brown altered pyrite grains occur sparsely in some intervals with bands ranging from 1–8 cm wide that we interpret to reflect diagenesis.
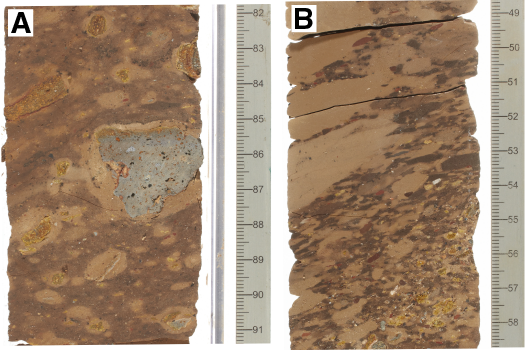
Figure F20. Unit X sediment.
Discussion
Gravity flow deposits
Gravity flow deposits are common throughout most units cored at Site U1431. They are divided into four types based on thickness, sedimentary structures, and clastic composition and are summarized here based on shipboard observations. In Unit I, gravity flow deposits occur as thin, fining-upward, silty clay and clayey silt turbidite beds. These turbidite sequences occur frequently, commonly 3–10 cycles per ~1.5 m. Silt-rich intervals at the base are usually 15–30 cm thick and generally thinner than 50 cm with irregular erosive contacts with the underlying clay layers. Considering their relatively young age (Pleistocene) and potential proximity to the Luzon arc, we speculate that their deposition might have been triggered by volcanism and/or earthquake events associated with the subduction tectonics.
In Units II and III, gravity flow deposits are dominated by thick clayey silt beds and beds of nannofossil ooze with foraminifers, which are also interpreted as turbidites. They usually display horizontal, erosive basal contacts with the underlying clay layers. Foraminifer ooze intervals at the bottom of some turbidite sequences are generally dominated by unbroken or large fragments of planktonic species that fine upward and are sand sized. Based on the calcareous components and deepwater depositional environment, thought to be deeper than the calcite compensation depth at this site, we suggest that the turbidite sediments could be transported from local sources (e.g., nearby seamounts topped by carbonate-rich environments).
Gravity flow deposits in Units IV and V consist mainly of silty to coarse-grained sand layers that are interpreted as turbidites. They occur as medium- to very thick bedded deposits, usually fining upward, with horizontal, erosive contacts with the underlying clay layer. Upper Miocene Unit V contains many thick, unconsolidated sand layers. The basal section of these turbidite layers is coarser grained than those in the upper two units, suggesting a different and more proximal provenance.
Units VI and VII contain various types of gravity flow deposits, including turbidites, slump deposits, and debris flow deposits as volcaniclastic breccia, indicating high-energy sedimentary environments. Black volcaniclastic breccia (see Breccia) and dark greenish gray sandstone are common in Unit VI. Sequences with sharp, irregular erosive bases and parallel lamination that fines upward from sandstone to silty claystone are interpreted as turbidites. In contrast, debris flow deposits in the form of volcaniclastic breccia and sandstone with gravels are poorly sorted and/or not graded. Slumps are seen locally, especially in the form of soft-sediment deformation structures (Figure F17). We hypothesize that this type of gravity flow deposit may be linked to earthquake and/or volcanic activity associated with mid-ocean-ridge tectonics soon after the cessation of seafloor spreading.
Breccia
Thick, massive, poorly sorted breccia beds dominate Unit VI and occur occasionally in Unit VII. The breccia beds range in thickness from a few centimeters to >4.8 m (Cores 349-U1431E-23R and 24R). The bases of breccia beds are sharp and erosive (Figure F21), and the beds coarsen upward over a thin interval as thick as 5 cm. In some of the thicker beds, the breccia then fines upward over several meters. In Core 17R, a 4 m thick breccia bed has coarser and finer intervals, suggesting deposition of the bed in several continuous but overlapping pulses. The breccia is overlain by 1.5 m of pebbly sandstone of the same composition and clast type. Section 349-U1431E-18R-2 includes the top of a breccia layer that fines upward through coarse and medium sand to laminated fine sand to silt. This bed is then overlain by silty clay (Figure F22). There may be a sharp contact between the massive breccia and the overlying laminated breccia, but it is hard to identify. Breccia occurs from the top of Section 11R-1 to the top of Section 8R-5; this interval also contains mudstone intervals that may be either large clasts or interbeds with irregular contacts. If this is one 14.45 m thick continuous breccia bed, grain size variation within the interval suggests deposition in several pulses, similar to Core 17R.

Figure F21. Sharp breccia layer base.
Figure F22. Breccia layer top.
Clasts in the breccia are angular to subrounded and are dominantly basaltic volcanic rock (Figure F12) with sparse single crystals of plagioclase and clinopyroxene, clasts of mudstone (sometimes calcareous), and mafic vitroclasts. Mudstone clasts are clay rich and contain foraminifer fossils. Some mudstone clasts are more rounded than others in the breccia and have thin altered rims, whereas some are laminated. Mudstone clasts are numerous in the breccia in Core 349-U1431E-9R, where one laminated mudstone clast appears to be ~60 cm in diameter. The large clasts extend over several pieces and are interpreted as clasts based on their upper and lower contacts with the breccia. The percentage of mudstone clasts decreases with depth in the hole.
The basalt clasts vary in the percentage of vesicles (from nonvesicular to highly scoriaceous) and in both texture and phenocryst content. Some clasts have a pilotaxitic texture and few phenocrysts, whereas in contrast, others are plagioclase-phyric (Figure F15) or contain both plagioclase and clinopyroxene. There are rare altered olivine phenocrysts in some clasts. Some basalt clasts have alteration rims suggesting alteration of a glassy groundmass. The matrix percentage varies between breccia beds, from very little up to 40%. The matrix is a mix of clay, finer grained altered basalt clasts, and mafic vitroclasts. There are occasional foraminifer fossils in the matrix (Figure F23). Some layers have calcite cement between clasts.

Figure F23. Foraminifer test.
The breccia beds were most likely deposited as a series of debris flows. This is supported by their massive structure, poor sorting, and reverse-graded bases (e.g., Middleton and Hampton, 1973; Lowe, 1982). Alternately, because they show similar features, they may have been deposited as grain flows that provide a mechanism for moving the gravel-sized clasts in breccia beds with little matrix. Grain flows are known to show reverse grading from base to top because larger clasts move toward the top as a result of high dispersive pressure (Saint-Ange et al., 2013); however, this is not apparent in the breccia beds at Site U1431. Variations in grain size in single breccia layers suggest pulsing in the flow. The finer grained and occasionally laminated upper parts of some layers suggest that the main debris flow was followed quickly by more dilute turbidity flows from the same source. The flow may have also transformed into a lower density turbidity current because of dilution and an increase in turbulence. At Site U1431, the subrounded shape of clasts and the mix of lithologies in the breccia, as well as the presence of foraminifer tests in the matrix, suggest that the clasts were reworked briefly in a shallow-water environment prior to being entrained in the debris flows, although clasts are not round enough for the deposits to have spent a significant length of time in a shallow-water, wave-influenced environment (e.g., Németh et al., 2009). The breccia units contain some large clasts. Although these clasts can be carried long distances through buoyancy by the matrix strength of a debris flow, studies of observed debris flows (e.g., Takahashi, 1991) show that such flows tend to deposit the largest blocks within the proximal fan or apron environment and that only the largest volume flows continue to deposit coarse debris outward to the distal environment. This supports a fairly local source for the clasts in the breccia, possibly from the nearby seamount volcanoes. Chemical analysis of the basalt clasts are described in Geochemistry and do indicate a “within-plate” seamount affiliation.
Ash layers
The combination of grading, sharp bases, and bioturbated tops (Figure F8) is typical of air fall ash deposited in deep-marine settings. The source of the darker colored, more mafic ash is likely to be proximal, whereas lighter colored, more felsic ashes that tend to be more explosive and spread farther from the source may be from either proximal or distal sources. The ash layers occur only in Unit I and at the top of Unit II (Figure F5), suggesting that either volcanism began abruptly at ~2.6 Ma or that the volcanic source moved closer to its current position at about that time. Prior to this, the source may have been too far for ash to travel to Site U1431. Alternately, the wind may have changed direction at ~2.6 Ma, shortly after the onset of Northern Hemisphere glaciation, when climatic conditions changed sharply on a global scale (Maslin et al., 1998).
Biostratigraphy
We analyzed core catcher samples and selected samples from within cores for calcareous nannofossils, planktonic foraminifers, and radiolarians in all holes at Site U1431. Biostratigraphic datums based on calcareous nannofossils, planktonic foraminifers, and radiolarians show that the sedimentary succession recovered at Site U1431 spans the lower Miocene to the Pleistocene (Figure F24; Tables T2, T3, T4). Age determination for the Miocene section is difficult because of very rare occurrences of calcareous nannofossils and planktonic foraminifers in the depositional sequences, which are dominated by turbidites (lithostratigraphic Units IV–VII; see Lithostratigraphy).
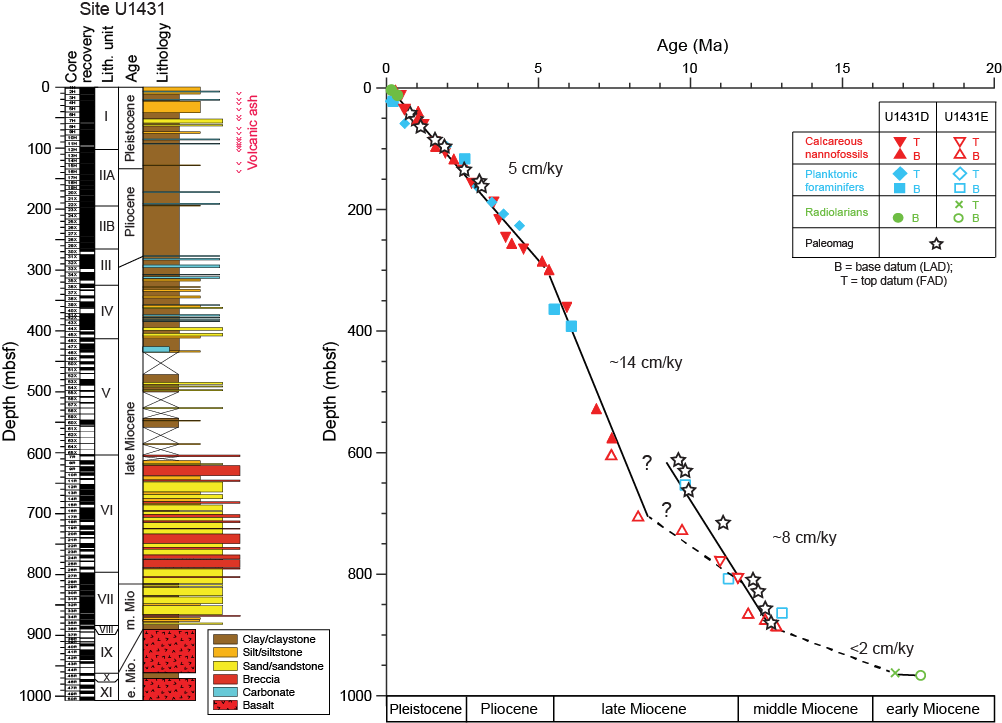
Figure F24. Age-depth model.
Table T2. Depths and ages of calcareous nannofossil events, Holes U1431D and U1431E. Download table in .csv format.
Table T3. Depths and ages of planktonic foraminifer events, Holes U1431D and U1431E. Download table in .csv format.
Table T4. Depths and ages of radiolarian events, Holes U1431D and U1431E. Download table in .csv format.
The biostratigraphic record is discontinuous in Hole U1431E due to the absence of calcareous nannofossils in most of the samples from volcaniclastic breccia and sandstone of Units VI–VII and claystone of Units VIII and X and of planktonic foraminifers in Units VIII and X, as well as in parts of Units VI and VII. Very rare reworked Paleocene nannofossils occur in Unit X. Although absent in the upper part of the sequence, radiolarians become common in Units VIII and X. Two radiolarian events in the interflow claystone of Unit X (at 963.27 and 966.28 mbsf) are indicative of an early Miocene age (16.73–17.59 Ma) (Table T4).
Preservation of calcareous nannofossils and planktonic foraminifers is good to moderate, providing a robust biostratigraphic framework for the Pleistocene to Pliocene (Tables T2, T3). Some fragmentation of planktonic foraminifers is evident in most samples. The uppermost core catchers (Samples 349-U1431D-1H-CC through 3H-CC) also contain well-preserved, highly diverse assemblages of radiolarians typical of low latitudes and very low abundances of other siliceous microfossils, such as diatoms and sponge spicules. Radiolarians are not observed below Sample 349-U1431D-5H-CC (41.33 mbsf) except in the deep-sea claystone of Units VIII and X.
Calibrated biohorizons allow us to estimate extremely low sedimentation rates (<2 cm/ky) during the early Miocene to middle Miocene (lithostratigraphic Units VIII and X). The sedimentation rate increased to ~8 cm/ky toward the late middle Miocene (Unit VII). During the late Miocene, sedimentation rates increased to ~14 cm/ky, the highest observed for Site U1431, before decreasing to ~5 cm/ky during the Pliocene–Pleistocene (Figure F24). Resolution of the age discrepancy between bioevents and paleomagnetic datums (see Paleomagnetism) given for Unit VI (question marks in Figure F24) awaits further postexpedition studies.
Calcareous nannofossils
Core catchers from all holes (U1431A–U1431E) were examined (Tables T5, T6, T7). Calcareous nannofossil biostratigraphy for Site U1431 is based mainly on analysis of all core catcher samples from Holes U1431D and U1431E. To better constrain biostratigraphic events, a number of samples from within cores were also analyzed.
Table T5. Distribution of calcareous nannofossil species, Holes U1431A, U1431B, and U1431C. Download table in .csv format.
Table T6. Distribution of calcareous nannofossil species, Hole U1431D. Download table in .csv format.
Table T7. Distribution of calcareous nannofossil species, Hole U1431E. Download table in .csv format.
Recovered sediment in Hole U1431D is dominated by varied cycles of turbidites. The recovered sections in Hole U1431E are composed of lithified volcaniclastic breccia interbedded with sandstone, siltstone, and claystone (see Lithostratigraphy). Calcareous nannofossil abundances are low in most of the upper part of the succession (Cores 349-U1431D-1H through 9H), generally becoming more abundant below Sample 349-U1431D-10H-CC (89.01 mbsf), but with intermittent low abundances to the bottom of Hole U1431D. In Hole U1431E, nannofossils are rare and poorly preserved in lithified claystone but are generally absent in volcaniclastic breccia or sandstone layers. Most samples exhibit some degree of reworking; this is more pronounced in the interval between 90 and 110 mbsf in Hole U1431D. Varying degrees of overgrowth on nannofossils as well as abundant broken fragments, especially among discoasters, are common in the sediment sequences of Hole U1431E (Figure F25). In general, the nannofossil assemblages preserved in sediment at Site U1431 are variably affected by turbidites and carbonate dissolution.
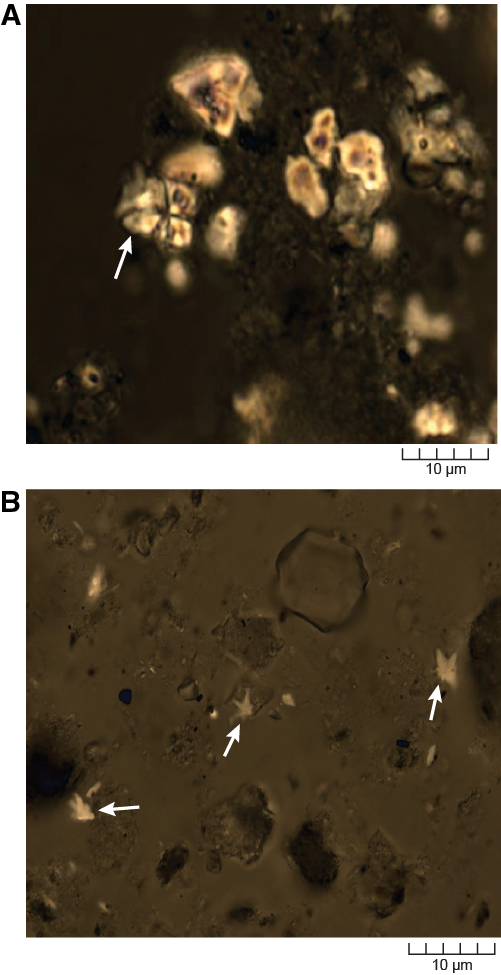
Figure F25. Calcareous nannofossils.
Twenty-nine nannofossil biostratigraphic datums are recognized in the middle Miocene to Pleistocene sediment sequence at Site U1431 (Table T2; Figure F24). The oldest nannofossil event identified is the first appearance datum (FAD) of Reticulofenestra pseudoumbilicus, which occurs at 884.60 mbsf, indicating an age <12.83 Ma for much of the sedimentary sequence at Site U1431.
Pleistocene
The top of Hole U1431D (Sample 349-U1431D-1H-CC; 3.15 mbsf) is dated as Late Pleistocene, based on the presence of Emiliania huxleyi (marker species for Zone NN21). Recognition of the last appearance datum (LAD) of Pseudoemiliania lacunosa in Sample 2H-CC (12.15 mbsf) defines the top of Zone NN19. Zone NN19 is further divided by six nannofossil events (Table T2):
- The LAD of Gephyrocapsa sp. 3 in Sample 4H-CC (32.08 mbsf)
- The FAD of Gephyrocapsa sp. 3 in Sample 5H-6, 47 cm (39.67 mbsf);
- The FAD of medium Gephyrocapsa spp. (>4 µm) in Sample 6H-CC (50.9 mbsf);
- The LAD of large Gephyrocapsa spp. (>5.5 µm) in Sample 8H-1, 50 cm (60.7 mbsf);
- The LAD of Calcidiscus macintyrei in Sample 10H-CC (89.01 mbsf); and
- The FAD of large Gephyrocapsa spp. (>5.5 µm) in Sample 11H-CC (96.10 mbsf).
The top of Zone NN18 is marked by the LAD of Discoaster brouweri in Sample 12H-CC (107.57 mbsf). The LAD of Discoaster pentaradiatus defines the top of Zone NN17; however, this event could not be identified because of reworking. This species occurs abundantly as reworked fossils in samples from Cores 349-U1431D-10H through 13H (89.01–116.85 mbsf) in the upper part of Hole U1431D, where younger age-diagnostic fossils are present (e.g., Gephyrocapsa spp. [>5.5 µm] and Discoaster triradiatus). This makes it difficult to recognize Zone NN18 based on core catcher samples. The top of Zone NN16 is defined based on the LAD of Discoaster surculus, which occurs in Sample 15H-CC (135.20 mbsf).
Pliocene
Nannofossil Zones NN16–NN12 are recognized in the Pliocene section of Hole U1431D (Table T2). Two events occur in the lower part of Zone NN16: the LAD of Discoaster tamalis (2.8 Ma) and the LAD of Sphenolithus spp. (3.54 Ma) in Samples 349-U1431D-18H-4, 60–61 cm (157.4 mbsf), and 21X-CC (188.3 mbsf), respectively. The Zone NN16/NN15 boundary occurs in Sample 24X-CC (217.07 mbsf), based on the LAD of R. pseudoumbilicus (3.70 Ma). The LAD of Amaurolithus tricorniculatus (~3.92 Ma) in Sample 27X-CC (245.87 mbsf) marks the top of Zone NN14. The LAD of Amaurolithus primus, which marks the top of Zone NN13 (4.5 Ma), occurs in Sample 29X-CC (265.21 mbsf). The FAD of Ceratolithus rugosus (5.12 Ma), found in Sample 31X-CC (284.6 mbsf), marks the top of Zone NN12. We could not identify the LAD of Triquetrorhabdulus rugosus within Zone NN12, as this species occurs sporadically and is frequently reworked in the upper part of the Pliocene sequences. The Miocene/Pliocene boundary in Hole U1431D is assigned between Samples 31X-CC (284.60 mbsf) and 33X-CC (298.56 mbsf), based on the FADs of C. rugosus (5.12 Ma) and Ceratolithus acutus (5.35 Ma), respectively.
Miocene
Ten events occur in the Miocene strata of Holes U1431D and U1431E (Table T2; Figure F24). The top of Zone NN11 is defined by the LAD of Discoaster quinqueramus (5.59 Ma); however, it is not possible to identify this event in Hole U1431D, as this species frequently occurs in Pliocene and uppermost Miocene sediment because of reworking. Four events within Zone NN11 were identified. The LAD (5.94 Ma) and FAD (6.91 Ma) of Nicklithus amplificus occur in Samples 349-U1431D-39X-CC (361.67 mbsf) and 58X-CC (527.31 mbsf), respectively. The FADs of A. primus and Amaurolithus spp. (7.42 Ma) are found in Sample 63X-CC (575.50 mbsf) in Hole U1431D and in Sample 349-U1431E-7R-1, 0–2 cm (603.32 mbsf). The FAD of Discoaster berggrenii (8.29 Ma) is found in Sample 349-U1431E-17R-7, 4–6 cm (707.40 mbsf). D. berggrenii occurs commonly in Sample 349-U1431D-66X-CC (604.81 mbsf), which is from the deepest core taken in Hole U1431D, suggesting an age of <8.29 Ma. This allows reliable biostratigraphic correlation between the deepest part of Hole U1431D and the uppermost section of Hole U1431E (Table T2).
Zones NN10–NN8 could not be reliably identified in samples from Cores 349-U1431E-18R through 24R (711.39–773.31 mbsf) due to poor preservation (Figure F25A) or the absence of nannofossils in several core catcher and split core samples. The FAD of Minylitha convallis is used to mark the base of Zone NN9 (9.75 Ma), but its occurrence in Sample 349-U1431E-20R-1, 102–103 cm (730.42 mbsf), may not represent its true FAD because several samples below this depth are barren of nannofossils. The LAD of Coccolithus miopelagicus (10.97 Ma) occurs in Sample 25R-1, 142–150 cm (779.32 mbsf), defining the top of Zone NN7. The last common appearance (LCA) of Discoaster kugleri (11.58 Ma) within Zone NN7 occurs in Sample 27R-9, 99–105 cm (807.28 mbsf). The top of Zone NN6 is marked by the first common appearance (FCA) of D. kugleri (11.9 Ma), found in Sample 33R-8, 0–5 cm (864.1 mbsf). The upper/middle Miocene boundary falls within Zone NN7, between these aforementioned datums (Gradstein et al., 2012). Two additional events within Zone NN6 are the FCA of Calcidiscus macintyrei (12.46 Ma) and the FAD of R. pseudoumbilicus (12.83 Ma). The FCA of C. macintyrei is found in Sample 34R-7, 0–5 cm (873.74 mbsf). The presence of R. pseudoumbilicus in Sample 349-U1431E-36R-1A, 7 cm (884.67 mbsf), at the base of lithostratigraphic Unit VII, indicates that the overlying sedimentary sequence in Hole U1431E is younger than 12.83 Ma.
A Paleocene nannofossil assemblage mainly composed of abundant Fasciculithus spp. and very rare Sphenolithus primus is found in Sample 349-U1431E-46R-4, 16–21 cm (976.62 mbsf), from the interflow claystone of lithostratigraphic Unit X. Species of Fasciculithus also occur sporadically in very low abundance in a few of the Miocene samples from Hole U1431E (e.g., Sample 349-U1431E-28R-CC; 815.62 mbsf) (Table T7). The occurrence of these species in these sections is attributed to reworking.
Planktonic foraminifers
All core catchers from Holes U1431A–U1431E were examined for planktonic foraminifers (Tables T8, T9, T10). In Holes U1431A–U1431C, planktonic foraminifers are well preserved and rare to common in abundance. The assemblage is dominated by dissolution-resistant tropical species, including Sphaeroidinella dehiscens, Globigerinoides sacculifer, Globorotalia tumida, and Pulleniatina obliquiloculata (Table T8). Their presence indicates a late Quaternary age for the sedimentary succession recovered in Holes U1431A–U1431C. In Hole U1431D, planktonic foraminifers are also well preserved and abundant through Core 349-U1431D-12H (107.57 mbsf) but decrease in abundance downhole, with moderate to poor preservation (Table T9). We distinguished in situ bioevents from reworked occurrences by relying more heavily on FADs rather than LADs. We also discounted bioevents that occurred out of order with the known biostratigraphic sequence. Because the lithology is dominated by turbidites (see Lithostratigraphy), the concurrence of several bioevents was most likely caused by redeposition rather than an indication of a hiatus. This filtering approach enabled us to locate 15 planktonic foraminiferal bioevents for the biostratigraphy of Hole U1431D (Table T3; Figure F24).
Table T8. Distribution of planktonic foraminifer species, Holes U1431A, U1431B, and U1431C. Download table in .csv format.
Table T9. Distribution of planktonic foraminifer species, Hole U1431D. Download table in .csv format.
Table T10. Distribution of planktonic foraminifer species, Hole U1431E. Download table in .csv format.
Our results indicate that the sediment sequence recovered in Hole U1431D spans the upper Miocene (Zone M13) through the Pleistocene (Zone Pt1b). The Pliocene/Pleistocene boundary lies between Samples 349-U1431D-13H-CC (116.5 mbsf) and 14H-CC (125 mbsf), as indicated by the FAD of Globorotalia truncatulinoides (2.58 Ma). The presence of Globorotalia multicamerata implies a Pliocene age for the interval between Samples 14H-CC and 31X-CC (125.45–284.60 mbsf). The boundary between the lower and upper Pliocene occurs in Sample 21X-CC (188.3 mbsf), as indicated by the LAD of Dentoglobigerina altispira (3.47 Ma), but differentiation of faunal Zones PL1–PL6 for the Pliocene is hampered by reworking of specimens due to the frequent occurrence of turbidites (see Lithostratigraphy). Although the Miocene/Pliocene boundary could not be determined due to the absence of diagnostic planktonic foraminifers, the abrupt occurrence of abundant warm-water species including G. multicamerata and Pulleniatina spp. in Sample 31X-CC (284.60 mbsf) implies deposition in the Pliocene. The upper Miocene includes Samples 40X-CC through 66X-CC (363.92–604.81 mbsf), with common Globigerinoides extremus and Neogloboquadrina acostaensis, but the Zone M13/M14 boundary could not be determined due to the absence of the zonal marker Globorotalia lenguaensis. From the base of Hole U1431D, Sample 66X-CC (604.8 mbsf) contains G. extremus, indicating an age younger than 8.93 Ma (late Miocene).
In Hole U1431E, we analyzed planktonic foraminifers in core catcher samples, as well as in samples from within selected cores. The abundance of planktonic foraminifers varies from absent to common, with poor preservation in samples from Cores 349-U1431E-7R through 33R (603.30–864.10 mbsf) (Table T10; Figure F26). Four bioevents distinguish Subzones M13b–M9b, indicating sediment deposition during the middle and late Miocene from ~13 to ~8 Ma (Table T3; Figure F24). Samples from lithostratigraphic Unit VI in Cores 7R through 12R are assigned to Miocene Subzone M13b through Zone M12 based on the presence of Globigerinoides obliquus, Globoturborotalita nepenthes, and N. acostaensis and the absence of Globorotalia margaritae and Globigerinoides conglobatus. The Subzone M13a/Zone M12 boundary occurs between Samples 349-U1431E-12R-1, 134–135 cm (653.14 mbsf), and 12R-4, 51–53 cm (656.61 mbsf), based on the FAD of N. acostaensis (9.83 Ma). Zones M12–M9 could not be differentiated due to the absence of zonal markers. Several bioevents are useful for biostratigraphic division of the interval from Cores 349-U1431E-13R through 34R (670–873.7 mbsf). These include datums found in samples from Unit VII, including the FAD of G. obliquus (11.25 Ma) in Sample 27R-9, 99–105 cm (807.28 mbsf), indicating mid-Zone M11, and the FAD of Sphaeroidinellopsis subdehiscens (13.02 Ma) in Sample 33R-8, 89–94 cm (864.1 mbsf), indicating Subzone M9b (upper middle Miocene). Samples from Units VIII (dark olive-brown claystone) and X (yellowish brown claystone) are completely barren of planktonic foraminifers.
Figure F26. Planktonic foraminifers.
Radiolarians
The siliceous fraction of biogenic sediment from Site U1431 is dominated by radiolarians with minor proportions of diatoms and sponge spicules. Radiolarians were analyzed in all core catcher samples from Hole U1431D but are only abundant and well preserved in Samples 349-U1431D-1H-CC through 3H-CC (3.15–22.09 mbsf). The overall radiolarian assemblage is composed of a modern and diverse South China Sea fauna (i.e., Euchitonia furcata, Phorticium pylonium, Theocorythium trachelium, Anthocyrtidium ophirense, Ommatartus tetrathalmus tetrathalmus, Solenosphaera quadrata, and Tetrapyle octacantha) (Chen and Tan, 1997) (Table T11). The radiolarian stratigraphy spans Zones NR1–NR2 (Late Pleistocene). Sample 349-U1431D-1H-CC (3.15 mbsf) contains Late Pleistocene radiolarian Buccinosphaera invaginata, which is a marker for Zone NR1 (Table T4); however, it occurs in very low abundances because it is a relatively rare and delicate species (Bjørklund and Goll, 1979). Recognition of this species requires a well-preserved assemblage, which is often absent in drill cores (Knoll and Johnson, 1975).
Table T11. Distribution of radiolarian species, Hole U1431D. Download table in .csv format.
Radiolarians are rare and preservation is poor in Samples 349-U1431D-4H-CC and 5H-CC (32.08–41.47 mbsf). Although the radiolarian assemblage represents a Pleistocene–Holocene sequence that corresponds to lithostratigraphic Unit I, the absence of any age-diagnostic species makes it impossible to assign the section to any biostratigraphic zone. Below Sample 5H-CC (41.47 mbsf) in Hole U1431D, samples are barren of radiolarians and diatoms and have high amounts of coarse siliciclastic sand and variable proportions of volcanic ash.
We analyzed radiolarians in core catchers and in samples from selected cores in Hole U1431E (Table T12). Radiolarians are barren in most of the samples from Cores 349-U1431E-7R through 33R (603.30–864.10 mbsf). Sample 349-U1431E-17R-7, 4–6 cm (707.40 mbsf), contains some radiolarians, but they are poorly preserved and recrystallized, and species identification was not possible. In Samples 34R-7, 25–32 cm (873.74 mbsf), 35R-6, 102–108 cm (882.54 mbsf), 36R-5, 12–16 cm (889.83 mbsf), and 45R-4, 21–23 cm (966.3 mbsf), radiolarians are more frequent but also show heavy dissolution, making them difficult to identify in the light microscope (Figure F27A). Therefore, radiolarians were picked from the 63 µm size fraction and prepared for observation using a scanning electron microscope (Figures F27B, F27C). Samples 45R-1, 49–51 cm, through 45R-4, 21–23 cm (962.79–966.28 mbsf), from Unit X are assigned to Zone RN4 (17.59–16.73 Ma; early Miocene) based on the presence of Didymocyrtis prismatica and Calocycletta costata (Sanfilippo and Nigrini, 1998) (Figure F28), providing age control for the bottom of the sedimentary sequence (Unit X) of Hole U1431E (Table T4; Figure F24).
Table T12. Distribution of radiolarian species, Hole U1431E. Download table in .csv format.
Figure F27. Broken radiolarian specimens.
Figure F28. Radiolarians.
Igneous petrology and alteration
We cored 118.01 m into igneous basement below 889.88 mbsf in Hole U1431E and recovered 46.7 m of basalt (43% recovery). The basement succession was divided into 13 igneous lithologic units, which were then grouped into two lithostratigraphic units (Units IX and XI) separated by a hemipelagic yellowish brown claystone at least 3.7 m thick (Unit X; Figure F29). Both basement units comprise massive basalt lava flows with limited evidence for pillow basalt fragments on top of these flows. The igneous basement is overlain by another hemipelagic dark olive-brown claystone (Unit VIII) that grades upward into a 282 m thick volcaniclastic series (Units VII and VI). These volcaniclastic clay-, silt-, and sandstones and breccias are interpreted to form part of the sedimentary apron of one or more seamounts in the vicinity and contain abundant volcanic glass fragments, scoria, basalt clasts, and fewer mudstone clasts, as well as crystal fragments of plagioclase, olivine, clinopyroxene, and biotite.

Figure F29. Igneous lithostratigraphic summary.
The uppermost igneous basement begins with a sequence of mostly fine-grained aphyric basalt, followed downhole by a series of massive basalt lava flows as thick as ~26.7 m with thinner (rubbly) basalt, interpreted as pillow lava, at their tops. Most basaltic cores at Site U1431 are aphyric and range in grain size from microcrystalline to fine grained, with a few medium- to coarse-grained basalts occurring in the interiors of the thickest massive lava flows. All basalts have a phase assemblage of plagioclase and clinopyroxene (±olivine) in their groundmass, with subhedral to euhedral olivine (0.1–1.0 mm in size) present in some lithologic units as microphenocrysts. This resembles a typical mid-ocean-ridge basalt (MORB) crystallization assemblage, and in conjunction with geochemical evidence, we conclude that the basement basalt at Site U1431 is typical MORB (see Geochemistry). Alteration is also typical of that of MORB. The basalt ranges from mostly fresh to completely altered and from gray to dark gray-green and yellow to red-brown in color. Alteration color is predominately yellow to brown, especially when altered olivine is present. Typical secondary minerals include saponite, Fe oxides, carbonate, and celadonite, which represent low-temperature alteration assemblages.
Basaltic clasts in volcaniclastic Units VI and VII
Lithostratigraphic Units VI and VII represent an overall series of greenish black volcaniclastic breccia with sand- and claystone interbeds in the upper part (Figure F30A) and dark greenish gray sand-, silt-, and claystone in the lower part (Figure F30B). These units contain numerous well-preserved high-energy volcaniclastic sandy turbidites (Figure F30C) and can be interpreted to represent a seamount apron series (see Lithostratigraphy). Although calcareous components such as foraminifers, black to gray mudstone clasts, and interbedded micritic carbonate beds are present in the top of Unit VI, these components disappear toward the bottom and are absent in Unit VII. All volcaniclastic breccias and sandstones are heterolithic and contain as many as four basaltic clast types, as well as many (large) broken pieces of primary volcanic crystal phases containing mainly plagioclase but also clinopyroxene, olivine, and biotite. In Unit VI, most breccias are matrix supported, grading to clast supported toward the bottom of the sequence in Unit VII. The packing of the clasts in the breccias makes their identification often difficult. In this section, we describe the basaltic clasts and the crystal fragments within these volcaniclastic units based on their appearance in hand specimen and under the petrographic microscope. Each major basalt clast type and crystal fragment type (Figure F31) is described below from highest to lowest abundance in the section.
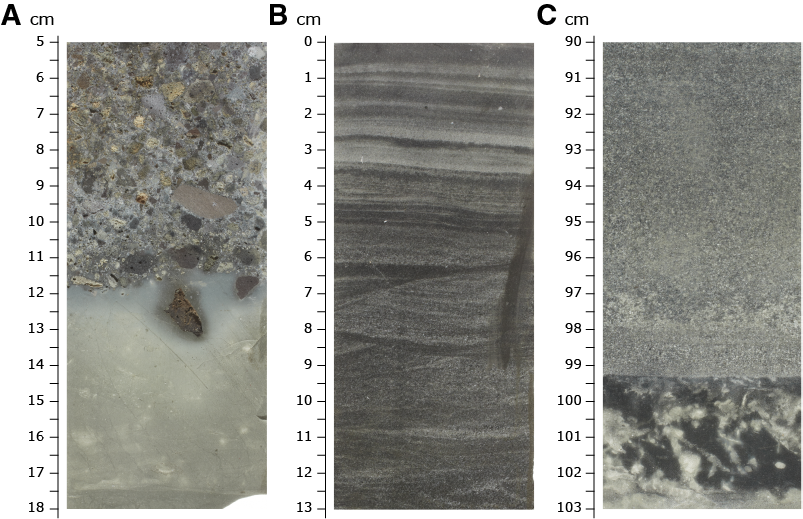
Figure F30. Volcaniclastic rocks.
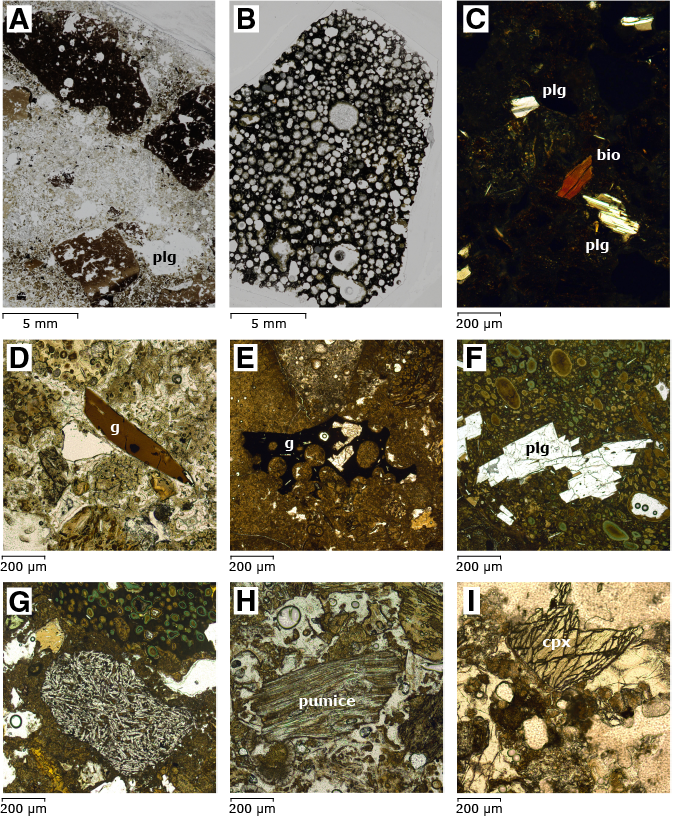
Figure F31. Clast types and crystal fragments.
Type 1: nonvesicular to sparsely vesicular aphyric basalt
These clasts are angular to subangular, range in size up to 2 cm, are greenish gray to dark gray, have microcrystalline to glassy groundmass with traces of feldspar laths, and have few, typically unfilled, vesicles (Figure F31A). In many of the volcaniclastic breccias and sandstones, this clast type appears to be most common in the finer grain size fraction (Figure F31D), even though their identification is difficult because clasts smaller than 2 mm could also be glass shards broken off from the Type 2 highly vesicular aphyric basalt clasts and scoria.
Type 2: highly vesicular aphyric to plagioclase-phyric basalt
These highly vesicular clasts are often scoriaceous, with well-preserved volcanic glass (fragments) occasionally present (Figures F31B, F31E). The clasts are angular to subangular, have a large range in size to 8 cm, and are dark gray and brown-gray to sometimes reddish when oxidized. Some clasts contain plagioclase glomerocrysts from 0.2 to 1 mm in size (Figure F31F). All clasts are typically glassy but sometimes show microcrystalline groundmass and have vesicle abundances of 10%–50%. These clasts are moderately to completely altered, often with characteristic palagonite rims around vesicles, which often are only partially filled with various alteration minerals.
Type 3: plagioclase crystal fragments
Throughout lithostratigraphic Units VI and VII, from 1% to 3% plagioclase fragments, up to 20 mm in size, are present (Figure F31C). These plagioclase fragments have generally sharp outlines. Often they retain spiky corners as a result of fragmentation and are overall unaltered. It is likely that these plagioclase fragments are the broken pieces of the larger Type 2 and 4 plagioclase-phyric clasts that occasionally are found in the cores but must have been abundant in the volcanic source(s) of these volcaniclastic units.
Type 4: trachytic basalt and highly plagioclase-phyric basalt
This minor clast type is not easily observed macroscopically in the archive-half sections; however, it occurs frequently in thin sections (Figure F31G). The clasts are angular to subangular, small (up to 1 cm), light gray to dark gray often with a pinkish/brownish tint, and have fine-grained holocrystalline groundmass littered with many plagioclase laths. Some of the clasts are highly plagioclase-phyric with euhedral to subhedral phenocrysts up to 20 mm in size. These clasts are typically nonvesicular and slightly to moderately altered.
Type 5: pumice
This rare clast type is apparent because of its (dirty) white to light gray color and high vesicularity, often with stretched vesicles that make it appear fibrous in the archive halves. These clasts are soft to the saw blade. They are angular to subangular, up to 1 cm in size, and are moderately to highly altered. In thin section, this clast type is distinguished by its highly laminated or banded nature (Figure F31H).
Type 6: biotite, clinopyroxene, and olivine crystal fragments
Although plagioclase dominates the crystal fragments in Units VI and VII, flakes of well-preserved biotite (Figure F31C) and crystal fragments of relatively unaltered clinopyroxene and olivine (Figure F31I) occur in many thin sections. The combined presence of plagioclase, clinopyroxene, olivine, biotite, and trachytic basalt points to an intraplate volcanic source, potentially the neighboring seamounts near Site U1431.
Lithostratigraphic and igneous lithologic units
Unit IX (889.88–962.51 mbsf)
- Interval: 349-U1431E-36R-5, 17 cm, to 45R-1, 21 cm
- Depth: 889.88–962.51 mbsf
- Thickness: 72.63 m (26.67 m at 36.7% recovery)
- Lithology: massive basalt flows with possible pillow basalt interbeds
- Igneous lithologic units: 1–9
The base of the dark olive-brown hemipelagic claystone (lithostratigraphic Unit XIII) and the first appearance of aphyric to sparsely olivine-phyric basalt fragments at 12 cm in Section 349-U1431E-36R-5 mark the upper boundary of lithostratigraphic Unit IX at 889.88 mbsf. Throughout Unit IX, most basaltic cores are aphyric and nonvesicular in nature, with minor occurrences of olivine-microphyric basalt and one amygdaloidal basalt unit (Figure F32). Overall, the degree of crystallinity in the basalt is high and increases to holocrystalline in medium- to coarse-grained varieties (Figure F33).

Figure F32. Basement basalt.
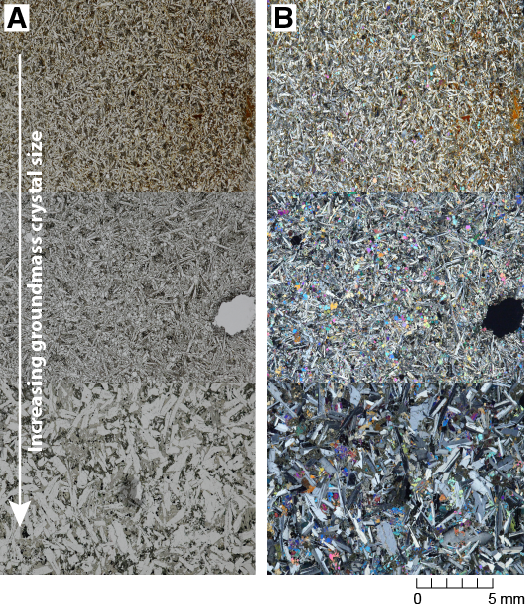
Figure F33. Increasing groundmass grain size.
Igneous lithologic Units 1–4 (3.8–14.2 m thick) are poorly recovered, and flow boundaries are inferred from the occurrence of chilled margins on separate pieces, with occasional thin glassy rinds preserved, at the tops of Sections 349-U1431E-38R-1, 40R-1, 40R-4, and 41R-1. These first four units comprise aphyric to sparsely olivine-phyric basalt with aphanitic to microcrystalline groundmass (Figure F32A) at the top of each unit, significantly coarsening in crystal size toward the cores of the thicker flows. These basalts are nonvesicular and fresh to moderately altered. Some units contain up to 10% fresh olivine microphenocrysts, as large as 0.5 mm, with distinctive equant habit (Figure F34A). Groundmass varies from cryptocrystalline intersertal in olivine-phyric basalts to intergranular, consisting of triangular networks of long-prismatic plagioclase sheaves with clinopyroxene growing interstitially, in some cases subophitically, with plagioclase (Figure F34B).
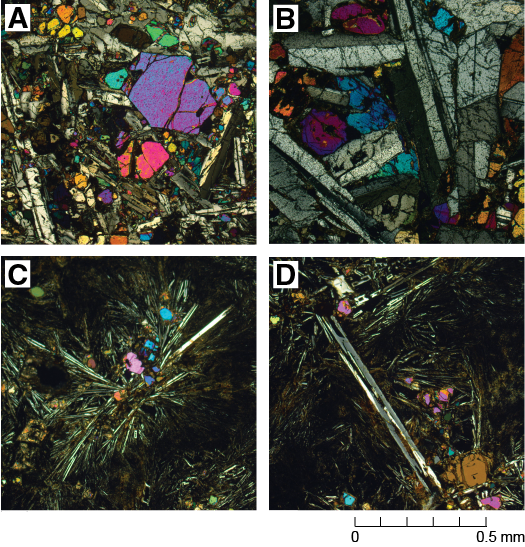
Figure F34. Basalt.
Igneous lithologic Unit 5 (2.4 m thick) is an amygdaloidal aphyric basalt with up to 15% rounded vesicles, also distinguished from other basaltic units by the absence of olivine microphenocrysts (Figure F32B). This unit has markedly variolitic textures with plagioclase laths or needles forming subradial aggregates around vesicles (Figures F35C, F35D). This is the most altered unit in the basement sequence based on the presence of abundant filled vesicles and veins.
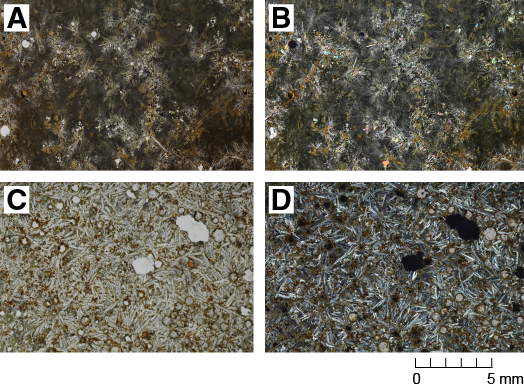
Figure F35. Variolitic textured basalt.
Igneous lithologic Unit 6 (26.7 m thick) is the thickest massive flow in Unit IX and, like Units 1–4, contains olivine microphenocrysts and is once again largely nonvesicular (Figure F32C). Grain size varies from microcrystalline to coarse grained in the core (Figure F33) of this massive flow, with the coarsest observed grain sizes in Section 349-U1431E-43R-3.
Igneous lithologic Units 7–9 include a thin basalt unit (Unit 7) of only 0.4 m thickness, which has a well-preserved ropy flow-top surface (Figure F36) with a (planar) chilled margin (<1 cm), probably indicating eruption on the seafloor in the form of a sheet lava flow. In addition, a single piece of hyaloclastite breccia was encountered in Unit 8 that is the best evidence of pillow basalt forming between the massive lava flows, where recovery typically was minimal. This breccia has well-preserved angular glass fragments up to 2 cm in size with distinctive yellow to brown palagonite rims and is set in a white carbonate matrix (Figure F37). The hemipelagic yellowish-brown claystone that follows at the base of Unit IX contains basaltic clasts up to 5 cm in diameter of similar lithology (Figure F20).
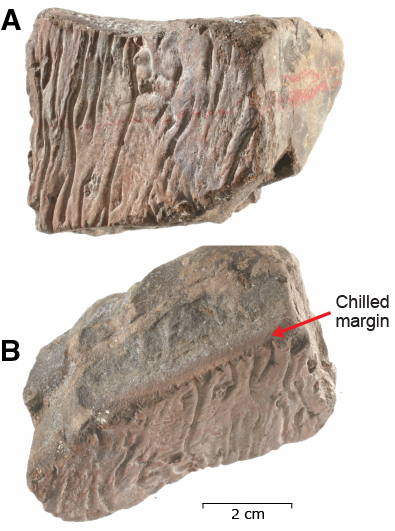
Figure F36. Ropy flow top.
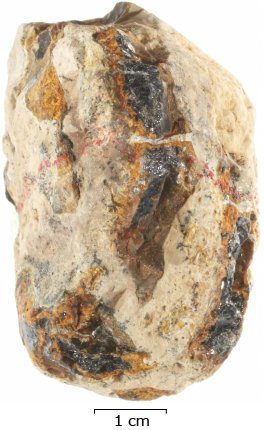
Figure F37. Hyaloclastite breccia.
Unit XI (972.00–1007.89 mbsf)
- Interval: 349-U1431E-46R-1, 0 cm, to 50R-6, 20 cm
- Depth: 972.00–1007.89 mbsf
- Thickness: 35.89 m (20.00 m at 55.7% recovery)
- Lithology: massive basalt flows with possible pillow basalt interbeds
- Igneous lithologic units: 10–13
The base of the yellowish brown hemipelagic claystone (Unit X) and the first appearance of aphyric to sparsely olivine-phyric basalt fragments at the top of Section 349-U1431E-46R-1 are taken as the upper boundary of lithostratigraphic Unit XI at 972.00 mbsf. Unit XI is very similar in character to Unit IX and is composed of two thick, fine- to medium-grained aphyric massive flow units that alternate with two thinner (possibly pillow basalt) flow units. In a similar fashion, the degree of crystallinity in these basalts is high and increases to holocrystalline in medium- to coarse-grained varieties in the cores of the massive flows.
Igneous lithologic Unit 10 is a sparsely vesicular and olivine-phyric aphanitic basalt directly below the yellowish-brown claystone and shows some characteristic variolitic textures (Figures F34C, F34D F35A, F35B). Only ~1 m of core, comprising 17 loose basalt pieces, was recovered.
Igneous lithologic Unit 11 is an amygdaloidal aphyric basalt flow (8.6 m thick) that contains up to 10% vesicles, often completely filled with green clays and/or carbonate minerals. This amygdaloidal basalt resembles Unit 5 in lithostratigraphic Unit IX, as it does not contain olivine as part of its phase assemblage and ranges in grain size from fine to medium grained from top to bottom. Igneous lithologic Unit 12 is a thin, 42 cm thick interval of aphyric basalt to sparsely olivine-phyric basalt with one piece showing a thin (<0.5 cm) chilled margin. Igneous lithologic Unit 13 is a fine- to medium-grained massive basalt flow very similar in texture and mineralogy to Unit 6 in lithostratigraphic Unit IX. The basalts are nonvesicular and generally fresh to moderately altered and contain many very small (up to 0.5 mm in size) fresh olivine microcrysts. These equant euhedral olivines are typically dwarfed in size by groundmass plagioclase and clinopyroxene minerals that have grown into intricate crystal networks with long-prismatic habits and relatively large crystal sizes. Drilling at Site U1431 terminated at 1008.8 mbsf (with the base of the recovered section at 1007.89 mbsf) after coring 25.8 m into this last massive lava flow.
Interpretation of the igneous succession
The primary goal of Expedition 349 was to recover basement to help understand the opening history of the South China Sea. Site U1431 was positioned close to what is generally believed to be a relict spreading center in order to get an age estimate for the cessation of seafloor spreading in the East Subbasin. This site is also flanked by nearby seamounts. We recovered 46.7 m of basalt after penetrating 118.0 m into igneous basement at Site U1431 and identified 13 igneous lithologic units, all of which are consistent with MORB from a petrological point of view. Both lithostratigraphic Units IX and XI are devoid of seamount-derived volcanic products, but the thick sequence of overlying volcaniclastic rocks of Units VI and VII probably originated from intraplate volcanism, as is evidenced by plagioclase and biotite crystal fragments and high abundances of highly vesicular scoria, plagioclase-phyric and trachytic basalt clasts, and finer grained (fresh) volcanic glass shards (Figure F36). Site U1431 evidently penetrated the volcanic apron of nearby seamounts active during the middle to late Miocene (see Lithostratigraphy).
The recovered basement basalts all have phase assemblages of plagioclase and clinopyroxene and, in some cases, olivine (typically as microphenocrysts). We used these different crystallization histories, as identified in thin section, as well as textural features, such as the presence of glassy (curved) chilled margins and a single occurrence of a hyaloclastite breccia, to define a total of 13 eruptive units (Figure F29). Eruption at Site U1431 temporarily halted with the deposition of the hemipelagic claystone of Unit X. Only 3.7 m of this sediment was recovered, yet it may be as thick as 9.5 m if we take the top of Section 349-U1431E-46R-1 as its lower boundary. Unit X was deposited at ~17.6 to 16.7 Ma based on the occurrence of Miocene radiolarians (see Biostratigraphy); however, the duration of volcanic quiescence cannot be resolved at this time, and shore-based radiometric dating of the basement samples is required to help constrain the eruption history of the igneous basement at Site U1431.
Because no well-defined contacts were recovered during coring and recovery was moderate to poor, our boundary locations and unit thickness estimates are approximate, particularly in the interpretation of the pillow basalt units (igneous lithologic Units 1, 7–10, and 12) based on scarce evidence mentioned above. We presume here that low-recovery intervals could be characteristically composed of pillow basalt units that do not core very well. The wash Core 349-U1431E-48G, which was recovered after picking the drill bit up to above the sediment/basement interface at ~890 mbsf to allow all the debris collecting around the drill collars to fall in, contained several pillow basalt fragments, providing further evidence for the presence of pillow lavas in the basement. Downhole logging was not able to reach the basement section, so the igneous lithologic unit boundaries remain poorly defined (see Downhole measurements).
Alteration
Basement rocks at Site U1431 primarily have been subjected to alteration by interaction with seawater. Alteration intensity varies from slight to complete, whereby the majority of the recovered basement rocks are moderately altered, yet in many units we identified (substantial) intervals of only slight alteration. In these intervals, olivine crystals are remarkably unaltered, chilled margins often have well-preserved glassy rinds, and the sole hyaloclastite breccia sample recovered still contains fresh volcanic glass. However, compared to other (typically older) ocean crust basement sites (e.g., Ocean Drilling Program Holes 801C and 735B and Integrated Ocean Drilling Program Holes U1365A and U1368A) (Alt et al., 1992; Bach et al., 2001; Expedition 329 Scientists, 2011), the background alteration at Site U1431 seems relatively high. The alteration assemblage of secondary minerals of saponite, Fe oxides, carbonate, and celadonite indicate low-temperature alteration dominated by interaction of basalt with oxidizing seawater (Kurnosov et al., 2008). There is no systematic change in the alteration nature or color with depth that might indicate a transition from more oxidizing to reducing conditions. Based on macroscopic and thin section observations, the overall alteration style (Figures F38, F39) is characterized by the following categories:
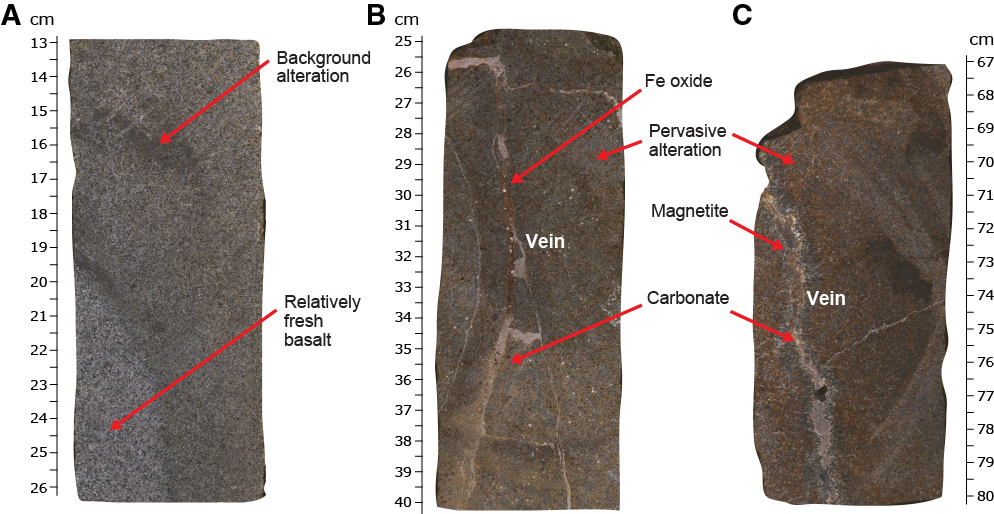
Figure F38. Alteration styles and veins.
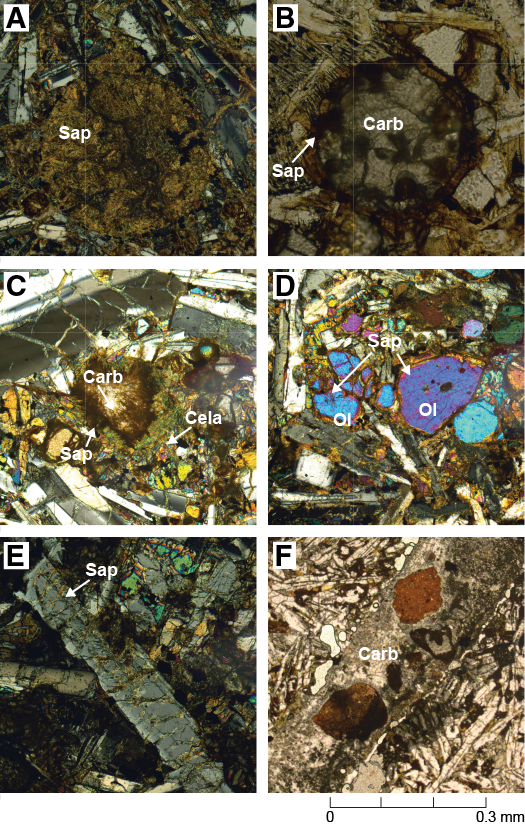
Figure F39. Basalt alteration.
- Background alteration with saponite and Fe oxide, occurring throughout the holocrystalline basalt groundmass and the less frequently observed mesostasis between the groundmass minerals, and (when present) olivine microphenocrysts;
- Alteration halos, typically associated with cracks and veins;
- Minor vein fillings by secondary minerals, mostly carbonate, Fe oxide, or both; and
- Partial to complete vesicle fillings by secondary minerals, typically carbonate and saponite, and less frequently celadonite.
Alteration phases
Alteration at this site includes mainly background and alteration halos. For both styles of alteration, oxidative alteration (dominated by Fe oxide and saponite) is the most widespread, whereas few parts of the core were altered at oxygen-starved conditions (dominated by saponite and celadonite). We distinguish four characteristic alteration minerals in Hole U1431E: saponite, Fe oxide, celadonite, and carbonate. Saponite is the most widespread alteration mineral at Site U1431 and, in macroscopic observation, its color ranges from yellow to orange to red-brown. Saponite is the major alteration mineral in the background alteration and in halos flanking the veins and filling the vesicles (Figure F39A). Formation of saponite results from alteration of olivine (when present) (Figure F39D) and groundmass mesostasis. Other clays have been recognized in thin section but are too fine grained to be positively identified.
Fe oxide is the second most abundant alteration mineral after saponite and occurs throughout the recovered cores. Fe oxide varies from yellow-brown to dark brown. The Fe oxide is often intermixed with saponite and is present in veins, vesicles, and halos. In addition, iron oxyhydroxide mixed with clay typically replaces olivine phenocrysts as iddingsite to form hyalophitic textures.
Celadonite is the third most abundant mineral in the background alteration, although it often is difficult to observe from macroscopic observation alone. Based on the available shipboard thin sections, celadonite is observed throughout Hole U1431E, especially in the background alteration. Celadonite is distinctively bright green, typically fills veins and vesicles, and replaces primary interstitial spaces in basaltic groundmass.
Carbonate appears throughout the recovered cores, mainly in vesicle and vein fillings (Figures F39B, F39C), typically replacing olivine (and plagioclase).
Finally, palagonite is present as a bright orange to red alteration product of volcanic glass, appearing in the chilled margins of pillow and sheet flow tops, as well in the volcanic glass clasts making up the singular hyaloclastite breccia (Figure F37) recovered in Hole U1431E.
Alteration of primary minerals
Olivine is the most strongly altered mineral throughout the basalt at Site U1431. It occurs as the only (micro)phenocrystic phase in the basement units and often is recognized by its pseudomorphic shape. Olivine is altered to some small extent even in the least altered basalts; entirely fresh olivine crystals are rare in Hole U1431E. Therefore, the replacement of olivine by various secondary mineral types ranges from minor to 100% based on thin section observation. Olivine usually is totally replaced by saponite, Fe oxide, carbonate, and celadonite. Clinopyroxene only occurs in the groundmass and often is replaced by saponite, other clays, and Fe oxide. Plagioclase is the most abundant mineral in the basement at Site U1431 and only occurs in the groundmass. It is the most resistant mineral to alteration, as fresh plagioclase is found in the most strongly altered basalt. Plagioclase typically is replaced by saponite, other clays, and Fe oxide, and its alteration intensity ranges from negligible to 50% based on thin section observation.
Pervasive background alteration
Most of the background alteration in basement Units IX and XI is pervasive, in the sense that it affects all lithologies and all cores (Figure F38), as opposed to the minor alteration that occurs in halos surrounding fractures and veins. Pervasive replacement of groundmass minerals and phenocrysts, such as plagioclase and olivine, occurs in the cores of every massive flow. It is characterized by formation of Fe oxide, saponite, and in some cases celadonite and represents the early stage of alteration caused by oxidizing seawater before the later stages of alteration by veining (Figures F38B, F38C). This background alteration is most obvious in the top of flow units, as in Cores 349-U1431E-37R through 40R in the upper massive flow series (Unit IX) and Core 47R in the lower series (Unit XI). Background alteration decreases toward the interiors of the recovered sheet and massive lava flows.
Vein fillings and alteration halos
Based on macroscopic observation of archive sections, we identified 131 veins in the 46.7 m of recovered basement basalt, with an average vein density of 2.8 veins per meter. Vein thickness varies from <0.1 to 4 mm, with an average thickness of 0.7 mm. Veins observed in the basement at Site U1431 exhibit curved, planar, irregular, and (complex) anastomosing shapes; they are isolated, branched, or form a network. Vein fillings have colors varying from white to red-brown and white-yellow to white-green. Vein fillings consist of celadonite, Fe oxide, carbonate, magnetite, and accessory minerals (Figures F38B, F38C, F39F). Veins are typically 40%–100% filled by secondary minerals. Most veins exhibit uniform infillings, whereas composite veins have more than one infilling mineral, typically in banded arrangement. Veins filled with carbonate are most abundant (88%), followed by veins filled with Fe oxide (17%) and/or celadonite (10%). Only one magnetite-filled vein was identified. The distribution of vein filling minerals (from the vein walls inward) indicates their formation sequence from saponite, Fe oxide, to carbonate, which is usually the last mineral to precipitate. In some cases, celadonite appears before the carbonate infilling. A minor number of veins (10%) have halos that vary in width from 0.5 to 3 cm. The observed alteration minerals in halos are similar to the pervasive background alteration phases, except that alteration intensity in those halos is generally higher.
Vesicle filling
Vesicles make up <1% of the recovered basement basalt in Hole U1431E, although a few individual basalt units have vesicle abundances up to 30% (igneous lithologic Units 5 and 11). Based on thin section observations, vesicle fillings range from none to 100% and can include saponite, Fe oxide, carbonate, and celadonite. The filling minerals and filling order are similar to those of veins: first Fe oxide, then saponite (or celadonite), and finally carbonate (Figure F39C). Saponite typically is the most abundant vesicle-filling mineral, followed by carbonate and Fe oxide, and then by rare celadonite.
Basalt glass alteration
Basalt glass was recovered from Cores 349-U1431E-36R, 38R, and 44R. When present, glass may be well preserved and fresh; when altered, it is totally replaced by palagonite and/or clay. Fresh fractions of basaltic glass vary from 10% in Core 349-U1431E-36R (~1.5 cm thick chilled margin) to 60%–70% in Cores 38R (~1.5 cm thick chilled margin) and 44R (~2 cm large hyaloclastite fragments).
Interpretation of alteration
Alteration of the basement basalt at Site U1431 in Units IX and XI is dominated by oxidative alteration, quite similar to the upper part of the ocean crust recovered in Holes 801C, 735B, U1365A, and U1368A (Alt et al., 1992; Bach et al., 2001; Expedition 329 Scientists, 2011). No mineral assemblage typical of high-temperature hydrothermal alteration occurs, indicating that principally low-temperature oxidative seawater interacted with basement at this site. Pervasive background alteration generally occurs near the top and bottom of (massive) lava flows, where fractures and veins are concentrated (see Structural geology). The strongest alteration occurs in halos surrounding those structures and merges into the background alteration, showing that the overall distribution of alteration was controlled by the location of fractures and veins. The observed sequence of vein and vesicle filling minerals shows the evolution of circulating fluids, which typically ends with the formation of carbonate. In only a few intervals, we encountered crosscutting veins, with a younger generation of Fe oxide veins cutting through older carbonate veins. This may indicate reopening of fractures, allowing later stage oxidative fluid flow, yet it remains unclear whether alteration at Site U1431 was continuous or episodic.
Structural geology
Site U1431 lies immediately north of the relict spreading ridge of the South China Sea. A north–south oriented seismic profile across this site shows a local depression with a volcanic seamount located to the south. Offsets on seismic reflectors reveal evidence for normal faulting structures on the north side of this depression (Figure F3). No obvious unconformity can be seen on the seismic profile, and the sediment sequence reflectors are generally horizontal and parallel to the seafloor.
Although five holes were cored at Site U1431, traces of deformation are only observed in the consolidated sediment and basement rock of Hole U1431E. We measured the dip orientation and dip angle of ~130 fractures and veins in Hole U1431E. The lithologies include claystone, siltstone, sandstone, and volcaniclastic breccia (lithostratigraphic Units VI and VII; see Lithostratigraphy), as well as basalt in Units IX and XI (see Igneous petrology and alteration). The structural information collected from these lithified rocks of Hole U1431E is relatively sparse.
Fractures
Most fractures are drilling induced, showing irregular fracture surfaces and densely distributed slickensides that are not expected in this tectonic setting. Natural fractures are quite rare and, when occurring, they often have neither offset nor striation on fracture surfaces. Fracture orientations in the basalt sequences (Units IX and XI) are randomly distributed (Figure F40), suggesting a lack of obvious extensional or compressional activities and that the fractures were formed mainly due to the cooling of hot magma or heterogeneous local stress perturbations. Some fractures reactivate along veins (Figure F41), making it difficult to tell if these reactivated fractures were caused by drilling or local stress perturbations. Most of the fractures identified in the claystone of Unit X, deposited between the igneous lithostratigraphic units (Units IX and XI), are similar to those in the basalt (i.e., showing neither offset nor striation). Only 1 fracture observed in Section 349-U1431E-45R-2 shows ~1 cm of normal offset (Figure F42). We hypothesize that these fractures are related to weak movement as magma flowed above the sedimentary sequence.
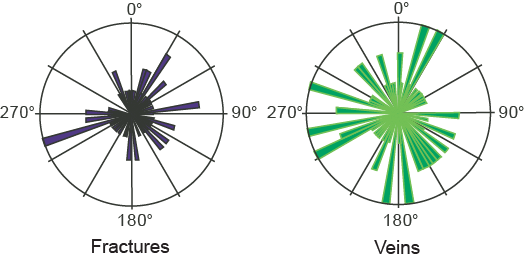
Figure F40. Structural feature orientation distribution.
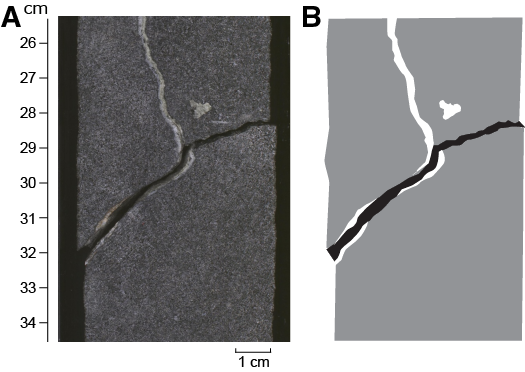
Figure F41. Infilled straight vein.
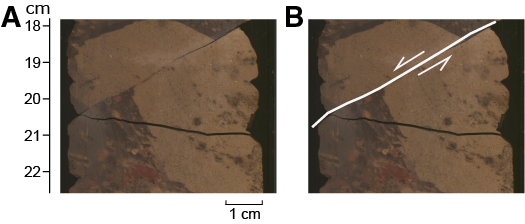
Figure F42. Offset fracture.
Veins
Alteration veins are ubiquitous, but together they are volumetrically insignificant. The veins generally may reflect later stages of cracking, fluid circulation, and fluid-rock reaction. The major veins are either white or red-brown and filled with carbonate and/or with Fe oxide. The vein orientations are also random (Figure F40B). In general, there are two main types of veins that differ in shape: straight veins with different widths (Figure F41) and curved veins. As shown in Figure F43, three subparallel curved veins of different thicknesses combine with several straight radiative veins to surround the fresh basalt in the center. They form a network with primary orientations consistent with fractures that formed during the magma cooling process. Cross-cutting between veins is seldom seen.

Figure F43. Curved and radiating vein network.
Geochemistry
Interstitial water chemistry
We collected 38 whole-round samples (5 cm long) for interstitial water measurements at an interval of 0.5 m from 0 to 20.4 mbsf in Hole U1431A. In addition, interstitial water was collected by Rhizon samplers at intervals between 5 and 50 cm to the base of Hole U1431A (0–28.4 mbsf). In Hole U1431D, we collected 23 whole-round interstitial water samples (5–10 cm long) in the APC section (0–168.9 mbsf) and 20 interstitial water samples (10–15 cm long) in the XCB section (168.9–556.1 mbsf) at a frequency of 1 sample per core. Hole U1431A cored the uppermost 28.4 m of sediment and is ~20 m away from Hole U1431D. Interstitial water chemistry profiles of whole-round samples from Holes U1431A and U1431D are shown in Figures F44, F45, F46, and F47. Interstitial water chemistry data are given in Tables T13 and T14.
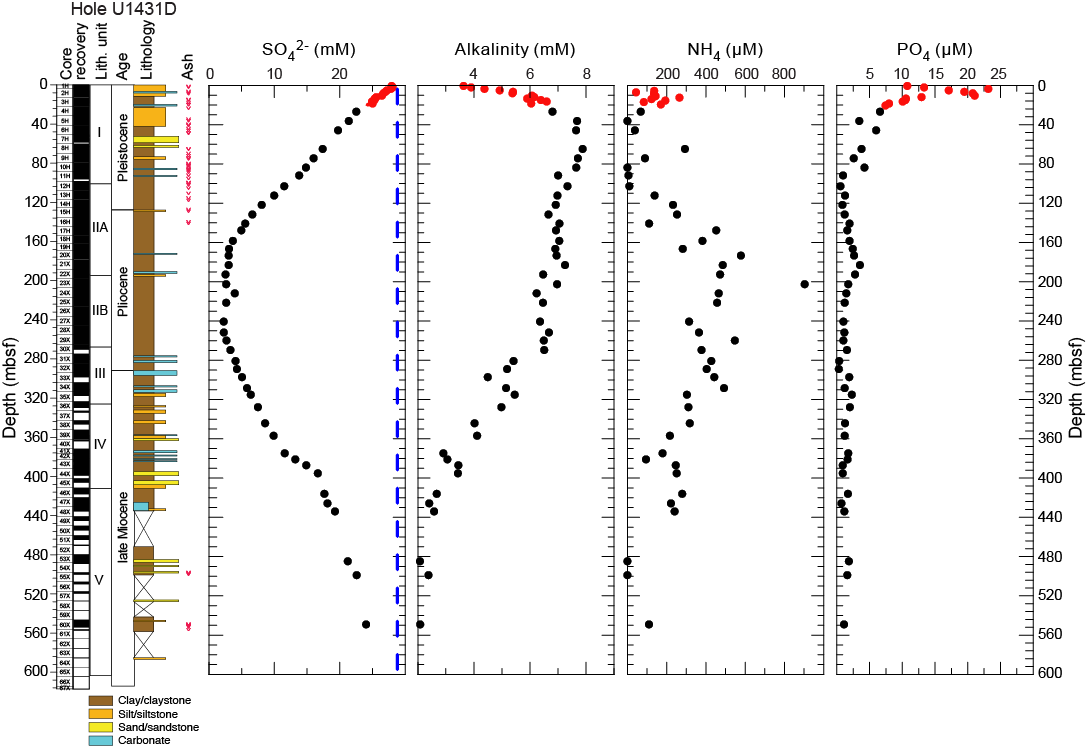
Figure F44. Sulfate, alkalinity, ammonium, and phosphorous.
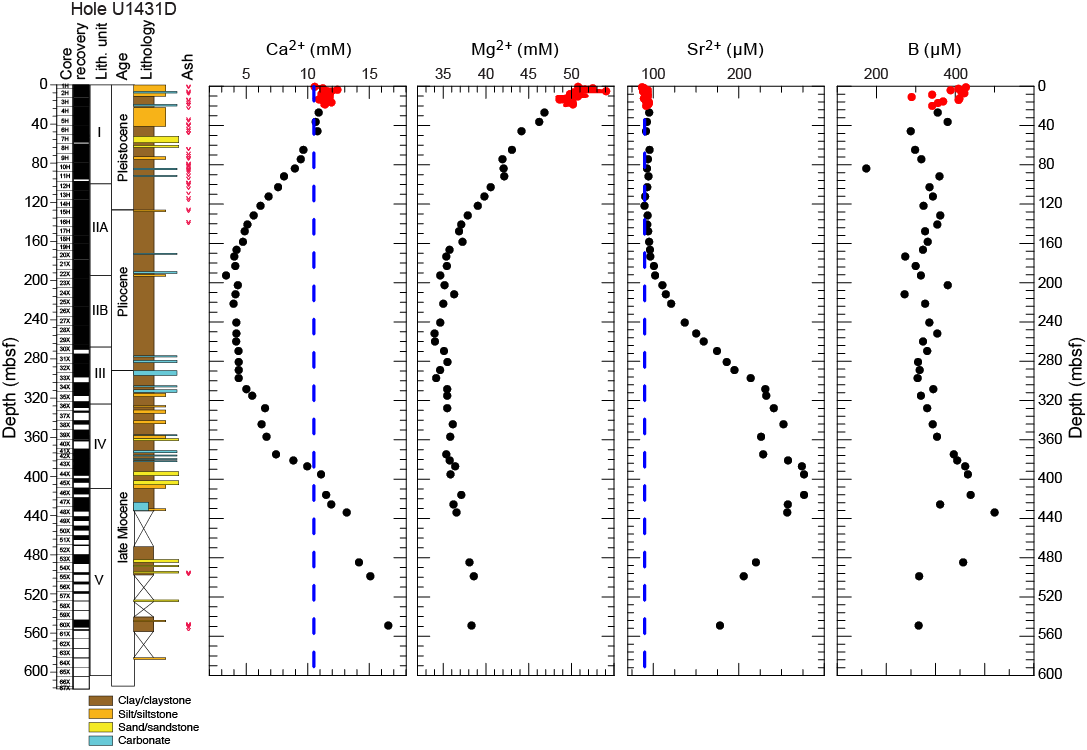
Figure F45. Calcium, magnesium, strontium, and boron.

Figure F46. Bromide, chloride, sodium, and potassium.
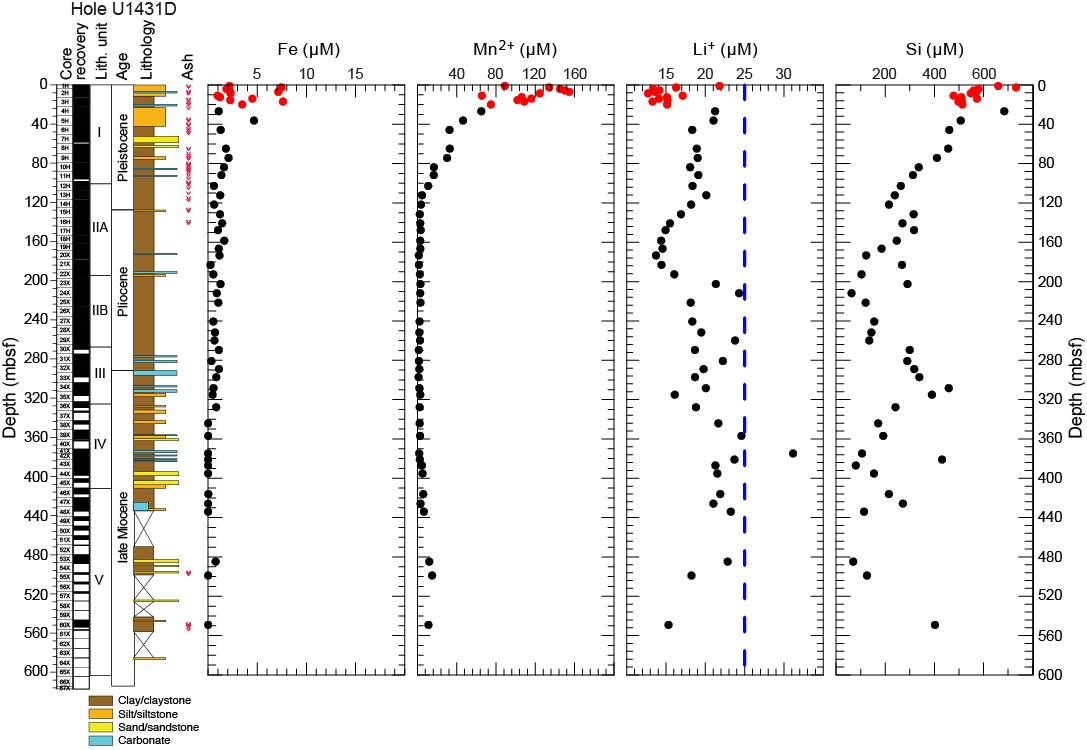
Figure F47. Iron, manganese, lithium, and silica.
Table T13. Interstitial water major element concentrations, ammonium, alkalinity, bromide, calcium, chlorine, magnesium, pH, phosphate, potassium, salinity, sodium, and sulfate, Holes U1431A and U1431D. Download table in .csv format.
Table T14. Interstitial water minor element concentrations, boron, barium, iron, lithium, manganese, strontium, and silica, Holes U1431A and U1431D. Download table in .csv format.
Sulfate, alkalinity, ammonium, and phosphate
The alkalinity and sulfate depth profiles are approximate mirror images of each other (Figure F44). The changes in the alkalinity and sulfate concentration are most likely caused by bacterially mediated organic matter diagenesis coupled with sulfate reduction according to the simplified reaction,
Alkalinity reaches a maximum value of 7.9 mM at 64.7 mbsf, and sulfate reaches a minimum value of 2.3 mM at 241 mbsf; however, low sulfate values of <3.0 mM occur from 166 to 260 mbsf. In this interval, ammonium reaches a maximum value of 903 µM at 203 mbsf, indicative of organic matter diagenesis in the sediment. Alkalinity decreases downhole, from its maximum value at 64.7 mbsf to a minimum value of ~2.2 mM, which is close to the modern seawater value (~2.3 mM), near the base of Hole U1431D. Both ammonium and phosphate follow a similar trend, decreasing to ~0 µM near the base of Hole U1431D. In contrast, sulfate concentrations gradually increase to 24 mM near the base of Hole U1431D, which is close to the modern seawater value (28.9 mM).
Potential source of unusual sulfate concentrations in Hole U1431D
The interstitial water contains significant amounts of sulfate (3.3–24.0 mM) from 260 to 549.11 mbsf (Figure F44; Table T13). It is worth noting that sulfate is not completely consumed throughout Hole U1431D, with minimum sulfate concentrations of ~2.3 mM occurring from 166 to 260 mbsf. The presence of high sulfate concentrations could be evidence for contamination of the interstitial water by drilling fluids. If so, the observed interstitial water sulfate concentrations suggest 13%‒88% contamination. The highest sulfate concentration in the interval from 260 to 549.11 mbsf was measured in Section 349-U1431D-60X-2. This sample was thoroughly cleaned by scraping prior to analysis, and intact, unfractured pieces were used for interstitial water extraction, so contamination is unlikely. Further evidence against contamination is that correcting for drilling fluid using the sulfate proxy results in negative magnesium and potassium concentrations for samples close to the bottom of Hole U1431D. Thus, no sulfate correction is applied, and the presence of dissolved sulfate is interpreted as evidence for sulfate-bearing fluid. Shore-based isotopic analyses of the interstitial water samples will help to constrain the source of the sulfate-bearing fluid in Hole U1431D.
Calcium, magnesium, and strontium
Downhole distributions of Ca2+, Mg 2+, and Sr2+ are shown in Figure F45. Calcium concentrations are slightly higher than that of modern seawater (10.5 mM), ranging from 10.5 to 12.4 mM in the uppermost 46 m. Values then decrease to a minimum of 3.4 mM at 193 mbsf, before increasing downhole to 16.6 mM at 549 mbsf. Changes in calcium concentration are mostly caused by carbonate diagenesis (i.e., dissolution and recrystallization of biogenic carbonate). Magnesium concentrations are lower than the modern seawater value (54 mM) throughout Hole U1341D, decreasing from 51 mM close to the seafloor to 35 mM at 193 mbsf. Magnesium concentrations then fluctuate around 35 mM from 190 to 310 mbsf before increasing slightly to 38 mM near the bottom of the hole. Magnesium behaves differently from calcium, possibly due to diagenetic reactions occurring in the sediment, such as clay ion exchange and low-temperature ash alteration, rather than carbonate diagenesis. Sr2+ concentrations are constant at ~90 µM (same as the value of modern seawater) in the uppermost 180 m and then steadily increase with depth to 276 µM (three times modern seawater value) at 420 mbsf before decreasing to 178 µM near the bottom of the hole. The highest Sr+ concentrations are within lithostratigraphic Units IV–V, which contain nannofossil ooze interbeds, indicating that the increased values are mostly caused by carbonate recrystallization.
Bromide, chloride, and alkalis (sodium and potassium)
Downhole profiles of chloride, bromide, sodium, and potassium in Hole U1431D are shown in Figure F46. Chloride concentrations fluctuate slightly with depth, ranging between 537 and 554 mM (slightly lower than the modern seawater value of 559 mM) throughout the hole. The sodium profile mimics that of chloride, with concentrations of 461–476 mM, which are slightly lower than the modern seawater value (480.7 mM). Bromide concentrations range from 0.82 to 0.89 mM. Concentrations slightly higher than that of modern seawater (0.87 mM) occur close to the seafloor and also in an interval from 80 to 160 mbsf. Below 160 mbsf, bromide concentrations decrease downhole with a minimum value of 0.82 mM at 499 mbsf. The bromide depth profile is mostly controlled by seawater diffusion and organic matter diagenesis in the sediment.
K+ concentrations are higher than that of modern seawater (10.5 mM) in the uppermost 50 m. This phenomenon has been observed at numerous sites such as Integrated Ocean Drilling Program Sites U1381 and U1414 and has been attributed to ion exchange with clay minerals (Expedition 334 Scientists, 2012; Harris et al., 2013). Below 50 mbsf, K+ concentrations decrease with depth from the seawater value of 10.5 mM to a minimum value of 4 mM at 360 mbsf. Below 400 mbsf, K+ concentrations increase from 5.5 to 8.4 mM near the bottom of the hole.
Barium, boron, lithium, silica, iron, and manganese
Downhole distributions of boron, iron, manganese, lithium, and silica are shown in Figures F45 and F47, and concentrations of these elements, plus barium, are given in Table T14. Barium concentrations are elevated with respect to modern seawater (0.032–0.15 µM), ranging from 0.35 to 9.9 µM. In the uppermost 160 mbsf, Ba2+ concentrations are relatively constant, ranging from 0.35 to 2 µM. Below 160 mbsf, Ba2+ concentrations increase with depth, reaching a maximum value of ~9.9 µM between 210 and 220 mbsf and then decrease to 0.52 µM near the bottom of the hole. High Ba2+ concentrations occur at 160–280 mbsf, which corresponds to the minimum sulfate interval. Ba2+ concentrations are likely controlled by the stability of the mineral barite (BaSO4). The Ba2+ increase may be the result of in situ barite dissolution due to sulfate reduction or the migration of Ba2+ in the low-sulfate fluid. Shore-based solid-phase barium analyses will be critical for determining the origin of the elevated barium and the history of fluid flow.
Boron concentrations vary from 170 to ~480 µM with a general decreasing trend with depth in the uppermost 80 mbsf. From 90 to 300 mbsf, boron concentrations vary slightly around 300 µM. Boron concentrations then increase from 310 to 500 µM over the interval from 320 to 440 mbsf, before decreasing with depth to 300 µM near the bottom of the hole.
In the uppermost 25 m, lithium concentrations range from 12 to 21.8 µM, lower than the modern seawater value (25 µM). Lithium concentrations then decrease from 21.2 µM at 27 mbsf to a minimum of 13.7 µM at 170 mbsf. Lithium concentrations in this interval are most likely controlled by secondary mineral precipitation and clay ion exchange reactions. Below 170 mbsf, lithium concentrations vary with depth and reach a maximum of 31.2 µM at 375 mbsf and then decrease with depth to 15.3 µM near the bottom of the hole.
The dissolved Si profile reflects lithology and silicate mineral diagenesis. In the upper 20 mbsf, silica concentrations range from 440 to 795 µM, much higher than the modern seawater value (0–180 µM). Below 30 mbsf, silica concentrations decrease to a minimum value of 62 µM at ~210 mbsf within an interval of dominantly clay-rich sediment. Silica concentrations increase with depth to ~460 µM at 320 mbsf and then vary significantly downhole, with values ranging from 80 to 400 µM near the bottom of the hole.
Dissolved iron concentrations range from 1.0 to 18.6 µM in the uppermost 20 mbsf. Below this, dissolved iron concentrations mostly vary between 0 and 2 µM with a maximum value of 4.7 µM at 36 mbsf.
Dissolved manganese concentrations increase slightly from 80 µM close to the seafloor to a maximum of 162 µM at 7.5 mbsf and then vary between 66 and 150 µM downhole to 20 mbsf. Below 20 mbsf, concentrations decrease with depth from 65 to 3.5 µM at 120 mbsf and then remain constant at ~2µM to 390 mbsf, before increasing to >10 µM near the bottom of the hole.
Headspace gas geochemistry
Headspace gas was monitored according to the standard protocol required for shipboard safety and pollution prevention. We analyzed 53 headspace gas samples from Holes U1431A and U1431D for hydrocarbon compositions (Figure F48; Table T15). No samples were taken from Hole U1431E because of the indurated nature of the rocks. Methane (C1) was the only hydrocarbon detected in Hole U1431A, ranging from 3 to 5 ppmv, all within background levels. Methane is also the predominant hydrocarbon present throughout Hole U1431D, varying from 1.75 to 4.81 ppmv. Ethane (C2) was observed only in Section 349-U1431D-44X-3 (395.2 mbsf), at 1.32 ppmv (Table T15).
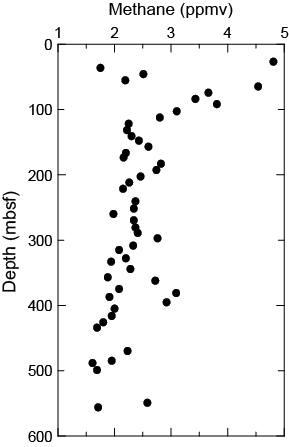
Figure F48. Headspace methane.
Table T15. Hydrocarbon concentrations of headspace gas, methane and ethane, Holes U1431A and U1431D. Download table in .csv format.
Sediment geochemistry
Total organic carbon and calcium carbonate
The distribution of total organic carbon (TOC), calcium carbonate (CaCO3), and the total organic carbon to total nitrogen ratio (C/N) at Site U1431 is illustrated in Figures F49 and F50 and listed in Table T16. Samples were selected to provide a measure of the carbon content in different lithologies. CaCO3 content varies from 2 to ~50 wt% with maximum values in foraminifer ooze beds within lithostratigraphic Unit III in Hole U1431D (Figure F49). TOC content varies from ~0 to 4.1 wt% (average ~0.5 wt%) in Holes U1431A and U1431D. TOC reaches a maximum of 4.1 wt% within lithostratigraphic Unit IV. C/N ratios are often used as an indicator of the origin of organic matter. C/N values in Holes U1431A and U1431D vary with depth, ranging from ~0 to 17. C/N ratios >5 suggest a mixture of marine and terrestrial sources for organic matter in sediment. Values >5 occur in the uppermost 10 mbsf and in some intervals in Units II–V.
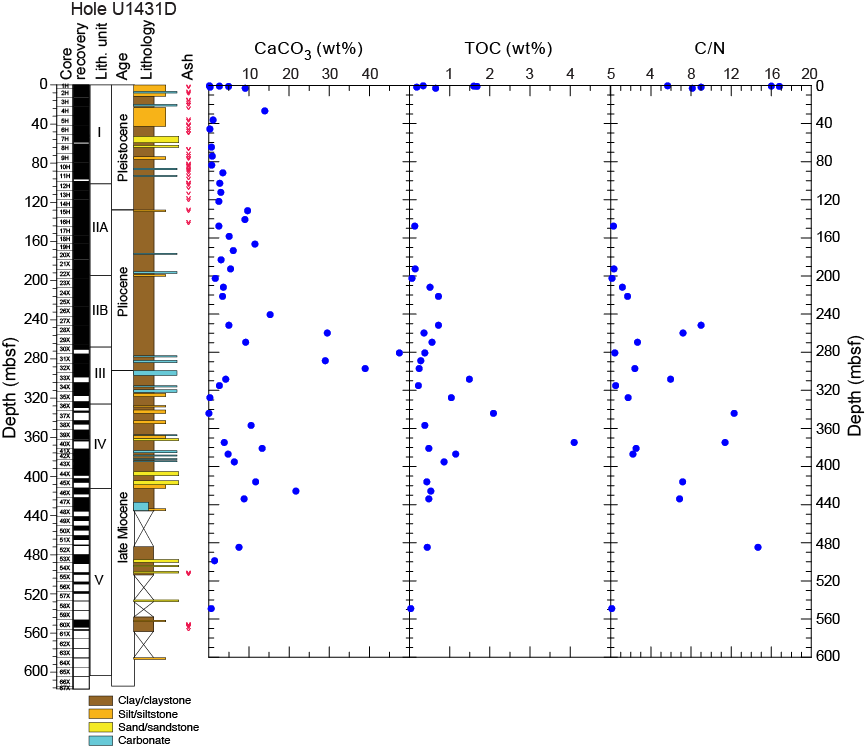
Figure F49. Calcium carbonate, TOC, and C/N ratios.

Figure F50. Calcium carbonate and TOC.
Table T16. Inorganic carbon, total carbon, TOC, carbonate, and total nitrogen concentrations and C/N ratios, Holes U1431A, U1431D, and U1431E. Download table in .csv format.
In Hole U1431E, CaCO3 content ranges between 0.1 and ~60 wt% (Figure F50). Although the carbonate profile shows a wide range of values, higher carbonate content typically corresponds to mudstone or sandstone horizons. TOC content varies from below the detection limit to ~0.7 wt%. Unit VII shows consistently low TOC content (<0.1 wt%), whereas a couple of higher values (0.6–0.7 wt%) occur near the top of Unit VI.
Major and minor elements in bulk sediment
We analyzed 23 sediment samples from Core 349-U1431D-2H through 53X for major and minor element concentrations by inductively coupled plasma–atomic emission spectroscopy (ICP-AES) (Figure F51; Table T17).
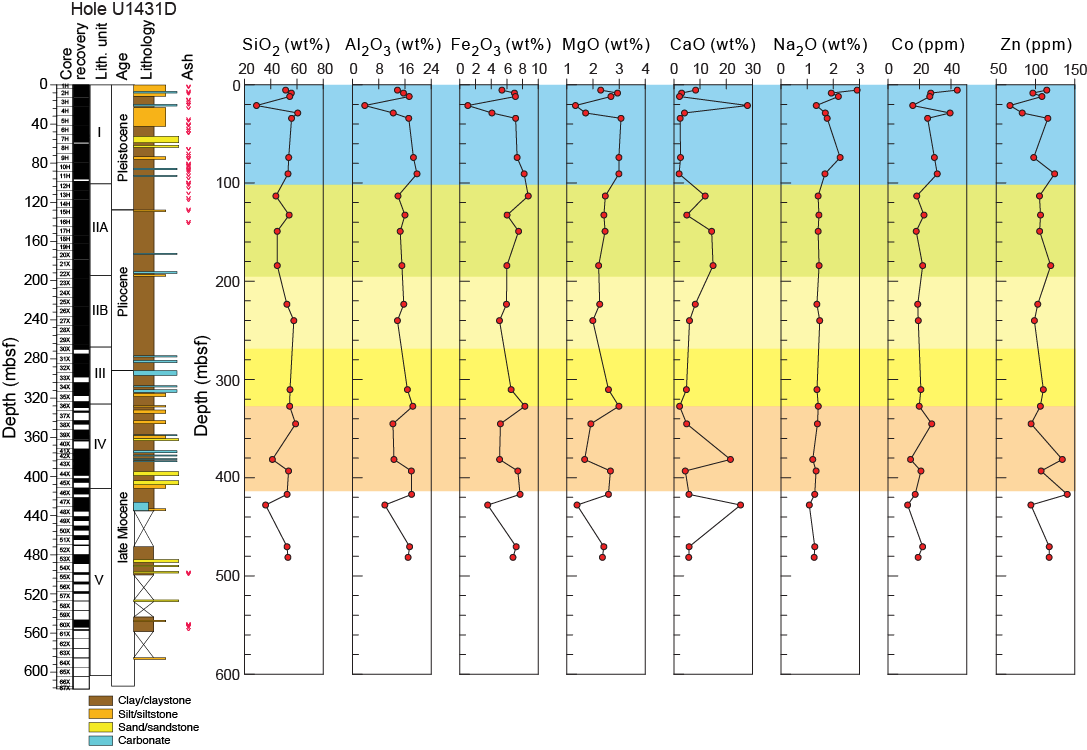
Figure F51. Bulk sediment major and minor elements.
Table T17. Major element oxide and trace element contents of sedimentary samples, Hole U1431D. Download table in .csv format.
Total weight percentages for the major element oxides vary from 66.19 to 91.85 wt%. Weight loss on ignition (LOI) values are generally high, ranging from 5.7 to 21.6 wt%. Samples from lithostratigraphic Unit I display the greatest variation in all measured elements, whereas samples from Subunit IIB and Unit III are nearly constant in element concentrations (Figure F51). Overall, Na2O and Co show a decrease with depth, whereas Zn remains nearly constant downhole except for some anomalies within Units I, IV, and V.
In the discriminant function diagram of Roser and Korsch (1988) that highlights the provenance signatures of sandstone-mudstone suites, Hole U1431D samples plot mostly within the field of intermediate igneous provenance (Figure F52).
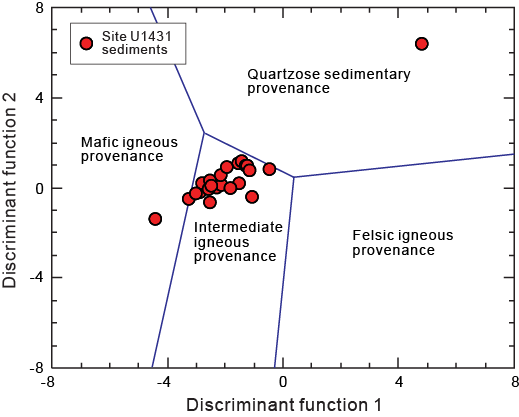
Figure F52. Sandstone-mudstone suite provenance.
Igneous rock geochemistry
Fifteen igneous rock samples from Core 349-U1431E-37R through 50R and 3 igneous clasts from volcaniclastic breccia samples within lithostratigraphic Unit VI of Hole U1431E were analyzed for concentrations of major and trace elements by ICP-AES (Table T18).
Table T18. Major element oxide and trace element contents of igneous rock samples and clasts from volcaniclastic breccia, Hole U1431E. Download table in .csv format.
Total weight percentages for the major element oxides vary from 97.5 to 105.5 wt%. LOI serves as a rough indicator of the overall level of alteration in these rocks. LOI values in the igneous samples are high as a whole, ranging from 0.46 to 2.85 wt%, with five samples higher than 2.0 wt%. Three breccia clast samples have much higher LOI (2.87–8.74 wt%) than the basement igneous samples. K2O in the igneous samples varies from below the detection limit to 0.53 wt%, but only one sample has a K2O value higher than 0.30 wt%. The igneous samples have variable SiO2 (44.0–51.9 wt%), Al2O3 (14.62–18.46 wt%), CaO (8.11–11.13 wt%), MgO (6.18–13.31 wt%), and Fe2O3 (8.93–12.52 wt%), whereas TiO2 (1.01–1.77 wt%) and Na2O (2.45–3.53 wt%) vary less. Three volcaniclastic breccia samples have much higher K2O (1.08–2.67 wt%) and TiO2 (2.10–3.13 wt%) than the igneous samples, although they have similar SiO2 contents.
When plotted on the alkali versus silica diagram for volcanic rock types (Le Maitre et al., 1989) (Figure F53), the three breccia clast samples are clearly alkaline and plot in the basanite, phonotephrite, and basaltic trachyandesite fields, whereas the igneous samples are tholeiitic and all plot in the basalt field. As shown in Figure F54, the igneous samples from basement are similar to Indian Ocean MORB and Pacific Ocean MORB but are distinct from the Hainan Island ocean island basalt (OIB) and the seamount basalts in the South China Sea. Thus, igneous basalt samples from lithostratigraphic Units IX and XI are tholeiitic basalt, representative of South China Sea MORB, whereas mafic igneous clasts in the volcaniclastic breccia of Unit VI are alkaline and likely sourced from the nearby seamounts.
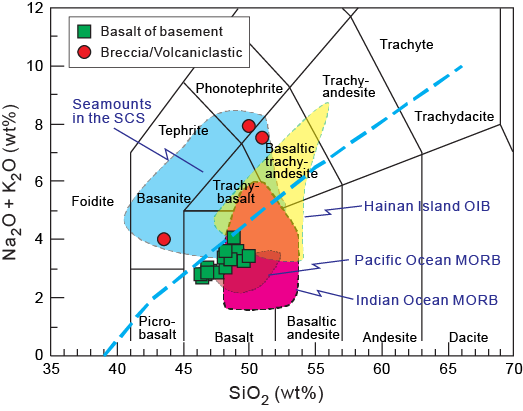
Figure F53. Total alkalis vs. silica.
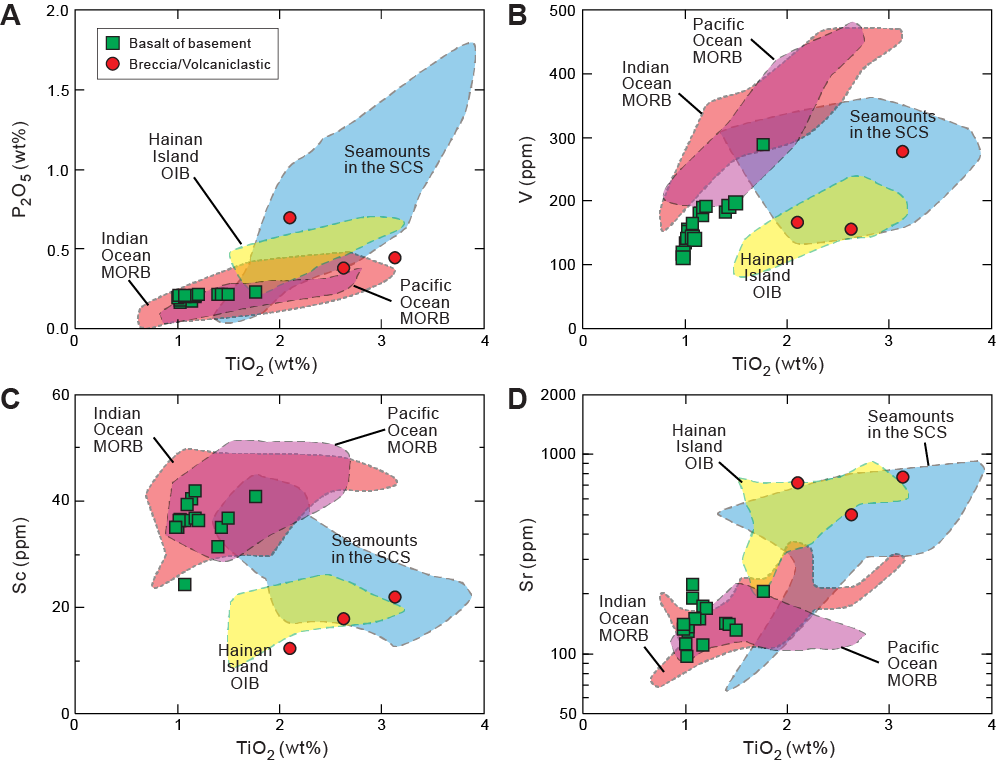
Figure F54. TiO2 vs. P2O5.
Microbiology
Our goal for microbiological research conducted at Site U1431 was to collect and preserve samples for shore-based characterization of the microbial communities. We collected samples on a routine basis throughout the cored intervals and on a case by case basis according to features in the cores that suggested the presence of important geological interfaces. We used a limited number of samples to start microbial cultivations aboard the ship. In addition, we also used a suite of contamination testing tracers including perfluorocarbons, microspheres, and fluid community tracers.
Specific depths sampled for microbiology at Site U1431 are shown in Figure F55. Coring at Site U1431 yielded 105 routine 5–10 cm whole-round samples to be used for microbiological analysis from the seafloor to 937 mbsf from Holes U1431B, U1431D, and U1431E. We acquired 29 whole-round samples from Hole U1431B (uppermost 17 m) and then, assuming ample core recovery, one whole-round sample per core in Holes U1431D (27–549 mbsf) and U1431E (604–937 mbsf). Whenever possible, we collected whole-round samples for microbiology adjacent to samples for interstitial water in order to understand proximal interstitial water chemistry.
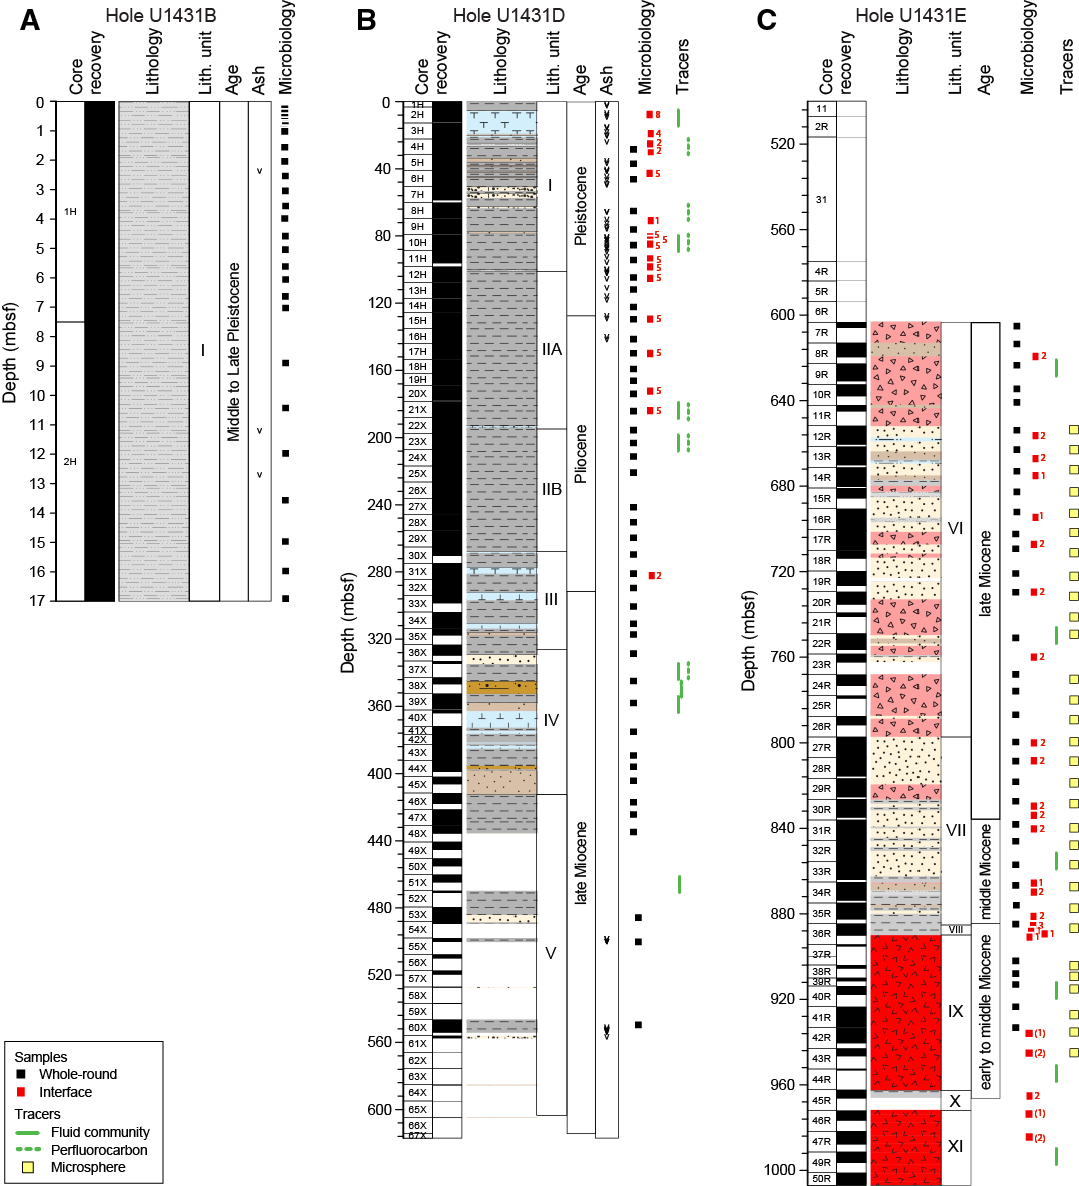
Figure F55. Microbiology and contamination testing samples.
We collected and preserved 76 samples for investigating the microbiology of interfaces using lipid and nucleic acid analyses. We obtained these samples mostly in the upper 200 m of Hole U1431D (Figure F55B). We sampled five ash/clay interfaces and 10 turbidite/clay interfaces. Five samples deeper than 200 mbsf were collected for interface sampling, the deepest at ~984 mbsf in Hole U1431E (Figure F55C). Fewer samples were collected at these deeper depths because of drilling-induced disturbance of the cores or the inability to easily collect interface samples because the core was indurated. We selected all interface samples depending on recognition of key intervals through consultation with shipboard sedimentologists or petrologists.
Microbiological analyses
Most of the samples collected at Site U1431 were preserved for shore-based analysis. Samples to be used for DNA and RNA extractions and sequencing were frozen at −80°C, and samples to be used for lipid extraction and analysis were frozen at −80°C. Subsamples of the whole-round samples were prepared for fluorescent in situ hybridization (67 subsamples preserved at −20°C) and single cell genomics (74 subsamples preserved at −80°C). Subsamples from four cores (349-U1431E-42R, 43R, 46R, and 47R) were selected for cultivation-based studies to enrich for iron-oxidizing microbes. We inoculated these samples into a seawater-based medium (described in Smith et al., 2011) containing olivine as a source of reduced iron. Minimal oxygen was provided, and the enrichments were incubated at room temperature in the dark. A negative control (olivine plus seawater-based medium but without core sample inoculation) was also prepared to screen for laboratory contaminants that may have been introduced during preparation of the enrichments.
Contamination testing
We used three different methods of contamination testing during coring of Holes U1431B, U1431D, and U1431E. The PFT perfluoromethylcyclohexane was introduced into the drilling fluid during coring of Hole U1431D from 0 to 197.7 mbsf to trace potential drilling fluid contamination of the cores (Figure F55B). PFT samples were acquired from three APC and three XCB cores while coring the upper sections of Hole U1431D. PFT results are ambiguous. In some cases (e.g., Section 349-U1431D-4H-7), PFT concentrations measured on samples from the outside of the core are higher than those measured on the inside of the core; however, in other situations the inside of the core has higher levels (e.g., as occurred with the sample from Section 349-U1431D-8H-7). Given the small number of samples collected for analysis, we cannot conclude how effective the PFTs are as a tracer for contamination.
Microsphere tracers were used with the RCB coring system in Hole U1431E by adding them to the core catcher sub before cutting Cores 349-U1431E-12R through 44R (651.8–962.3 mbsf; Figure F55C). Two microsphere samples were collected from each of these cores: one from scrapings of the core surface and one as a subsample from the interior of each whole-round sample. We used the Procedure for Curation of DeepBIOS (www.kochi-core.jp/DeepBIOS) to conduct preliminary counting of the microspheres on the ship, but final counts will be performed in shore-based laboratories.
Fourteen fluid community tracer (FCT) samples were collected from the drilling fluids to track the microbial communities typical of the seawater and other mud constituents (Figure F55). The FCTs were the most comprehensively sampled of the contamination testing tracers, as they were collected periodically throughout the coring of Holes U1431D and U1431E and correspond to cores obtained from depths between 5 and 1000 mbsf. Microbial community DNA and lipids from FCT samples will be compared to the same measurements made on the core samples to determine if the drilling fluids contain microbes that can be regularly tracked as recognizable contaminant taxa.
Paleomagnetism
At Site U1431, Cores 349-U1431A-1H through 3H and 349-U1431D-1H through 19H were cored with the APC using nonmagnetic core barrels. Cores 349-U1431D-20X through 67X were cored with the XCB using a standard cutting shoe. Cores in Hole U1431E were cored using the RCB. Cores 349-U1431D-1H through 19H were oriented with the FlexIT orientation tool. Paleomagnetic directions can be used to construct magnetostratigraphy for dating sediment. Orientation data (i.e., corrected declinations) facilitate the magnetostratigraphy investigation for Site U1431.
We made pass-through magnetometer measurements on all archive-half cores and on representative discrete samples taken from the working halves. In order to isolate the characteristic remanent magnetization (ChRM), sedimentary archive-half cores were demagnetized in an alternating field (AF) using 5, 10, 15, and 20 mT steps and then were measured with the pass-through superconducting rock magnetometer (SRM) at 2.5 cm intervals. Selected discrete samples were first AF demagnetized to 20 mT using the 2G SRM and then with an ASC Scientific D-2000 AF demagnetizer using 30, 40, 60, 80, and 100 mT steps. About 30 discrete samples were also subjected to stepwise thermal demagnetization up to 400°C with steps of 100°C, and then up to 600°C at 50°C steps. Remanence was measured using the SRM. We analyzed the results in Zijderveld diagrams (Zijderveld, 1967) and calculated the ChRM direction using principal component analysis (Kirschvink, 1980).
Natural remanent magnetization of sedimentary cores
To illustrate the overall demagnetization behavior, we show natural remanent magnetization (NRM) intensities and inclinations before and after 20 mT AF demagnetization for the recovered cores in Figure F56. Variations in NRM intensity are generally correlated with lithology. Paleomagnetic measurements indicate that the silty clay and clayey silt in lithostratigraphic Unit I (0–101.16 mbsf) have a mean NRM intensity on the order of 3 × 10⁻² A/m, whereas the clay with nannofossils in Unit II (101.16–267.82 mbsf) has higher NRM intensity (~6 × 10⁻² A/m). Many discrete peaks of higher NRM and magnetic susceptibility values (see Physical properties) in both Units I and II can be tied directly to the presence of volcanic tephra layers (see Lithostratigraphy). To the first order, this indicates that the magnetic moment is determined by the concentration of magnetic minerals.

Figure F56. Paleomagnetism.
As with many other ocean drilling expeditions, remagnetization imparted by the coring process was encountered at Site U1431. NRM inclinations are strongly biased toward vertical (mostly toward +90°) in a majority of cores. For the recovered sediment core sections, AF demagnetization to 10 mT seems to be effective in removing the drilling-induced overprinting magnetization for a high percentage of samples, as shown by inclinations shifted toward shallower values that are comparable to the expectation for the site (~±29°). Magnetization intensity also decreases by a factor of ~3–4 after 5 mT demagnetization and by an order of magnitude after 20 mT demagnetization (Figure F56). For many core sections from lithostratigraphic Units II–V, AF demagnetization up to 20 mT was not effective in recovering primary remanence magnetization. Inclinations shifted toward shallower values but are still steeper than the expected value for the site, indicating the near-vertical drilling-induced remagnetization was not completely removed (Figure F56C). Therefore, the paleomagnetic results for this interval (cored by XCB) were not used to construct the magnetostratigraphy for Site U1431 at this time. Detailed postcruise study should help remedy the magnetostratigraphy for this interval.
Demagnetization properties
NRM declinations of Cores 349-U1431D-1H through 19H before orientation correction deviate significantly from the expected values for this site. After orientation correction using data from the orientation tool, declinations become close to magnetic north for normal polarity cores and magnetic south for most cores with negative inclinations, indicating that the primary sources of magnetization are remanent magnetization (Figure F57). ChRM declinations can be used to determine the orientation of deeper cores (see Magnetostratigraphy).
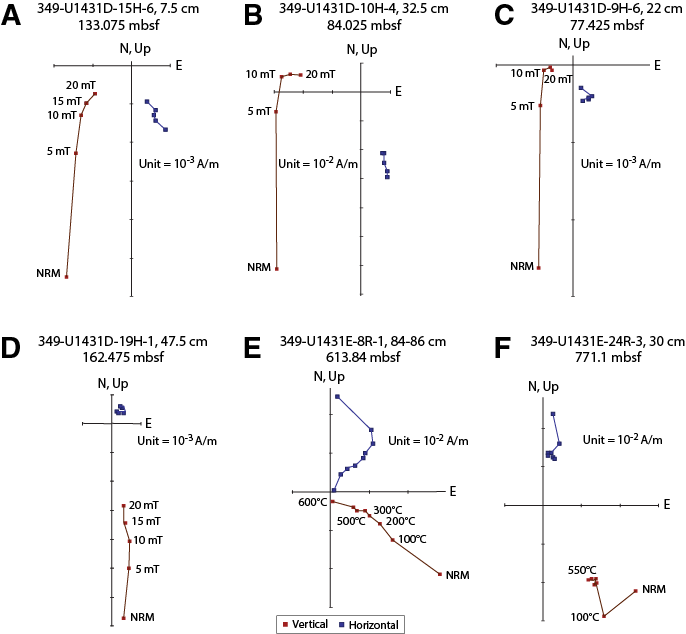
Figure F57. Demagnetization.
Magnetic properties observed in section halves were also confirmed through discrete sample measurements (Figure F57). The nearly vertical overprint was removed by AF demagnetization of 5–10 mT for nearly all samples. AF demagnetization was generally successful in isolating ChRM for most discrete samples. Most discrete samples in lithostratigraphic Unit I show straightforward demagnetization behavior and reveal ChRM (Figures F57B, F57C); however, several discrete samples display more complicated demagnetization paths that do not simply decay toward the origin (Figure F57D).
Thermal demagnetization results show that magnetite and hematite are the dominant magnetic carriers for ChRM (Figures F57E, F57F). The secondary overprints can be easily removed by 100°C thermal treatment. Because of the complexities of coercivity and unblocking spectra of the NRM, we suggest that sequential demagnetization by combining AF and thermal methods could be the best approach to fully isolate ChRM, specifically for Cores 349-U1431D-20X through 67X.
Inclinations after 20 mT AF demagnetization are illustrated in Figure F58. The similarity of results between Holes U1431A and U1431D for the upper 30 m strongly attests to the fidelity of the paleomagnetic records. In addition, this indicates that the chronology of Hole U1431D is strongly correlated to that of Hole U1431A. We note that steep inclinations (>50°) are present throughout the profile, most likely still affected by the drilling overprint or postdepositional disturbances.
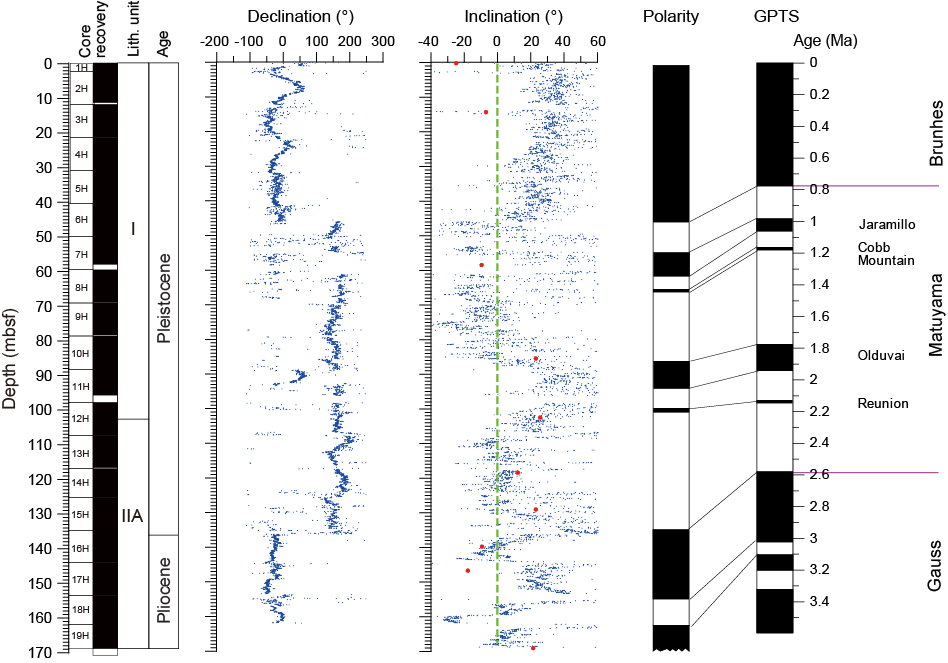
Figure F58. Magnetostratigraphy, Hole U1431D.
Magnetostratigraphy
At the latitude of Site U1431 (~15°N), a near 180° shift in declination in the cores is a more reliable sign of a polarity transition than changing inclinations, considering that the vertical component of magnetization caused by the drilling process affects inclination more strongly than declination.
The construction of magnetostratigraphy is based on correlation between the measured polarity pattern and the geomagnetic polarity timescale (Gradstein et al., 2012), as well as on constraints from biostratigraphy. By comparing inclination and declination, we observed that declination exhibits much sharper subchron boundaries than inclination. As shown in Figure F58, several magnetic excursions may be discerned on the basis of changes in sign of both inclinations and declinations (e.g., at ~46 and ~87 mbsf). It has been recently documented that there are small magnetic polarity changes after the Brunhes/Matuyama Chron boundary (0.78 Ma) (e.g., Jovane et al., 2008; Suganuma et al., 2011). Some of the small inclination fluctuations in Hole U1431D (Figure F58) may correspond to such changes, but further evidence is needed to determine their true origin. We noticed that some of the directional swings just deeper than the Brunhes/Matuyama boundary correspond to sandy layers, possibly suggesting that these swings are associated with the loose material and disturbances.
By integrating both inclination and declination data, the Brunhes/Matuyama Chron boundary (0.78 Ma) is confidently placed at ~46 mbsf and the Matuyama Chron is defined between ~46 and ~135 mbsf (Figure F58). The Jaramillo Subchron (0.98–1.072 Ma) was also identified between ~51.87 and 67.6 mbsf. The Olduvai (1.78–1.95 Ma) and Reunion (~2.128–2.148 Ma) Subchrons are defined between ~87 and ~94 mbsf and between ~99 and 100 mbsf, respectively. From 125 to ~170 mbsf, paleomagnetic records reveal three positive and two reversed subchrons. This pattern is highly consistent with the Gauss Chron. For cores not oriented with the FlexIT orientation tool, declinations cannot be used for constructing magnetostratigraphy. Thus, only inclinations are used to define the polarity reversal boundaries for the deeper sections. This tends to produce relatively wider subchrons, but the overall pattern of the magnetostratigraphy is still valid. More detailed postexpedition paleomagnetic studies are needed to resolve the polarity assignment and improve the magnetostratigraphy at Site U1431.
As mentioned above, strong magnetic overprinting from XCB coring on Cores 349-U1431D-20X through 67X precludes reliable identification of any polarity subchrons. In contrast, sections in Hole U1431E cored with the RCB reveal more reasonable polarity patterns from both section-half and discrete-sample measurements (blue and red circles in Figure F59, respectively). Preliminary micropaleontological studies suggest that sediment between 600 and 650 mbsf is late Miocene in age (<10 Ma). With this age constraint, we define the Chron C5n/C5r boundary (11.056 Ma) at ~716 mbsf (see Biostratigraphy). Between ~720 and ~785 mbsf is a series of short normal and reversed polarities. We tentatively correlate this interval to Chron C5r (~11.06–12.05 Ma) based on the overall similarity of the polarity pattern. However, the presence of calcareous nannofossil taxa with first appearance datums between ~8.3 and 8.7 Ma at this depth (Figure F24) is inconsistent with this interpretation. Additional shore-based studies are needed to resolve this mismatch.
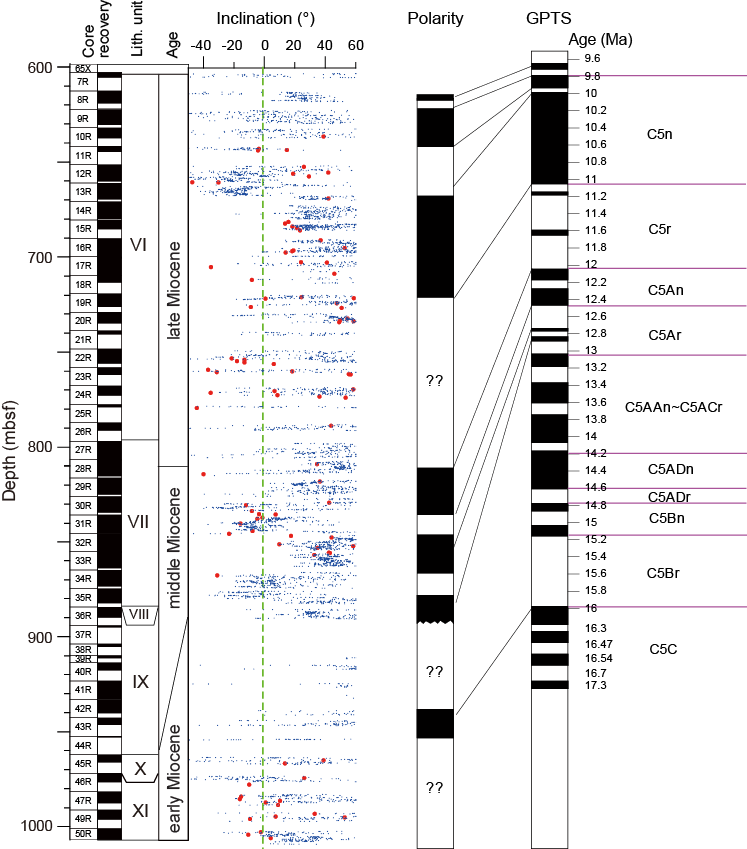
Figure F59. Magnetostratigraphy, Hole U1431E.
Between 785 and 890 mbsf, three normal and two reversed polarities can be tied to Chron C5An and the younger reversed subchron within C5Ar. Therefore, the age at ~890 mbsf is ~12.7 Ma. These paleomagnetically inferred ages are remarkably consistent with nannofossil and foraminifer biostratigraphy for this interval (Figure F24).
For basement rock, the observed paleomagnetic signals cannot be directly linked to the geomagnetic polarity timescale because of the intermittent nature of basalt eruptions and apparently extremely low sedimentation rate of the pelagic clay sediment in Cores 349-U1431E-36R through 45R. Nevertheless, we observed normal and reversed polarities within the interval of basement rock, indicating that the eruption of the basalt units may have spanned a significant amount of time. In particular, core sections between 962.5 and 972.0 mbsf show dominantly normal polarity. Radiolarian biostratigraphy indicates an early Miocene age (~16.7–17.5 Ma) for this interval (Core 45R) (see Biostratigraphy), suggesting that the observed polarity zones should correlate with Chron C5c (16.2–17.3 Ma). Reversal rates during this time interval are typically ~2 times/million years, and it takes ~5000 y to complete a reversal. Therefore, we estimate that eruption of recovered basalt at this site spans at least 5000 y and up to ~1 million years.
Physical properties
We measured physical properties on whole-round cores for all five holes (U1431A–U1431E) drilled at Site U1431. These measurements include P-wave velocity, bulk density (using gamma ray attenuation), magnetic susceptibility, and natural gamma radiation (NGR). No measurements were done on the split half sections of cores from Holes U1431A–U1431C. For cores from Holes U1431D and U1431E, physical property measurements were also performed on split cores (thermal conductivity and P-wave velocity measured with the x-caliper and z-bayonet), as well as on discrete samples (porosity, moisture, and density). These measurements were used to compare with lithostratigraphic description, to correlate core observations with downhole logging, and to compare stratigraphy between holes and with seismic profiles. The measurements of P-wave velocity, bulk density, and magnetic susceptibility using the Whole-Round Multisensor Logger (WRMSL) agree with those on split cores or on discrete samples for cores recovered with the APC in the uppermost 170 m (through Core 349-U1431D-19H). A small difference is usually observed in the magnetic susceptibility and P-wave velocity data between measurements on whole-round cores and on section halves or samples from XCB or RCB coring because of the slightly smaller diameter of the cores causing water/air infill of the gap between the core and the liner (Figure F60).

Figure F60. WRMSL P-wave velocity.
Whole-Round Multisensor Logger measurements
Measurement points that are clearly out of range were removed from the whole-round core data, which were then smoothed using a 5-point average moving window. The combined measurements of physical properties of Holes U1431D and U1431E are shown in Figure F61.
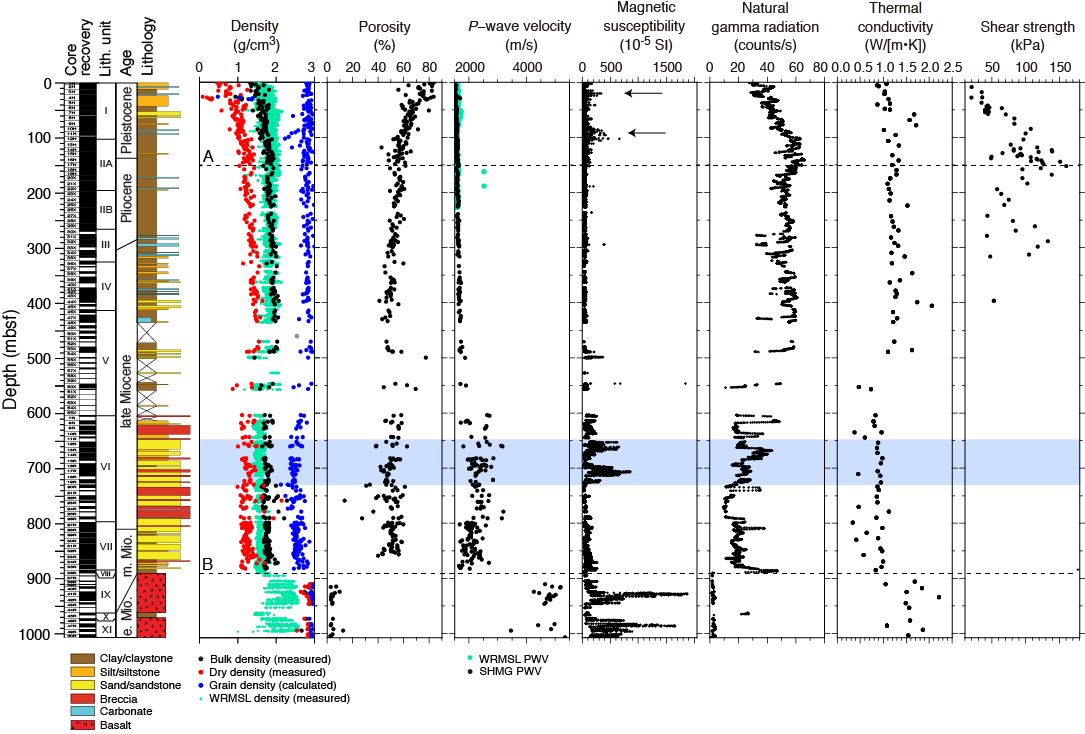
Figure F61. Physical property summary.
Gamma ray attenuation bulk density
Bulk density increases with depth from 1.6 to nearly 2 g/cm3 in the uppermost 150 m (Figure F61) and remains constant near 2 g/cm3 downhole to ~600 mbsf, which coincides with the dominant clay lithology of lithostratigraphic Units II–V. Density decreases to 1.5 g/cm3 in the coarser grained intervals of Units VI and VII and increases again, ranging from 2 to 2.8 g/cm3, in the basalt of Units IX and XI.
Magnetic susceptibility
Magnetic susceptibility data are sensitive to magnetic mineral content and mineralogy of the formation. These data help identify specific lithologies, such as volcanic ash and igneous rock (Figure F61; Table T19). The background magnetic susceptibility value is about <200 × 10−5 SI for sedimentary units. Ash layers in Units I and II of Hole U1431D are characterized by magnetic susceptibility peaks (arrows in Figure F61). Two layers several meters thick near 670 and 710 mbsf show relatively high magnetic susceptibility, up to ~1000 × 10−5 SI (blue box in Figure F61). These layers do not correlate with volcaniclastic breccia but with siltstone/sandstone and are characterized by higher NGR counts compared to the volcaniclastic breccia (up to 50 counts/s).
Table T19. Reference values for magnetic susceptibilities (Clark and Emerson, 1991) and natural gamma radiation (Russell, 1944) in different lithologies used during Expedition 349. Download table in .csv format.
Magnetic susceptibility values are very high (up to 1900 × 10−5 SI) in the basalt of lithostratigraphic Units IX and XI. The significant variability in these basement layers may result from multiple factors, such as core fragmentation, magnetite content, crystal size, and alteration (see Basalt and basalt alteration).
P-wave velocity
P-wave velocity was measured on whole-round cores from the seafloor to ~200 mbsf (Figure F61). Cores collected with the XCB (Cores 349-U1431D-20X through 67X) or the RCB (all of Hole U1431E) have a diameter smaller than the core liner; therefore, poor coupling between the core and the liner prevented good measurements of compressive P-wave velocity on the WRMSL. Thus, we switched off the P-wave velocity measurement on the WRMSL for whole-round cores below Core 20X (168.9 mbsf) and for Hole U1431E. P-wave velocity near the seafloor is close to the velocity in water (~1500 m/s) for Holes U1431A–U1431D, reflecting the high porosity of near-surface sediment. Between about 50 and 63 mbsf, significantly higher values in WRMSL P-wave velocity might be related to sand/sandstone layers not measured with the caliper or due to other unidentified factors (Figure F60).
For Hole U1431A, interstitial water was extracted by Rhizon samplers every 5, 10, or 20 cm before physical property measurements. P-wave velocity was expected to be higher in this hole compared to the others at the same depth interval because of the extraction of water from the sediment, but the logs show lower P-wave velocity instead, suggesting that water in the liners was replaced by air.
Natural gamma radiation
NGR values display significant variations with rock type, with higher NGR counts for silt and mud (~40–70 counts/s), lower counts for sandstone (~0–20 counts/s), and even lower counts for basalt (~0–5 counts/s) (Table T19) (Russell, 1944). In Holes U1431D and U1431E, NGR counts are relatively high from the seafloor to 500 mbsf (~45 counts/s on average), consistent with the clay- and silt-dominated sediment of lithostratigraphic Units I–V (Figure F61). Between 500 and 900 mbsf, background NGR drops to 20 counts/s, which corresponds to the dominant breccia and sandstone lithologies of Units VI and VII. Layers with higher NGR counts and magnetic susceptibility are observed near 670 and 710 mbsf (blue box in Figure F61), which coincide with silt/sandstone layers. NGR counts are very low (<5 counts/s) in the basalt of Units IX and XI.
Thermal conductivity
Thermal conductivity increases from 1 to 1.2 W/(m·K) in the top 150 m and then remains relatively constant downhole to ~600 mbsf (lithostratigraphic Units I–V). It is slightly lower (near 0.85 W/[m·K]) in the breccia and sandstone layers of Units VI and VII and then increases drastically in the basalt (Units IX and XI) to values between 1.5 and 2.2 W/(m·K). The contact probe requires that measurements on hard rock cores be made on large pieces with a smooth splitting surface, so the values likely overestimate the average in situ thermal conductivity.
Point magnetic susceptibility
Point magnetic susceptibility measurements agree well with WRMSL results. A small offset observed between the two types of measurements results from the difference in instrument resolution (see Physical properties in the Methods chapter [Li et al., 2015]). On average, point magnetic susceptibility is 20 × 10−5 SI greater than WRMSL magnetic susceptibility (Figure F62). Point magnetic susceptibility peaks in lithostratigraphic Units I and II, reflecting the presence of ash layers. As described previously, layers with high magnetic susceptibility observed near 670 and 710 mbsf coincide with siltstone/sandstone formations. Magnetic susceptibility values for the basalt in Units IX and XI range between 200 and 1900 × 10−5 SI, with the highest values in the thick lava flows (Figure F63).
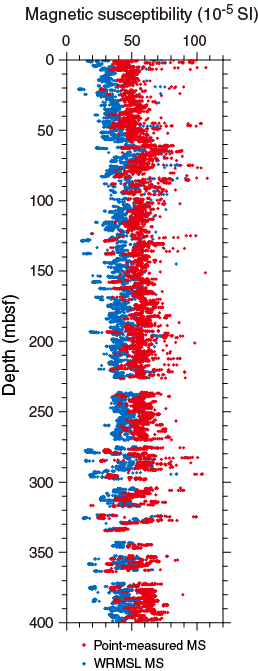
Figure F62. Magnetic susceptibility.
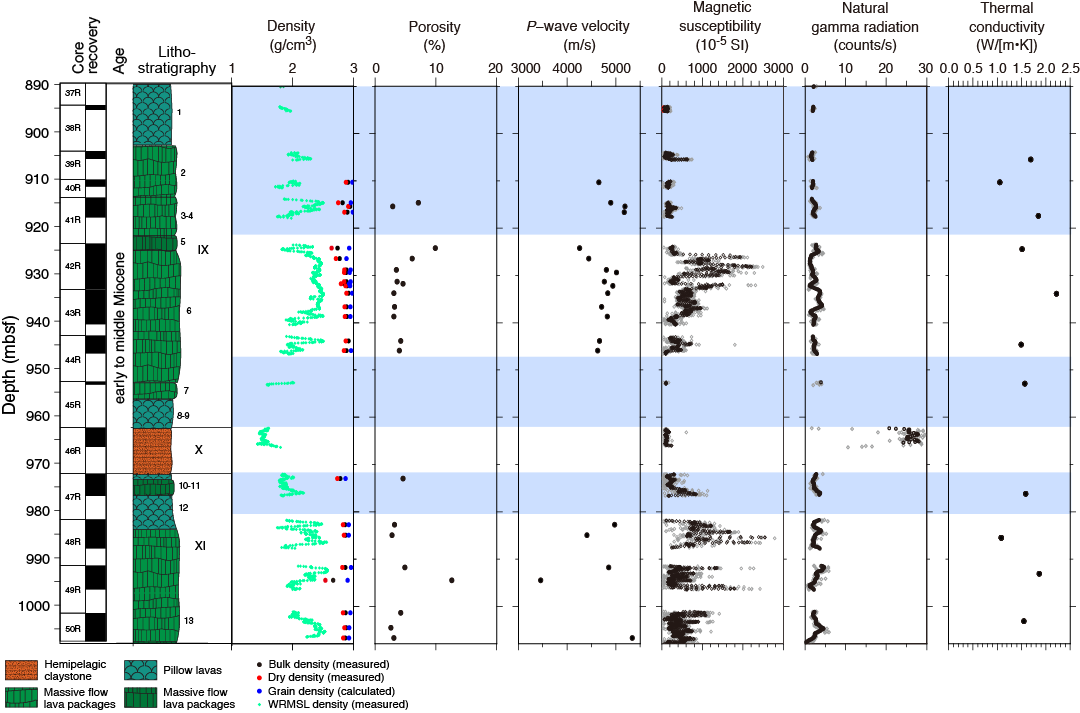
Figure F63. Units IX–XI physical properties.
Compressional wave (P-wave) velocity
P-wave velocity gradually increases from near seawater velocity (1500 m/s) to almost 1800 m/s in Hole U1431D; values are much higher in the indurated sediment of Hole U1431E (Figure F61). P-wave velocity varies between 2000 and 3000 m/s in the volcaniclastic layers of Unit VI, decreases to ~1800–2200 m/s in Unit VII, and increases to nearly 5000 m/s in the basalt of Units IX and XI.
Shear strength
Shear strength increases with depth from 20 to 150 kPa in the uppermost 150 m. Below 150 mbsf, shear strength drops to ~80 kPa, which may be associated with higher abundances of clay compared to the overlying sediment (Figure F61). Because of sediment compaction, vane shear strength was not measured below 400 mbsf, as large cracks started to develop during the measurements.
Moisture and density
Bulk and dry density measured on individual samples show the same variations as those measured on whole-round cores (Figure F61). Grain density is almost constant (~2.8 g/cm3) in clay-rich lithostratigraphic Units I–V and is lower in Unit VI, ~2.4 g/cm3 on average, which may be related to the composition of the sandstone. Basalt grain densities are close to 2.9 g/cm3. Porosity shows a large decrease with depth in the uppermost 150 m, from 80% to 50%, and remains relatively constant in the deeper sediment and sedimentary rocks. Density drops to 4%–6% in the basaltic layers.
Data interpretation and lithology correlation
In general, physical properties correlate with lithology, composition, and lithification. The variations of some of the physical properties near the seafloor reflect compaction of the sediment.
Surface sediment compaction
In Hole U1431D, bulk density, P-wave velocity, NGR, and thermal conductivity increase gradually with depth over the uppermost 150 m (dashed line A in Figure F61), whereas porosity measured on discrete samples decreases from 84% to 50% over the same depth range. A good inverse correlation exists between P-wave velocity and porosity as a second-order polynomial function (Figure F64A), and a linear inverse trend is observed between bulk density and porosity (Figure F64B). This indicates that sediment compaction dominates some of the physical property variations above 150 mbsf.
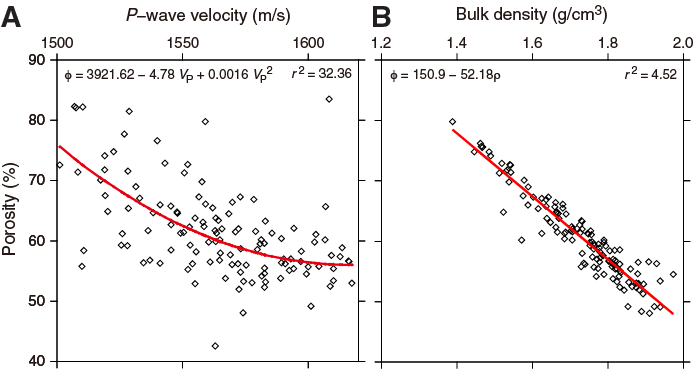
Figure F64. P-wave velocity and bulk density.
Ash layers
Ash layers are often marked by high magnetic susceptibility, although some layers are too thin to be detected at the resolution of the point magnetic susceptibility measurements. Relatively high magnetic susceptibility (300 × 10−5 to 500 × 10−5 SI) corresponds to volcanic ash layers at 25 and 100 mbsf (arrows in Figure F61).
Clay/silt/sand content
Relative clay/silt/sand content is often reflected by the combination of magnetic susceptibility and NGR values. For example, high magnetic susceptibility near 670 and 710 mbsf (blue box in Figure F61) does not correspond to volcaniclastic breccia layers but to siltstone/sandstone, as evidenced by high NGR (up to 50 counts/s). The siltstone/sandstone may contain magnetic minerals such as magnetite, possibly eroded from the nearby seamounts.
The 5 m thick layer of claystone (lithostratigraphic Unit X) between the two basalt units (Units IX and XI) clearly shows NGR values ~20 times greater than those of the basalt layers (Figure F63) and much lower magnetic susceptibility.
Volcaniclastics
Most physical properties show significant change below 600 mbsf, at the boundary between lithostratigraphic Units V and VI, such as increased P-wave velocity (>2000 m/s), relatively low NGR, low average thermal conductivity (0.85 W/[m·K]), and higher porosity variations (50%–70%), which correspond to the presence of volcaniclastic breccia (Figure F61). The variation in these physical properties in Unit VI reflects the interbedding between sandstone layers, volcaniclastic breccias, and silt/claystones.
Basalt and basalt alteration
Drastic changes in physical properties near 890 mbsf correspond to the first occurrence of basalt layers. The basalt units below 890 mbsf (dashed line B in Figure F61) display the lowest NGR (~6 counts/s on average), highest point-measured magnetic susceptibility (2100 × 10−5 SI in Unit IX and 2300 × 10−5 SI in Unit XI), and bulk density of 2.5–2.8 g/cm3.
As shown in Figure F63, the basalt layers (Units IX and XI) show a very large range of magnetic susceptibility values (~30 × 10−5 to 2300 × 10−5 SI). Variations in magnetic susceptibility in the basalt units may result from different factors. Lower magnetic susceptibility measurements might reflect the small length of some of the recovered basalt pieces and/or could be related to lower magnetite content due to the composition of the basalt. Crystal size also likely influences magnetic susceptibility values; larger crystals near the center of the basalt flows (see Igneous petrology and alteration), including larger magnetite crystals, may result from the slower cooling of the cores of massive basalt compared to their edges. Finally, alteration of basalt affects its mineralogy and therefore its physical properties. The low magnetic susceptibility and low NGR values at the top of the basalt layers likely result from a combination of all of these factors.
Downhole measurements
Logging operations
Hole preparation for logging started before the last core from Hole U1431E arrived on deck. After coring to 991.4 mbsf, a wiper trip was made from 863 to 979 m drilling depth below seafloor (DSF) to allow debris that had been collecting around the drill collars to fall into the hole. Several 50 bbl sepiolite mud sweeps were also run at regular intervals to clear the hole. After the last core, the RCB drill bit was released near the bottom of the hole, and the hole was displaced from 648 m DSF upward with 240 bbl of heavy (11.4 lb/gal; barite weighted) mud. The pipe was raised to logging depth (4400.9 m drilling depth below rig floor [DRF]; 149.6 m DSF) (Figure F65). Rig-up for downhole logging started at 1820 h (local time; UTC + 8 h) on 14 February 2014. Heave conditions were ~1 m for the triple combo tool string run and up to 2 m for the FMS-sonic tool string run. The wireline heave compensator was used for both runs. A brand new logging cable was used, which had to be detorqued and run no faster than ~1800 m/h. This slowed the trips through the water column compared to a seasoned cable.
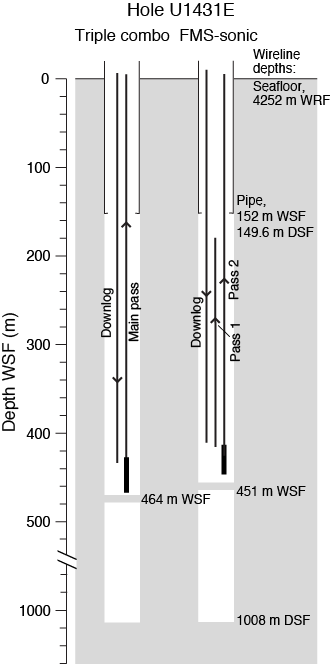
Figure F65. Logging operations.
The modified triple combo tool string started downhole at 2100 h on 14 February. The Hostile Environment Natural Gamma Ray Sonde (HNGS), Accelerator Porosity Sonde (APS), Hostile Environment Litho-Density Sonde (HLDS), High-Resolution Laterolog Array (HRLA), and Magnetic Susceptibility Sonde (MSS) were included. The centralized tools were run in the lower part of the tool string so that it would be easier to lower the tool string past ledges than an eccentralized tool (see Downhole measurements in the Methods chapter [Li et al., 2015] for tool diagrams). The tool string was prevented from moving further down the hole by an impassable bridge at 464 m WSF. The heavy mud, which might have stabilized the borehole walls, did not reach up to this point because of underestimation of the diameter of the borehole and the volume of heavy mud required to fill it. The absence of the barite-weighted heavy mud is apparent by the absence of photoelectric effect factor log values > 5 b/e−, which would have been an indicator of the presence of the heavy element barium, and the absence of viscous mud on the tools themselves after they were brought back up to the rig floor. The FMS-sonic tool string was run into the pipe at 0900 h on 15 February. Sonic logs were taken on the descent, and two upward passes, including both FMS and sonic logs, were made from 410 (Pass 1) and 451 m WSF (Pass 2).
Log data quality
Log data quality was affected by the large borehole diameter, exceeding the 17 inch limit of the HLDS caliper arm in about half of the logged interval (Figure F66). Some particularly large caves were found, for example in the 296–301 and 405–411 m WSF intervals (labeled “Washout” on Figure F66), leading to uncertainty in most of the log values in such intervals. A lot of circulation of drilling fluid is generally required to keep deep holes open and prevent sand from building up around the drill pipe, which often results in washout of sand-rich sediment. Several thin, bridged (narrow diameter) intervals also occur, for example at 231 and 310 m WSF. Despite the often wide and rapidly varying borehole width, interpretable features are seen in the FMS resistivity images. The triple combo main upward pass was taken as the depth reference, and the other logging runs were depth matched to it by means of the NGR log.
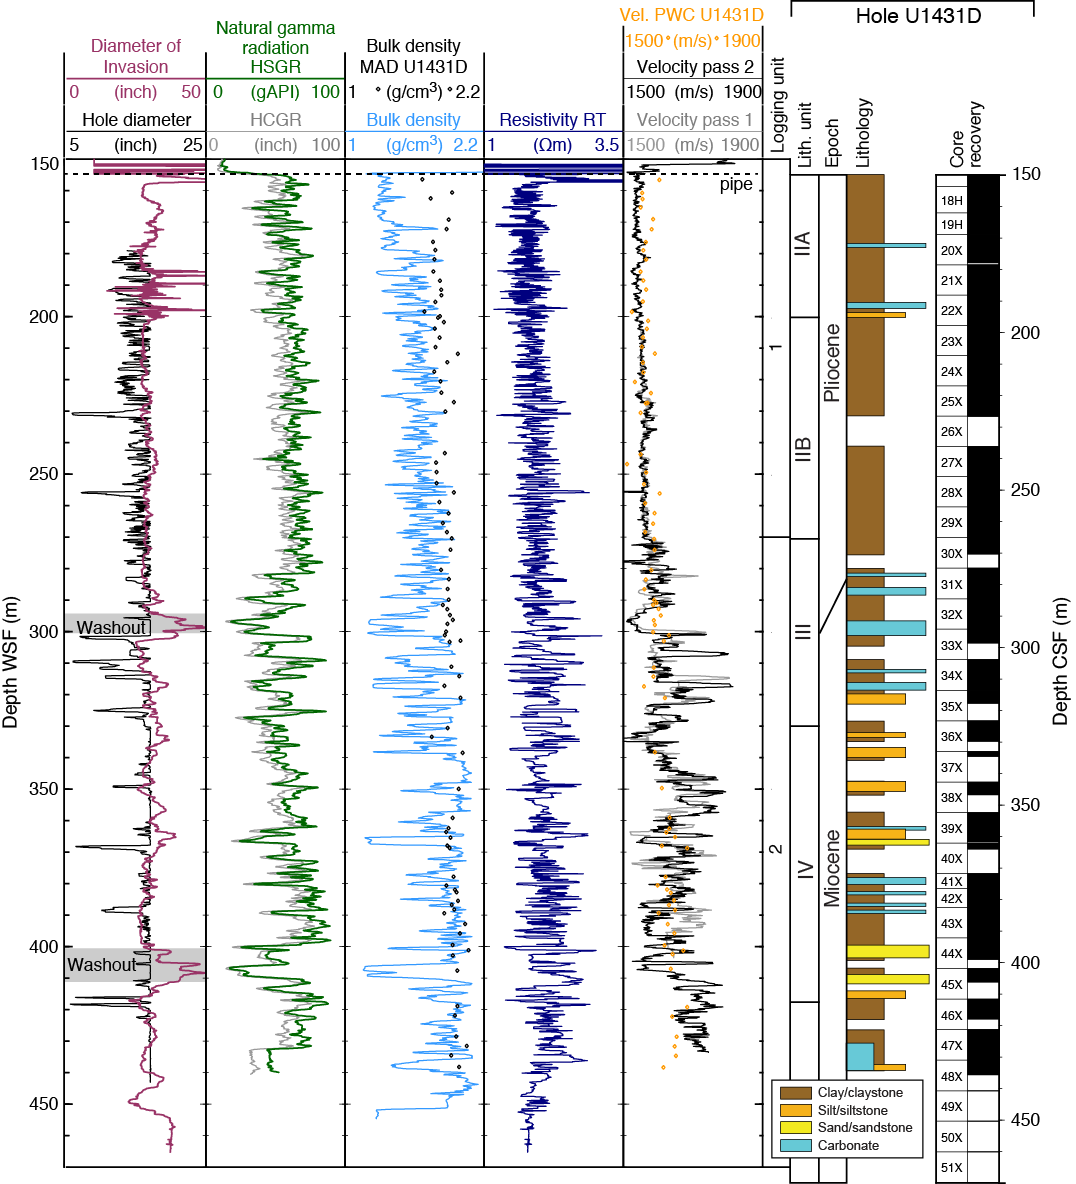
Figure F66. Downhole log comparison.
Logging units
Logging Unit 1: base of drill pipe to 270 m WSF
This logging unit is characterized by relative homogeneity in the logs without major excursions to higher or lower log values (e.g., sonic velocity and magnetic susceptibility logs) (Figures F66, F67). It is also characterized by submeter-scale layering, particularly evident in the caliper and resistivity logs and FMS images. This logging unit corresponds to lithostratigraphic Unit II (see Lithostratigraphy).
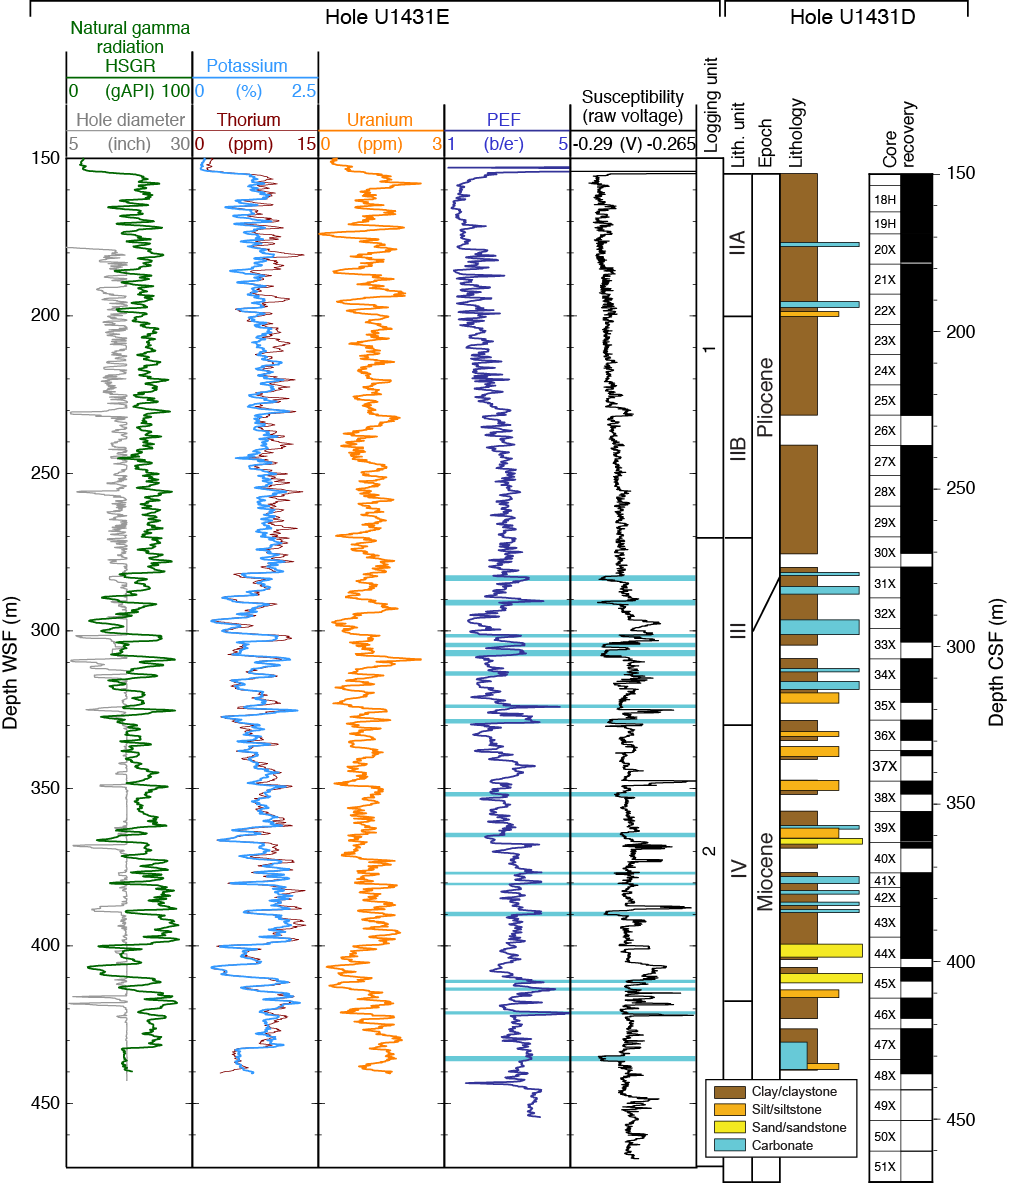
Figure F67. Geochemistry-dependent downhole logs.
Logging Unit 2: 270–460 m WSF
This unit is characterized by higher variability in the logs compared to logging Unit 1. For example, NGR values vary from ~20 to 90 gAPI (Figure F66). Excursions to lower and higher values also punctuate the magnetic susceptibility log (Figure F67). The sonic velocity log shows clear contrast to logging Unit 1, with velocities reaching 1800 m/s. This logging unit corresponds to lithostratigraphic Units III and IV and the upper part of Unit V (see Lithostratigraphy), which include thicker and coarser turbidites than Unit II.
Downhole logs and lithology
The downhole logs and FMS images reflect lithology at Site U1431. The lithology in the upper 460 m of the hole is clay dominated and punctuated with centimeter- to meter-scale beds of coarser material, some of which is calcareous (see Lithostratigraphy). The clay-dominated sediment has high NGR because of K and Th in the clay minerals, whereas the calcareous sediment has lower NGR and magnetic susceptibility because of a relative lack of radioactive and magnetic minerals. The same NGR and magnetic susceptibility signatures are also seen in the physical property measurements made on cores from Hole U1431D (Figures F60, F68), which enables the downhole logs from Hole U1431E to be correlated to the core data from Hole U1431D. The same lithologic features appear ~5 m lower in Hole U1431E log depth than they do in Hole U1431D. This depth offset can be caused by stratigraphic dip between the two holes, uncertainty in the seafloor depth, or uncertainty in the cable-stretch correction, among other reasons (see Downhole measurements in the Methods chapter [Li et al., 2015]).
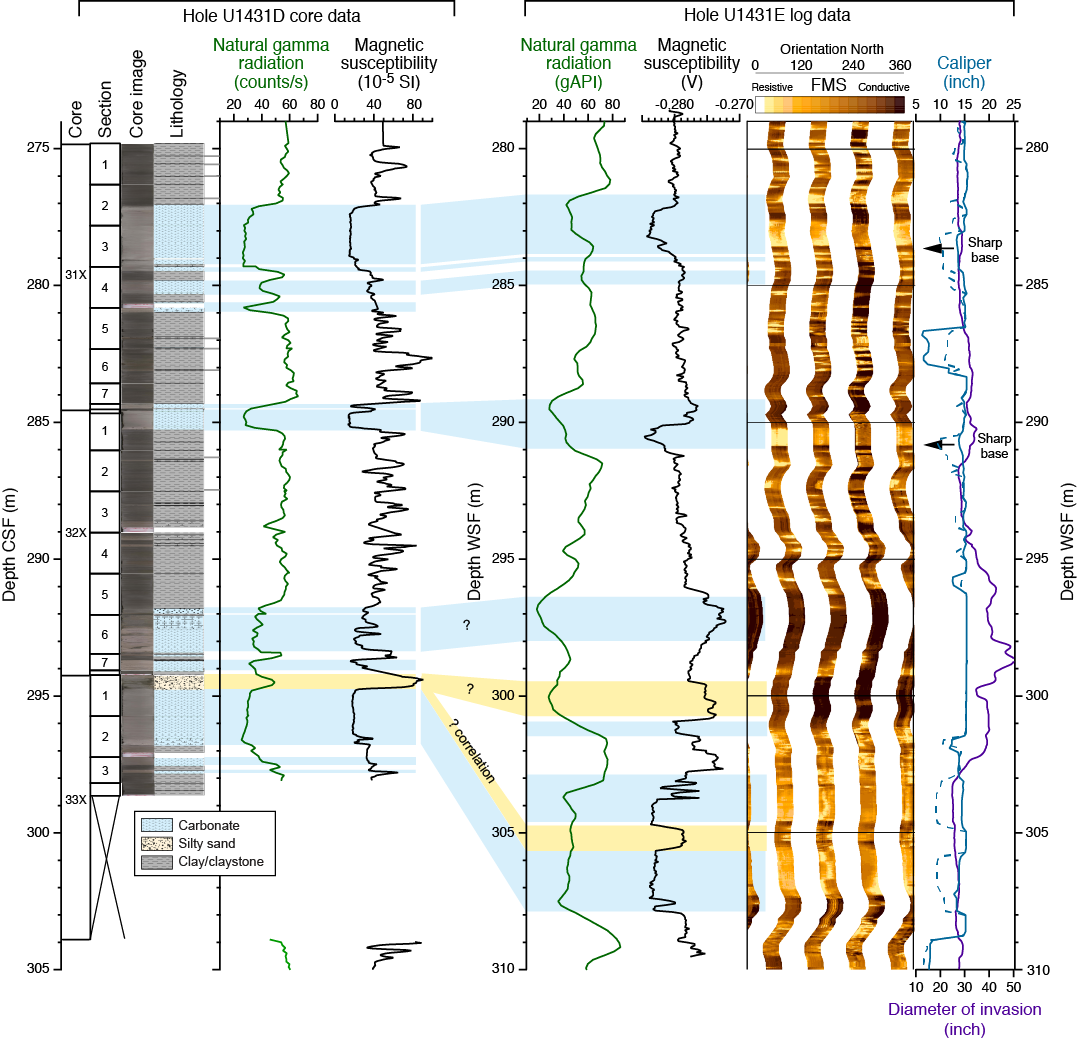
Figure F68. Carbonate layer correlation.
The contrasts in NGR and magnetic susceptibility can be seen both in the logs as a whole (Figure F67) and in a short section examined in more detail (Figure F68). In particular, the calcareous beds can be readily identified in the downhole logs, with low NGR and magnetic susceptibility and a resistive signature in the FMS images. The FMS images also show the sharp bases of the calcareous turbidites (e.g., at 283.5 and 291 m WSF; arrows in Figure F68). These calcareous beds appear to be washed out in their upper part but not so much in their lower part. These washouts are observed as having wide borehole diameter (Figure F66), more conductive FMS images, and higher logging magnetic susceptibility values. Somewhat counterintuitively, magnetic susceptibility as measured by the MSS tool moves to anomalously higher values where the borehole is very wide, for example at 289–290 and 296–298 m WSF.
Sand-rich beds can be difficult to identify because they tend to be only partially recovered in the cores and because they become easily washed out in the borehole, resulting in anomalous log data values. In fact, the best indication of sand layers in the logs may be the diameter of the borehole (e.g., washed out sections at 296–301 and 405–411 m WSF). Such washouts also have very low NGR values (e.g., between 52 and 62 m WSF; yellow boxes in Figure F69).

Figure F69. NGR attenuation correction.
The FMS images contain thin (submeter scale) alternations of high- and low-resistivity beds. These are clearly related to the short-scale variations in borehole diameter (Figure F68), but the question remains whether these submeter-scale washouts are themselves controlled by lithology or if the drilling process is responsible for their formation. In Figure F68, the calcareous beds can clearly be identified in the FMS image, but the thin resistive features do not appear to correlate very well with the thin silty beds identified in the visual core descriptions. The interpretation of the thin, apparently resistive features in the FMS images therefore remains unclear.
Sonic velocity and two-way traveltime
The sonic velocity log repeated reasonably well between the two passes of the logging tool, so the data are considered to be fairly robust, a conclusion that is supported by the general similarity to the P-wave velocities measured on core samples (Figure F70A). Sonic velocities remain at low values until ~270 mbsf and then become faster below this depth. These two data sets were used to calculate interval velocities between measurement points and then were summed and doubled to yield two-way traveltime for the uppermost 460 m at Site U1431 (Figure F70B). From these data, the boundary between logging Units 1 and 2 at 270 mbsf lies at the top of the set of high-amplitude reflectors in the seismic section at ~6 s two-way traveltime (Figure F3).
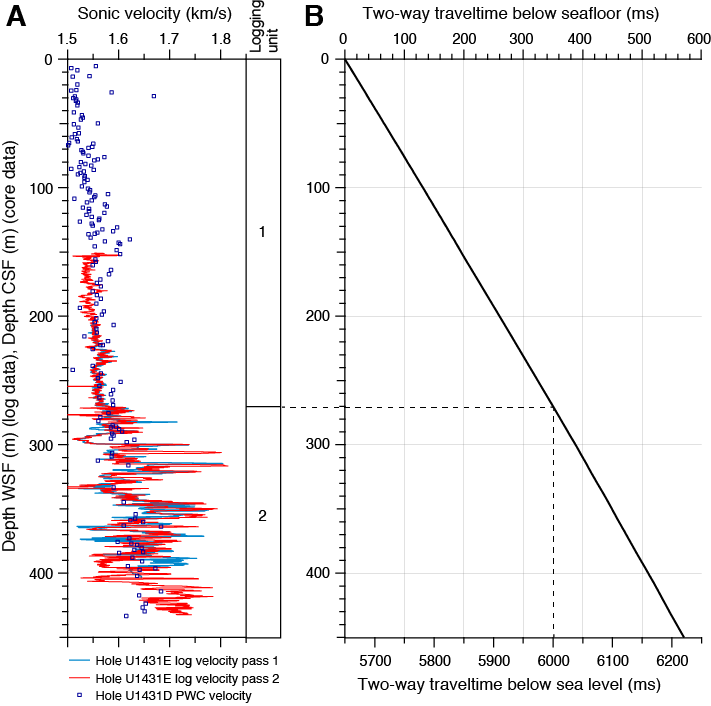
Figure F70. Sonic velocity and two-way traveltime.
Borehole cross-sectional shape and crustal stress
When the borehole is oval in cross-section, the two orthogonal pairs of FMS caliper arms tend to follow the semimajor and semiminor axes of the borehole oval. The cross-sectional shape of the borehole is controlled by the stress state of the crust in the area surrounding the borehole: the long axis follows the direction of minimum horizontal compressional stress (Sh) and the short axis follows the direction of maximum horizontal stress (SH) (Moos and Zoback, 1990; Lin et al., 2010). The long axis often includes borehole breakouts. The FMS tool is oriented by magnetometry, so the azimuth of these directions can be determined. The borehole long axis in the interval where the caliper arms were open (194–443 m WSF) is consistently oriented NNW–SSE (Figure F71), indicating that SH is oriented ENE–WSW in this part of the South China Sea.
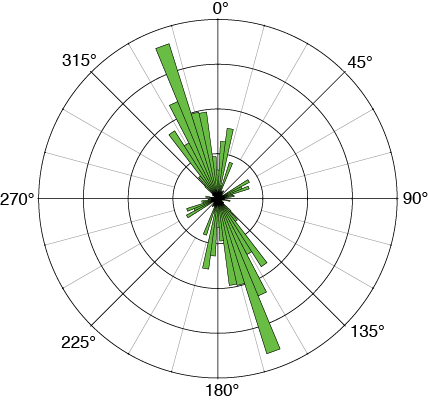
Figure F71. Borehole cross-section azimuth.
Downhole temperature and heat flow
Four APCT-3 downhole temperature measurements in Hole U1431D ranged from 2.95°C at 31.7 m DSF to 4.22°C at 117.2 m DSF (Table T20; Figures F72, F73A), giving a geothermal gradient of 14.8°C/km. These measurements, together with the seafloor temperature of 2.5°C, indicate that the temperature increases linearly with depth.
Table T20. Advanced piston corer temperature tool (APCT-3) measurements in Hole U1431D. Download table in .csv format.
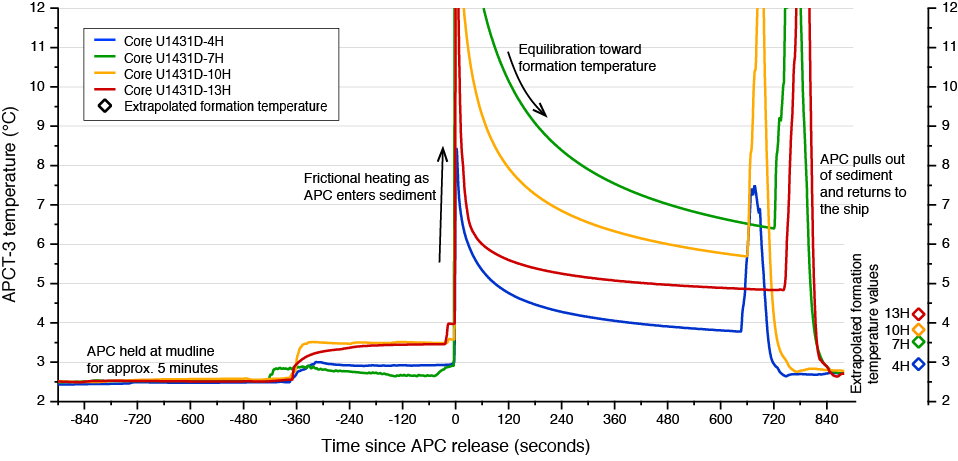
Figure F72. APCT-3 temperature-time series.
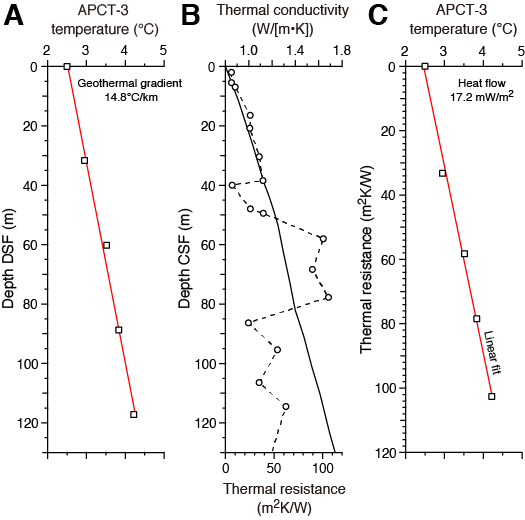
Figure F73. Heat flow calculations.
Thermal conductivity under in situ conditions was estimated from laboratory-determined thermal conductivity from Hole U1431D using the method of Hyndman et al. (1974) (see Physical properties in the Methods chapter [Li et al., 2015]). The calculated in situ values average 1.1% higher than the measured laboratory values. Thermal resistance was then calculated by integrating the inverse of the in situ thermal conductivity over depth (Figure F73B). A heat flow of 17.2 mW/m2 was obtained from the linear fit between temperature and thermal resistance (Figure F73C) (Pribnow et al., 2000). The geothermal gradient and heat flow at Site U1431 are relatively low for the South China Sea (Li et al., 2010), and we speculate that this might be caused by a downwelling limb of hydrothermal circulation in the area of Site U1431, which lies in a small basin adjacent to seamounts.
References
Alt, J.C., France-Lanord, C., Floyd, P.A., Castillo, P., and Galy, A., 1992. Low-temperature hydrothermal alteration of Jurassic ocean crust, Site 801. In Larson, R.L., Lancelot, Y., et al., Proceedings of the Ocean Drilling Program, Scientific Results, 129: College Station, TX (Ocean Drilling Program), 415–427. http://dx.doi.org/10.2973/odp.proc.sr.129.132.1992
Bach, W., Alt, J.C., Niu, Y., Humphris, S.E., Erzinger, J., and Dick, H.J.B., 2001. The geochemical consequences of late-stage low-grade alteration of lower ocean crust at the SW Indian Ridge: results from ODP Hole 735B (Leg 176). Geochimica Cosmochimica Acta, 65(19):3267–3287. http://dx.doi.org/10.1016/S0016-7037(01)00677-9
Berggren, W.A., Kent, D.V., Swisher, C.C., III, and Aubry, M.-P., 1995. A revised Cenozoic geochronology and chronostratigraphy. In Berggren, W.A., Kent, D.V., Aubry, M.-P., and Hardenbol, J. (Eds.), Geochronology, Time Scales and Global Stratigraphic Correlation. Special Publication - SEPM (Society for Sedimentary Geology), 54:129–212. http://dx.doi.org/10.2110/pec.95.04.0129
Bjørklund, K.R., and Goll, R.M., 1979. Internal skeletal structures of Collosphaera and Trisolenia: a case of repetitive evolution in the Collosphaeridae (Radiolaria). Journal of Paleontology, 53(6):1293–1326. http://www.jstor.org/stable/1304135
Briais, A., Patriat, P., and Tapponnier, P., 1993. Updated interpretation of magnetic anomalies and seafloor spreading stages in the South China Sea: implications for the Tertiary tectonics of Southeast Asia. Journal of Geophysical Research: Solid Earth, 98(B4):6299–6328. http://dx.doi.org/10.1029/92JB02280
Chen, M., and Tan Z., 1997. Radiolarian distribution in surface sediments of the northern and central South China Sea. Marine Micropaleontology, 32(1–2):173–194. http://dx.doi.org/10.1016/S0377-8398(97)00019-4
Clark, D.A., and Emerson, D.W., 1991. Notes on rock magnetization characteristics in applied geophysical studies. Exploration Geophysics, 22(3):547–555. http://dx.doi.org/10.1071/EG991547
Expedition 329 Scientists, 2011. Site U1365. In D’Hondt, S., Inagaki, F., Alvarez Zarikian, C.A., and the Expedition 329 Scientists, Proceedings of the Integrated Ocean Drilling Program, 329: Tokyo (Integrated Ocean Drilling Program Management International, Inc.). http://dx.doi.org/10.2204/iodp.proc.329.103.2011
Expedition 334 Scientists, 2012. Site U1381. In Vannucchi, P., Ujiie, K., Stroncik, N., Malinverno, A., and the Expedition 334 Scientists, Proceedings of the Integrated Ocean Drilling Program, 334: Tokyo (Integrated Ocean Drilling Program Management International, Inc.). http://dx.doi.org/10.2204/iodp.proc.334.106.2012
Gradstein, F.M., Ogg, J.G., Schmitz, M.D., and Ogg, G.M. (Eds.)., 2012. The Geological Time Scale 2012: Oxford, UK (Elsevier).
Harris, R.N., Sakaguchi, A., Petronotis, K., Baxter, A.T., Berg, R., Burkett, A., Charpentier, D., Choi, J., Diz Ferreiro, P., Hamahashi, M., Hashimoto, Y., Heydolph, K., Jovane, L., Kastner, M., Kurz, W., Kutterolf, S.O., Li, Y., Malinverno, A., Martin, K.M., Millan, C., Nascimento, D.B., Saito, S., Sandoval Gutierrez, M.I., Screaton, E.J., Smith-Duque, C.E., Solomon, E.A., Straub, S.M., Tanikawa, W., Torres, M.E., Uchimura, H., Vannucchi, P., Yamamoto, Y., Yan, Q., and Zhao, X., 2013. Input Site U1414. In Harris, R.N., Sakaguchi, A., Petronotis, K., and the Expedition 344 Scientists, Proceedings of the Integrated Ocean Drilling Program, 344: College Station, TX (Integrated Ocean Drilling Program). http://dx.doi.org/10.2204/iodp.proc.344.104.2013
Hékinian, R., Bonté, P., Pautot, G., Jacques, D., Labeyrie, L.D., Mikkelsen, N., and Reyss, J.-L., 1989. Volcanics from the South China Sea ridge system. Oceanologica Acta, 12(2):101–115.
Hyndman, R.D., Erickson, A.J., and Von Herzen, R.P., 1974. Geothermal measurements on DSDP Leg 26. In Davies, T.A., Luyendyk, B.P., et al., Initial Reports of the Deep Sea Drilling Project, 26: Washington, DC (U.S. Government Printing Office), 451–463. http://dx.doi.org/10.2973/dsdp.proc.26.113.1974
Ishihara, T., and Kisimoto, K., 1996. Magnetic anomaly map of East Asia, 1:4,000,000 (CD-ROM version). Geological Survey of Japan, Coordinating Committee for Coastal and Offshore Geoscience Programs in East and Southeast Asia (CCOP).
Jovane, L., Acton, G., Florindo, F., and Verosub, K.L., 2008. Geomagnetic field behavior at high latitudes from a paleomagnetic record from Eltanin Core 27–21 in the Ross Sea sector, Antarctica. Earth and Planetary Science Letters, 267(3–4):435–443. http://dx.doi.org/10.1016/j.epsl.2007.12.006
Kirschvink, J.L., 1980. The least-squares line and plane and the analysis of palaeomagnetic data. Geophysical Journal of the Royal Astronomical Society, 62(3):699–718. http://dx.doi.org/10.1111/j.1365-246X.1980.tb02601.x
Knoll, A.H., and Johnson, D.A., 1975. Late Pleistocene evolution of the collosphaerid radiolarian Buccinosphaera invaginata Haeckel. Micropaleontology, 21(1):60–68. http://dx.doi.org/10.2307/1485155
Kurnosov, V.B., Zolotarev, B.P., Artamonov, A.V., Lyapunov, S.M., Kashinzev, G.L., Chudaev, O.V., Sokolova, A.L., and Garanina, S.A., 2008. Technical note: alteration effects in the upper oceanic crust—data and comments. Transactions of the Geological Institute of the Russian Academy of Sciences, 581.
Le Maitre, R.W., Bateman, P., Dudek, A., Keller, J., Lameyre, J., Le Bas, M.J., Sabine, P.A., Schmid, R., Sorensen, H., Streckeisen, A., Woolley, A.R., and Zanettin, B., 1989. A Classification of Igneous Rocks and Glossary of Terms: Oxford, UK (Blackwell Science Publishing).
Li, C.-F., Lin, J., Kulhanek, D.K., Williams, T., Bao, R., Briais, A., Brown, E.A., Chen, Y., Clift, P.D., Colwell, F.S., Dadd, K.A., Ding, W., Hernández-Almeida, I., Huang, X.-L., Hyun, S., Jiang, T., Koppers, A.A.P., Li, Q., Liu, C., Liu, Q., Liu, Z., Nagai, R.H., Peleo-Alampay, A., Su, X., Sun, Z., Tejada, M.L.G., Trinh, H.S., Yeh, Y.-C., Zhang, C., Zhang, F., Zhang, G.-L., and Zhao, X., 2015. Methods. In Li, C.-F., Lin, J., Kulhanek, D.K., and the Expedition 349 Scientists, Proceedings of the Integrated Ocean Drilling Program, 349: South China Sea Tectonics: College Station, TX (International Ocean Discovery Program). http://dx.doi.org/10.14379/iodp.proc.349.102.2015
Li, C.-F., Shi, X., Zhou, Z., Li, J., Geng, J., and Chen, B., 2010. Depths to the magnetic layer bottom in the South China Sea area and their tectonic implications. Geophysical Journal International, 182(3):1229–1247. http://dx.doi.org/10.1111/j.1365-246X.2010.04702.x
Lin, W., Doan, M.-L., Moore, J.C., McNeill, L., Byrne, T.B., Ito, T., Saffer, D., Conin, M., Kinoshita, M., Sanada, Y., Moe, K.T., Araki, E., Tobin, H., Boutt, D., Kano, Y., Hayman, N.W., Flemings, P., Huftile, G.J., Cukur, D., Buret, C., Schleicher, A.M., Efimenko, N., Kawabata, K., Buchs, D.M., Jiang, S., Kameo, K., Horiguchi, K., Wiersberg, T., Kopf, A., Kitada, K., Eguchi, N., Toczko, S., Takahashi, K., and Kido, Y., 2010. Present-day principal horizontal stress orientations in the Kumano forearc basin of the southwest Japan subduction zone determined from IODP NanTroSEIZE drilling Site C0009. Geophysical Research Letters, 37(13):L13303. http://dx.doi.org/10.1029/2010GL043158
Lowe, D.R., 1982. Sediment gravity flows, II. Depositional models with special reference to the deposits of high-density turbidity currents. Journal of Sedimentary Petrology, 52(1):279–297. http://jsedres.sepmonline.org/cgi/content/abstract/52/1/279
Macdonald, G.A., 1968. Composition and origin of Hawaiian lavas. In Coats, R.R., Hay, R.L., and Anderson, C.A. (Eds.), Studies in Volcanology: A Memoir in Honor of Howel Williams. Memoir—Geological Society of America, 116:477–522. http://dx.doi.org/10.1130/MEM116-p477
Macdonald, G.A., and Katsura, T., 1964. Chemical composition of Hawaiian lavas. Journal of Petrology, 5(1):82–133. http://petrology.oxfordjournals.org/content/5/1/82.abstract
Martini, E., 1971. Standard Tertiary and Quaternary calcareous nannoplankton zonation. In Farinacci, A. (Ed.), Proceedings of the Second Planktonic Conference, Roma 1970: Rome (Edizioni Tecnoscienza), 2:739–785.
Maslin, M.A., Li, X.S., Loutre, M.-F., and Berger, A., 1998. The contribution of orbital forcing to the progressive intensification of Northern Hemisphere glaciation. Quaternary Science Reviews, 17(4–5):411–426. http://dx.doi.org/10.1016/S0277-3791(97)00047-4
Middleton, G.V., and Hampton, M.A., 1973. Sediment gravity flows: mechanics of flow and deposition. In Middleton, G.V., and Bouma, A.H. (Eds.), Turbidites and Deep Water Sedimentation. Short Course Notes, Society of Economic Paleontologists and Mineralogists, Pacific Section, 1–38. http://archives.datapages.com/data/pac_sepm/015/015001/pdfs/1.pdf
Moos, D., and Zoback, M.D., 1990. Utilization of observations of well bore failure to constrain the orientation and magnitude of crustal stresses: application to continental, Deep Sea Drilling Project, and Ocean Drilling Program boreholes. Journal of Geophysical Research: Solid Earth, 95(B6):9305–9325. http://dx.doi.org/10.1029/JB095iB06p09305
Németh, K., Cronin, S.J., Stewart, R.B., and Charley, D., 2009. Intra- and extra-caldera volcaniclastic facies and geomorphic characteristics of a frequently active mafic island-arc volcano, Ambrym Island, Vanuatu. Sedimentary Geology, 220(3–4):256–270. http://dx.doi.org/10.1016/j.sedgeo.2009.04.019
Pribnow, D., Kinoshita, M., and Stein, C., 2000. Thermal Data Collection and Heat Flow Recalculations for Ocean Drilling Program Legs 101–180: Hanover, Germany (Institute for Joint Geoscientific Research, Institut für Geowissenschaftliche Gemeinschaftsaufgaben [GGA]). http://www-odp.tamu.edu/publications/heatflow/ODPReprt.pdf
Roser, B.P., and Korsch, R.J., 1988. Provenance signatures of sandstone-mudstone suites determined using discriminant function analysis of major-element data. Chemical Geology, 67(1–2):119–139. http://dx.doi.org/10.1016/0009-2541(88)90010-1
Russell, W.L., 1944. The total gamma ray activity of sedimentary rocks as indicated by Geiger counter determinations. Geophysics, 9(2):180–216. http://dx.doi.org/10.1190/1.1445076
Saint-Ange, F., Bachèlery, P., Babonneau, N., Michon, L., and Jorry, S.J., 2013. Volcaniclastic sedimentation on the submarine slopes of a basaltic hotspot volcano: Piton de la Fournaise Volcano (La Réunion Island, Indian Ocean). Marine Geology, 337:35–52. http://dx.doi.org/10.1016/j.margeo.2013.01.004
Sanfilippo, A., and Nigrini, C., 1998. Code numbers for Cenozoic low latitude radiolarian biostratigraphic zones and GPTS conversion tables. Marine Micropaleontology, 33(1–2):109–117, 121–156. http://dx.doi.org/10.1016/S0377-8398(97)00030-3
Smith, A., Popa, R., Fisk, M., Nielsen, M., Wheat, C.G., Jannasch, H.W., Fisher, A.T., Becker, K., Sievert, S.M., and Flores, G., 2011. In situ enrichment of ocean crust microbes on igneous minerals and glasses using an osmotic flow-through device. Geochemistry, Geophysics, Geosystems, 12(6):Q06007. http://dx.doi.org/10.1029/2010GC003424
Suganuma, Y., Okuno, J., Heslop, D., Roberts, A.P., Yamazaki, T., and Yokoyama, Y., 2011. Post-depositional remanent magnetization lock-in for marine sediments deduced from 10Be and paleomagnetic records through the Matuyama–Brunhes boundary. Earth and Planetary Science Letters, 311(1–2):39–52. http://dx.doi.org/10.1016/j.epsl.2011.08.038
Takahashi, T., 1991. Debris Flow: International Association for Hydraulic Research Monograph: Rotterdam, The Netherlands (Balkema).
Tu, K., Flower, M.F.J., Carlson, R.W., Xie, G., Chen, C.-Y., and Zhang, M., 1992. Magmatism in the South China Basin: 1. Isotopic and trace-element evidence for an endogenous Dupal mantle component. Chemical Geology, 97(1–2):47–63. http://dx.doi.org/10.1016/0009-2541(92)90135-R
Wade, B.S., Pearson, P.N., Berggren, W.A., and Pälike, H., 2011. Review and revision of Cenozoic tropical planktonic foraminiferal biostratigraphy and calibration to the geomagnetic polarity and astronomical time scale. Earth-Science Reviews, 104(1–3):111–142. http://dx.doi.org/10.1016/j.earscirev.2010.09.003
Wang, R., and Abelmann, A., 1999. Pleistocene radiolarian biostratigraphy in the South China Sea. Science in China (Series D), 42(5):537–543.
Wang, X.-C., Li, Z.-X., Li, X.-H., Li, J., Liu, Y., Long, W.-G., Zhou, J.-B., and Wang, F., 2012. Temperature, pressure, and composition of the mantle source region of late Cenozoic basalts in Hainan Island, SE Asia: a consequence of a young thermal mantle plume close to subduction zones? Journal of Petrology, 53(1):177–233. http://dx.doi.org/10.1093/petrology/egr061
Zhang, G., Smith-Duque, C., Tang, S., Li, H., Zarikian, C., D’Hondt, S., Inagaki, F., and IODP Expedition 329 Scientists, 2012. Geochemistry of basalts from IODP Site U1365: implications for magmatism and mantle source signatures of the mid-Cretaceous Osbourn Trough. Lithos, 144–145:73–87. http://dx.doi.org/10.1016/j.lithos.2012.04.014
Zhang, G., Zeng, Z., Yin, X., Wang, X., and Chen, D., 2009. Deep fractionation of clinopyroxene in the East Pacific Rise 13°N: evidence from high MgO MORB and melt inclusions. Acta Geologica Sinica, 83(2):266–277. http://dx.doi.org/10.1111/j.1755-6724.2009.00030.x
Zhang, G.-L., Chen, L.-H., and Li, S.-Z., 2013. Mantle dynamics and generation of a geochemical mantle boundary along the East Pacific Rise—Pacific/Antarctic Ridge. Earth and Planetary Science Letters, 383:153–163. http://dx.doi.org/10.1016/j.epsl.2013.09.045
Zhang, G.-L., Zong, C.-L., Yin, X.-B., and Li, H., 2012. Geochemical constraints on a mixed pyroxenite–peridotite source for East Pacific Rise basalts. Chemical Geology, 330–331:176–187. http://dx.doi.org/10.1016/j.chemgeo.2012.08.033
Zijderveld, J.D.A., 1967. AC demagnetization of rocks: analysis of results. In Collinson, D.W., Creer, K.M., and Runcorn, S.K. (Eds.), Methods in Palaeomagnetism: Amsterdam (Elsevier), 254–286.
1Li, C.-F., Lin, J., Kulhanek, D.K., Williams, T., Bao, R., Briais, A., Brown, E.A., Chen, Y., Clift, P.D., Colwell, F.S., Dadd, K.A., Ding, W., Hernández-Almeida, I., Huang, X.-L., Hyun, S., Jiang, T., Koppers, A.A.P., Li, Q., Liu, C., Liu, Q., Liu, Z., Nagai, R.H., Peleo-Alampay, A., Su, X., Sun, Z., Tejada, M.L.G., Trinh, H.S., Yeh, Y.-C., Zhang, C., Zhang, F., Zhang, G.-L., and Zhao, X., 2015. Site U1431. In Li, C.-F., Lin, J., Kulhanek, D.K., and the Expedition 349 Scientists, Proceedings of the International Ocean Discovery Program, 349: South China Sea Tectonics: College Station, TX (International Ocean Discovery Program). http://dx.doi.org/10.14379/iodp.proc.349.103.2015
2Expedition 349 Scientists’ addresses.
Figure F1. A. Bathymetric map of South China Sea region. Solid yellow circles = Expedition 349 sites. Solid pink circles = ODP Leg 184 sites. Yellow dashed line = inferred continent/ocean boundary, blue lines = fossil South China Sea spreading center, white-flagged line = Manila Trench. B. Detailed bathymetry around Site U1431 (red box in A) showing nearby bathymetric highs and the Manila Trench.
Figure F2. Shaded map of magnetic anomalies near Site U1431 (data from Ishihara and Kisimoto, 1996). Black lines mark 3000 m isobaths outlining the seamounts. Symbols are magnetic anomaly picks from Briais et al. (1993).
Figure F3. A. Regional contoured bathymetric map showing seismic reflection profiles (orange, red, and blue lines) and the location of Site U1431. Contour interval = 100 m. B. Seismic profile Line 973SCSIO01e with location of Site U1431. CDP = common depth point. Green line = interpreted top of basement, black line = interpreted fault with arrows indicating displacement direction.
Figure F5. Synthesis sedimentary log of Site U1431 stratigraphy showing combined recovery in Holes U1431D and U1431E.
Figure F6. Correlation of lithostratigraphic units with magnetic susceptibility and reflectance spectroscopy (after 40-point running average), Site U1431.
Figure F7. Silty sand in Hole U1431D, Unit I, consisting mainly of quartz, feldspar, amphibole, mica, volcanic glass, and foraminifers (7H-2, 32 cm).
Figure F9. Deepwater trace fossil assemblage of the Nereites ichnofacies, Hole U1431D, Unit III (31X-4A, 12–26 cm).
Figure F10. Thin silt turbidite with prominent pyrite concretion, Hole U1431D, Unit IV (42X-3A, 32–37 cm).
Figure F11. Normally graded calcareous turbidite with foraminifer-rich sandy base grading upward into silt and nannofossil ooze, interbedded with bioturbated clays below and laminated quartzose silts above, Hole U1431D, Unit V (43X-4A, 43–59 cm).
Figure F13. Black volcanic sandstone within the breccia sequence, Hole U1431E, Unit VI (16R-2, 67–70 cm). A. Moderately well sorted texture showing scattered dark grains that give the sandstone its color. B. Magnified image showing opaque grains, some of which are basaltic glass fragments, within the overall framework of volcanic glass and lithic and quartz grains with a clay matrix.
Figure F14. Base of a graded sandstone, Hole U1431E, Unit VI (14R-6, 45–48 cm). Sand is only moderately sorted and is rich in volcanic rock fragments and glass. Minor amounts of quartz are apparent in the cross-polarized image. A. Plane-polarized light (PPL). B. Cross-polarized light (XPL).
Figure F15. Volcanic breccia, Hole U1431E, Unit VI (7R-2, 75–78 cm). A. Low-magnification view highlighting poor sorting and diverse clast assemblage (PPL). B. Close-up showing plagioclase-phyric volcanic rock clasts and a large feldspar grain (XPL). C. Clasts of volcanic rock with clusters of plagioclase and pyroxene (left) and plagioclase alone (right) (XPL).
Figure F16. Sand deposited in high-energy flow conditions, Hole U1431E, Unit VI (22R-4A, 59–71 cm). Note the cross-lamination and small-scale load structures on the base of the upper laminated turbidite sandstone. Lowermost claystone shows burrowing.
Figure F17. Greenish gray siltstone in Hole U1431E, Unit VI, showing lamination and steep dips as a result of soft-sediment deformation during slumping (14R-3A, 76–87 cm).
Figure F18. Carbonate interbed within volcanic breccia, Hole U1431E, Unit VI (9R-5, 30–32 cm). A. Fine-grained micritic matrix with planktonic foraminifers, together with occasional opaque minerals. B. Close-up showing fine-grained texture and both broken and whole planktonic foraminifer shells.
Figure F19. Claystone (Unit VIII) immediately overlying the uppermost lava flows of Unit IX, Hole U1431E (36R-3A, 27–36 cm). These fine-grained sedimentary rocks contain common volcanic ash shards and are interbedded with reworked claystone breccia with variable but subsidiary amounts of basaltic lava clasts.
Figure F20. Unit X sediment, Hole U1431E. A. Clasts of angular basalt surrounded by reaction halos in claystone breccia (45R-2A, 82–91 cm). B. Breccia entirely dominated by intraformational clasts (45R-1A, 49–59 cm).
Figure F21. Sharp, reverse-graded base of a breccia layer, Hole U1431E, Unit VII (27R-6A, 115.5–124 cm). The breccia layer overlies dark greenish gray clay with moderate to heavy bioturbation. 16
Figure F22. Top of a breccia layer and cryptic contact with overlying laminated sandstone, Hole U1431E (18R-2A, 23–43 cm). Both units have similar composition.
Figure F23. Foraminifer test in the breccia matrix, Hole U1431E, Unit VI (18R-3A, 34–36 cm). The white crystals are plagioclase, and the gray areas are epoxy. The glassy basalt clasts are dark under XPL.
Figure F25. Calcareous nannofossils (XPL). A. Overgrown specimen of Sphenolithus (arrow) and several pieces of calcite debris (U1431E-22R-3, 0–2 cm; 750.90 mbsf). B. Broken fragments of Discoaster (arrows) (U1431D-60X-CC; 554.09 mbsf).
Figure F26. Planktonic foraminifers, Hole U1431E (reflected light). A. Two poorly preserved or broken specimens of Globigerinoides sacculifer s.l. (24R-CC; 773.31 mbsf). B. Poorly preserved specimen of Sphaeroidinellopsis seminulina (25R-CC; 779.32 mbsf).
Figure F27. Broken and recrystallized radiolarian specimens, Hole U1431E. A. 36R-5, 12–16 cm (889.83 mbsf; PPL). B. 45R-4, 26–28 cm (966.33 mbsf; SEM). C. Broken and recrystallized specimen of Calocycletta costata in 45R-2, 128–130 cm (964.5 mbsf; SEM).
Figure F28. Radiolarians (A) Didymocyrtis prismatica and (B) Calocycletta costata (U1431E-45R-3, 9–11 cm; 965.72 mbsf; SEM).
Figure F29. Lithostratigraphic summary of igneous rocks and their lithologic features, Hole U1431E. Lithostratigraphy column includes lithology, igneous lithologic units (1–13), and lithostratigraphic units (VII–XI).
Figure F30. Volcaniclastic rocks, Hole U1431E. A. Heterolithic volcaniclastic breccia overlying claystone with silt (12R-1A, 5–18 cm; Unit VI). B. Dark greenish gray to black sand- and siltstone showing cross-lamination (28R-5A, 0–13 cm; Unit VII). C. High-energy sandstone turbidite (faintly laminated) above claystone (22R-2A, 90–103 cm; Unit VI).
Figure F31. Clast types and crystal fragments in volcaniclastic breccia, Hole U1431E, Units VI and VII. plg = plagioclase, bio = biotite, g = glass, cpx = clinopyroxene. A. Type 1: non- to sparsely vesicular aphyric basalt clast, often microcrystalline or glassy in groundmass and angular to subangular (12R-3, 0–3 cm; TS15; PPL). B. Type 2: highly vesicular aphyric basalt clast, 3 cm × 2 cm, with unfilled to completely filled vesicles (21R-1, 12–14 cm; TS36; PPL). C. Types 3 and 6: plagioclase crystal fragments and biotite flakes as part of volcanic breccia matrix (27R-2, 98–100 cm; TS39; XPL). D. Type 1: fresh angular glass shard with 2 (faint) plagioclase microlites in volcanic breccia matrix (9R-2, 59–62 cm; TS6; PPL). E. Type 2: scoria clast with plagioclase phenocrysts showing sharp but intact vesicle-wall breakage points, indicating very limited transport from the volcanic source (30R-1, 91–94 cm; TS44; PPL). F. Type 2: plagioclase-phyric scoria clast with palagonite replacing glassy matrix and infilling vesicles (7R-2, 75–78 cm; TS2; PPL). G. Type 4: subangular basalt clast with trachytic texture (10R-4, 116–118 cm; TS12; PPL). H. Type 5: highly banded pumice clast (11R-2, 67–70 cm; TS13; PPL). I. Type 6: clinopyroxene crystal fragment (29R-5, 114–117 cm; TS43; PPL).
Figure F32. Basement basalt, Hole U1431E, Unit IX. A. Olivine-phyric basalt with glassy rim (37R-1A, 0–23 cm; Unit 1). B. Amygdaloidal microcrystalline basalt (41R-1A, 40–63 cm; Unit 5). C. Coarse-grained aphyric basalt (41R-8A, 20–43 cm; Unit 6).
Figure F33. Groundmass grain size increasing from top to bottom in ~26.7 m thick massive basalt flow, Hole U1431E, Unit IX, Unit 6. Top: 37R-1, 5–7 cm; TS31. Middle: 38R-2, 19–21 cm; TS33. Bottom: 41R-8, 0–2 cm; TS51. A. PPL. B. XPL.
Figure F34. Basalt, Hole U1431E, Units IX and XI (XPL). A. Unaltered equant olivine microphenocrysts in groundmass containing plagioclase and clinopyroxene (38R-2, 19–21 cm; TS33). B. Anhedral clinopyroxene interstitial to long-prismatic sheaves of plagioclase (41R-8, 0–2 cm; TS51). C. Variolitic growth texture of plagioclase around a cluster of equant olivine microphenocrysts (46R-1, 60–62 cm; TS56). D. Long-prismatic plagioclase habit with a single row of (melt) inclusions in interior and parallel to x-axis, indicative of fast crystallization during relatively fast cooling of this basalt magma (46R-1, 60–62 cm; TS56).
Figure F35. Basalt with variolitic textures and abundant plagioclase laths or needles, Hole U1431E. A, B. 46R-1, 60–62 cm (Unit XI); TS57. C, D. 41R-1, 37–40 cm (Unit IX); TS47. (A, C) PPL, (B, D) XPL.
Figure F36. Ropy flow top, Hole U1431E, Unit IX (44R-1, 0–8 cm; Unit 7). A. Top view showing ropy surface morphology. B. Side view showing limited thickness (<5 mm) of the chilled margin.
Figure F38. Alteration styles and veins, Hole U1431E. A. Background alteration vs. relatively unaltered medium-grained aphyric basalt in ~26.6 m thick massive lava (Unit 13; 49-R-2A, 13–27 cm). B. Carbonate and Fe oxide veins and related alteration halos overprinting background alteration (Unit 5; 41R-2A, 25–40 cm). C. Magnetite vein and related alteration halos overprinting background alteration (Unit 6; 43R-2A, 67–80 cm).
Figure F39. Basalt alteration, Hole U1431E (XPL). A. Vesicle filled with saponite (Sap) only (46R-3, 39–41 cm; TS57). B. Vesicle filled with saponite first, then carbonate (Carb) (43R-3, 91–94 cm; TS54). C. Vesicle filled with celadonite (Cela) first, then saponite and carbonate (50R-6, 0–3 cm; TS63). D. Olivine (Ol) replaced by saponite (37R-1, 5–7 cm; TS31). E. Plagioclase replaced by saponite (41R-2, 26–28 cm; TS48). F. Carbonate vein (41R-2, 26–28 cm; TS48).
Figure F41. Straight vein infilled along preexisting fracture (top) and reactivated fracture along the vein (below) (U1431E-41R-5A). A. Core image. B. Interpretation.
Figure F42. Fracture with ~1 cm offset in U1431E-45R-2A. A. Core image. B. Interpretation. White line is the fracture, and arrows indicate offset direction.
Figure F43. A typical curved and radiating vein network showing the development of fractures during the magma cooling process and later calcite infilling (U1431E-41R-2A). A. Core image. B. Interpretation.
Figure F44. Interstitial water sulfate, alkalinity, ammonium, and phosphorous, Holes U1431A (red) and U1431D (black). Blue dashed line = modern seawater value.
Figure F45. Interstitial water calcium, magnesium, strontium, and boron, Holes U1431A (red) and U1431D (black). Blue dashed lines = modern seawater values.
Figure F46. Interstitial water bromide, chloride, sodium, and potassium, Holes U1431A (red) and U1431D (black). Blue dashed lines = modern seawater values.
Figure F47. Interstitial water iron, manganese, lithium, and silica, Holes U1431A (red) and U1431D (black). Blue dashed line = modern seawater value.
Figure F51. Bulk sediment major and minor elements, Hole U1431D. Colored boxes denote lithostratigraphic units.
Figure F52. Discriminant function diagram for provenance signatures of sandstone-mudstone suites (after Roser and Korsch, 1988). Function 1 = 30.638 TiO2/Al2O3 − 12.541 Fe2O3/Al2O3 + 7.329 MgO/Al2O3 + 12.031 Na2O/Al2O3 + 35.402 K2O/Al2O3 − 6.382. Function 2 = 56.600 TiO2/Al2O3 − 10.879 Fe2O3/Al2O3 + 30.875 MgO/Al2O3 − 5.404 Na2O/Al2O3 + 11.112 K2O/Al2O3 − 3.89.
Figure F53. Total alkalis vs. silica diagram, Hole U1431E. Classification of volcanic rock types from Le Maitre et al. (1989). Dashed line divides tholeiitic and alkalic lavas of Hawaii (Macdonald and Katsura, 1964; Macdonald, 1968). Shown for comparison are data for Indian Ocean MORB from the Geochemical Rock Database (georoc.mpch-mainz.gwdg.de), SCS seamounts (Tu et al., 1992; Hékinian et al., 1989), Hainan Island OIB (Wang et al., 2012), and Pacific Ocean MORB (Zhang et al., 2009, 2012a, 2012b, 2013).
Figure F54. A–D. TiO2 vs. P2O5, V, Sc, and Sr, Hole U1431E. Shown for comparison are data for Indian Ocean MORB from the Geochemical Rock Database (georoc.mpch-mainz.gwdg.de), SCS seamounts (Tu et al., 1992; Hékinian et al., 1989), Hainan Island OIB (Wang et al., 2012), and Pacific Ocean MORB (Zhang et al., 2009, 2012a, 2012b, 2013).
Figure F55. Microbiology whole-round and interface samples and contamination testing samples, Site U1431. Numbers next to red squares indicate number of samples taken from those depths.
Figure F56. A–D. Paleomagnetic measurements of NRM inclination and intensity on archive sections after 0 mT (red) and 20 mT (blue) AF demagnetization.
Figure F57. A–F. Representative vector endpoint diagrams (Zijderveld, 1967) for sediment samples through stepwise AF or thermal demagnetizations. All samples display a normal vertical component of drilling-induced magnetization that is reduced or removed after 5 mT demagnetization or by 100°C thermal demagnetization.
Figure F58. Magnetostratigraphic results, Hole U1431D. Paleomagnetic declination and inclination after 20 mT AF demagnetization. Red circles = discrete samples. For polarity and GPTS (Gradstein et al., 2012), black = normal and white = reversed polarity.
Figure F59. Magnetostratigraphic results, Hole U1431E. Paleomagnetic inclination after 20 mT AF demagnetization. Red circles = discrete samples. For polarity and GPTS (Gradstein et al., 2012), black = normal and white = reversed polarity. ?? = uncertainty.
Figure F60. WRMSL P-wave velocity and x-caliper P-wave velocity. Below 63 mbsf, WRMSL P-wave velocities tend to be lower than caliper P-wave velocities. At ~50–63 mbsf, significantly higher WRMSL P-wave velocity values might be related either to sand/sandstone not measured with the caliper or to other unidentified factors.
Figure F61. Physical property summary, Holes U1431D and U1431E. Dashed lines A and B delineate major physical property boundaries. Blue bar marks high magnetic susceptibility zone in sand/sandstone. Arrows indicate magnetic susceptibility peaks associated with ash layers. PWV = P-wave velocity.
Figure F62. WRMSL magnetic susceptibility (MS) and point-measured MS. Point-measured MS is generally 20 × 10−5 SI higher than the WRMSL measurement.
Figure F63. Physical properties of lithostratigraphic Units IX–XI. Note low magnetic susceptibility values in some basalt layers (blue shaded areas).
Figure F64. (A) P-wave velocity and (B) bulk density as a function of porosity above 150 mbsf in Hole U1431D. Red lines = best-fit correlation. Note the linear correlation in B, whereas the correlation in A is best represented by a polynomial.
Figure F66. Hole U1431E downhole logs compared to Hole U1431D discrete sample MAD, P-wave caliper (PWC), lithology, and core recovery data. Equivalent features appear ~5 m shallower in Hole U1431D core data due to a depth shift between the holes. HSGR = standard (total) gamma radiation, HCGR = computed (U-free) gamma radiation, RT = “true” resistivity.
Figure F67. Hole U1431E downhole logs that are dependent on geochemistry and mineralogy of the formation. Hole U1431D lithology is shown for comparison. Blue bars = carbonate-rich sediment layers interpreted from log data (see text and Figure F68). Note that equivalent features appear ~5 m shallower in the Hole U1431D core data. HSGR = standard (total) gamma radiation, PEF = photoelectric effect.
Figure F68. Correlation of carbonate layers using Hole U1431D NGR and magnetic susceptibility to equivalent measurements in Hole U1431E downhole log data from 275 to 310 m WSF. Blue bars = correlation of carbonate layers, yellow bars = correlation of a loose silty sand layer.
Figure F69. Correction of downhole NGR for attenuation through the pipe and the BHA. A multiplier of 5 is used to correct NGR in the BHA, and a multiplier of 3.5 is used for the drill pipe. Attenuation by the thicker drill pipe joints has not been corrected here. Correlation of features in Hole U1431D cores to equivalent features in Hole U1431E log data is also shown. HSGR = standard (total) gamma radiation.
Figure F70. (A) Sonic velocity and (B) two-way traveltime (TWT). TWT was calculated from Hole U1431D P-wave caliper (PWC) velocity between the seafloor and 155 m CSF and Hole U1431E sonic velocity log data (Pass 2) between 155 and 430 m WSF.
Figure F71. Rose diagram showing the NNW–SSE azimuth of the long axis of the borehole cross section, given by the direction of the wider of the 2 borehole diameters recorded by the FMS caliper arms, relative to magnetic north, at 193–443 m WSF, Hole U1431E. Only long axis data 0.5 inch or greater than the short axis are plotted. The short axis of the borehole oval (WSW–ENE) is interpreted to represent the direction of maximum horizontal stress (see text).
Figure F72. APCT-3 temperature-time series with extrapolated formation temperature estimates, Site U1431.
Figure F73. Heat flow calculations, Site U1431. A. APCT-3 sediment temperatures. B. Thermal conductivity data from Hole U1431D (circles and dashed line) with calculated thermal resistance (solid line). C. Bullard plot of heat flow calculated from a linear fit of the temperature data.
Table T1. Coring summary, Site U1431. Download table in .csv format.
Table T2. Depths and ages of calcareous nannofossil events, Holes U1431D and U1431E. Download table in .csv format.
Table T3. Depths and ages of planktonic foraminifer events, Holes U1431D and U1431E. Download table in .csv format.
Table T4. Depths and ages of radiolarian events, Holes U1431D and U1431E. Download table in .csv format.
Table T5. Distribution of calcareous nannofossil species, Holes U1431A, U1431B, and U1431C. Download table in .csv format.
Table T6. Distribution of calcareous nannofossil species, Hole U1431D. Download table in .csv format.
Table T7. Distribution of calcareous nannofossil species, Hole U1431E. Download table in .csv format.
Table T8. Distribution of planktonic foraminifer species, Holes U1431A, U1431B, and U1431C. Download table in .csv format.
Table T9. Distribution of planktonic foraminifer species, Hole U1431D. Download table in .csv format.
Table T10. Distribution of planktonic foraminifer species, Hole U1431E. Download table in .csv format.
Table T11. Distribution of radiolarian species, Hole U1431D. Download table in .csv format.
Table T12. Distribution of radiolarian species, Hole U1431E. Download table in .csv format.
Table T13. Interstitial water major element concentrations, ammonium, alkalinity, bromide, calcium, chlorine, magnesium, pH, phosphate, potassium, salinity, sodium, and sulfate, Holes U1431A and U1431D. Download table in .csv format.
Table T14. Interstitial water minor element concentrations, boron, barium, iron, lithium, manganese, strontium, and silica, Holes U1431A and U1431D. Download table in .csv format.
Table T15. Hydrocarbon concentrations of headspace gas, methane and ethane, Holes U1431A and U1431D. Download table in .csv format.
Table T16. Inorganic carbon, total carbon, TOC, carbonate, and total nitrogen concentrations and C/N ratios, Holes U1431A, U1431D, and U1431E. Download table in .csv format.
Table T17. Major element oxide and trace element contents of sedimentary samples, Hole U1431D. Download table in .csv format.
Table T18. Major element oxide and trace element contents of igneous rock samples and clasts from volcaniclastic breccia, Hole U1431E. Download table in .csv format.
Table T19. Reference values for magnetic susceptibilities (Clark and Emerson, 1991) and natural gamma radiation (Russell, 1944) in different lithologies used during Expedition 349. Download table in .csv format.
Table T20. Advanced piston corer temperature tool (APCT-3) measurements in Hole U1431D. Download table in .csv format.