Li, C.-F., Lin, J., Kulhanek, D.K., and the Expedition 349 Scientists, 2015
Proceedings of the International Ocean Discovery Program Volume 349
publications.iodp.org

doi:10.14379/iodp.proc.349.107.2015
Site U14351
C.-F. Li, J. Lin, D.K. Kulhanek, T. Williams, R. Bao, A. Briais, E.A. Brown, Y. Chen, P.D. Clift, F.S. Colwell, K.A. Dadd, W.-W. Ding, I. Hernández-Almeida, X.-L. Huang, S. Hyun, T. Jiang, A.A.P. Koppers, Q. Li, C. Liu, Q. Liu, Z. Liu, R.H. Nagai, A. Peleo-Alampay, X. Su, Z. Sun, M.L.G. Tejada, H.S. Trinh, Y.-C. Yeh, C. Zhang, F. Zhang, G.-L. Zhang, and X. Zhao2
Keywords: International Ocean Discovery Program, IODP, JOIDES Resolution, Expedition 349, Site U1435, South China Sea, continent/ocean boundary, continental breakup, synrift sediment, microbiological community, seafloor spreading, unconformity, benthic foraminifers, shallow-marine deposits, manganese nodule
MS 349-107: Published 30 March 2015
Background and objectives
Coring at Site U1435 became a high priority after failing to achieve our basement objectives at Site U1432 because the final cementing operation compromised the reentry system. This site was originally added as an alternate because of the high risk of being unable to reach basement at Site U1432, which required ~1900 m of penetration to reach the target depth.
Site U1435 is located on a structural high at the transition between the extended continental crust and the oceanic crust (Figures F1, F2). Similar conspicuous structural-high features can be found on the continent/ocean boundary in many other seismic profiles crossing the South China Sea northern margin and therefore appear to represent tectonic structures typical of the area. The true lithology and formation mechanism of this structural high were speculative; it could be a volcanic extrusion associated with continental extension at the onset of seafloor spreading, lower crust material emplaced from preferential lower crust extension, exhumed mantle material, or a structural high composed of older (Mesozoic) sedimentary rocks. Coring at this location was designed to help pinpoint the exact nature of this structure and improve our understanding of early continental breakup, the rift-to-drift transition, and seafloor spreading processes.

Figure F1. SCS regional bathymetry.
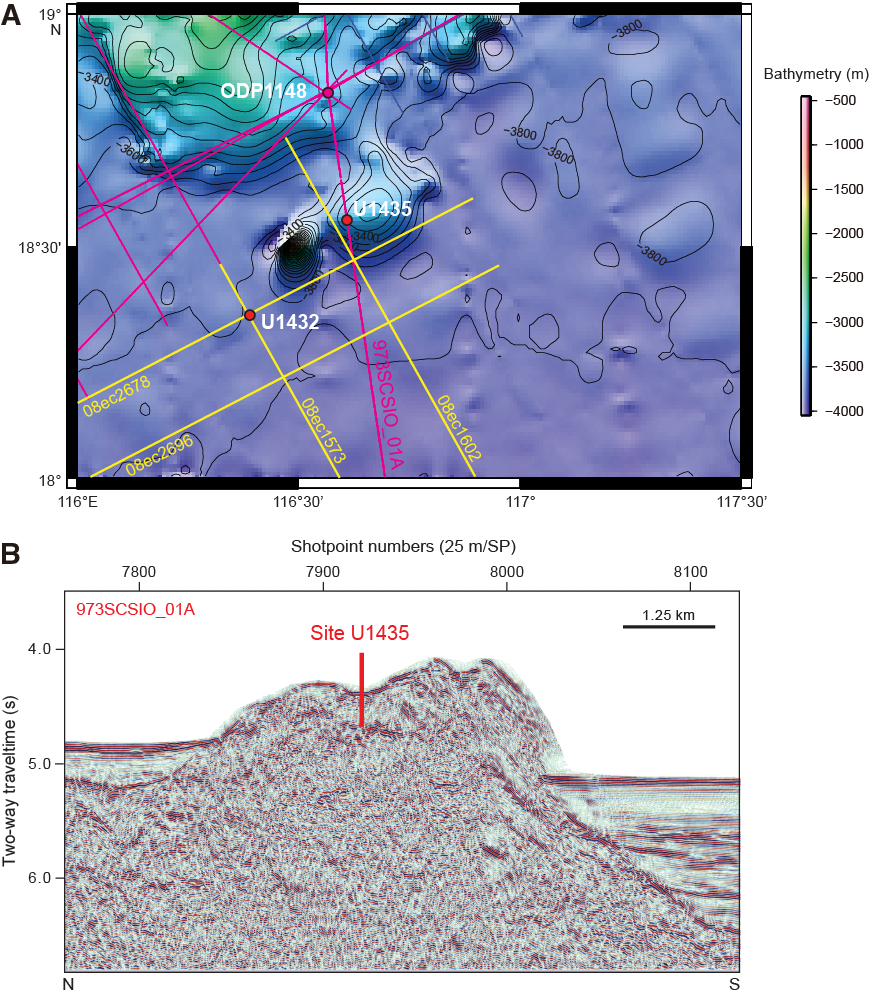
Figure F2. Regional contoured bathymetry.
Operations
Site U1435 (proposed Site SCS-6C) was an alternate site selected when we were unable to reach our basement objectives at Site U1432. Because we anticipated shallow Cenozoic sediment cover (~10 m) above the acoustic basement, we conducted a 3.5 kHz sonar survey to select a location with maximum sediment thickness to help stabilize the drill string when trying to penetrate basement with thin sediment cover in rough weather. After reaching basement, the plan was to core as deeply into basement as time permitted. Cenozoic sediment thickness was greater than expected based on the seismic interpretation. Hole U1435A was cored with the rotary core barrel (RCB) to a final depth of 300.0 m below seafloor (mbsf) when time allocated to the expedition expired (Table T1). The RCB was deployed 32 times, recovering 171.37 m of core over 300.0 m of penetration (57.1% recovery).
Table T1. Coring summary, Site U1435. Download table in .csv format.
Transit to Site U1435
After a 336 nmi transit lasting 39.65 h, the vessel arrived at Site U1435 and switched into dynamic positioning mode at 1524 h (UTC + 8 h) on 24 March 2014. At 2045 h, an acoustic positioning beacon was deployed. The position reference was a combination of GPS signals and a single acoustic beacon.
Hole U1435A
After arriving on site and deploying the acoustic positioning beacon, an RCB bottom-hole assembly (BHA) was assembled with a new RCB C-7 bit. The core barrels were spaced out at the surface, and the 172.07 m BHA was assembled. The BHA was then run in the hole to 3214.9 m below rig floor (mbrf), and the top drive was picked up and spaced out to 3261.6 mbrf to spud Hole U1435A. While lowering the drill pipe, we conducted a sonar survey with the 3.5 kHz array sonar to select a hole location to maximize sediment thickness. Hole U1435A was spudded at 0035 h on 25 March 2014. The estimated depth of the seafloor was 3261.6 mbrf using the precision depth recorder. Final seafloor depth for the hole was 3264.0 mbrf (3252.5 m below sea level [mbsl]), which was determined by tagging the seafloor with the drill bit. We advanced Hole U1435A by coring from the seafloor to 3564.0 mbrf (300.0 mbsf). Microspheres were deployed in each RCB core catcher sub from Core 349-U1435A-5R to total depth. Coring continued to Core 32R (300 mbsf), when operational time for the expedition expired. Penetration rates varied from 2.8 to 58.2 m/h over the cored interval. Total depth of Hole U1435A was reached at 0730 h on 27 March. After reaching total depth, the final core was pulled to the surface and laid out. At the completion of coring Hole U1435A, 32 RCB cores had been cut over a 300.0 m interval, recovering 171.37 m of core (57.1% recovery).
After reaching total depth and laying out the last core, the drill string was pulled out of the hole with the top drive to 3535.1 mbrf (271.1 mbsf). The drilling knobbies were laid out, the top drive set back, and the drill string tripped to the surface. The bit cleared the seafloor at 1020 h and then cleared the rotary table at 1835 h. After securing the rig floor for transit and pulling the hydrophones and thrusters, the vessel switched to cruise mode and began the transit to Keelung, Taiwan, at 1900 h on 27 March. Total time spent in Hole U1435A was 75.5 h (3.2 days). Expedition 349 officially ended with the first line ashore in Keelung at 0710 h on 30 March.
Lithostratigraphy
Lithostratigraphic units
Three lithostratigraphic units are defined within the cored sequence at Site U1435 based on a combination of visual core description and smear slide and thin section inspection, as well as scanning for an array of physical properties, including magnetic susceptibility and color spectra (see Lithostratigraphy and Physical properties in the Methods chapter [Li et al., 2015], for details). All three units are sedimentary (Figures F3, F4). The site is located on a structural high where sedimentation rates might be expected to be lower than normal. Subunit IA is composed of greenish gray clayey nannofossil ooze and manganese nodules. Subunit IB is composed of nannofossil-rich claystone, clay with nannofossils, and claystone with nannofossils. Unit II is a sequence of dark gray silty sandstone with minor interbeds of very dark gray siltstone. Unit III is composed of dark gray silty sandstone and significant thicknesses of dark gray claystone with silt.
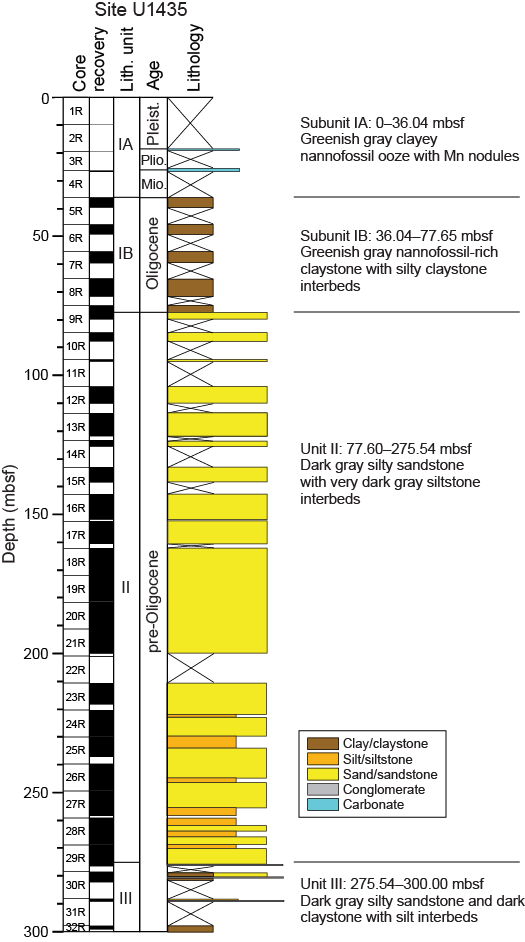
Figure F3. Lithostratigraphy summary.
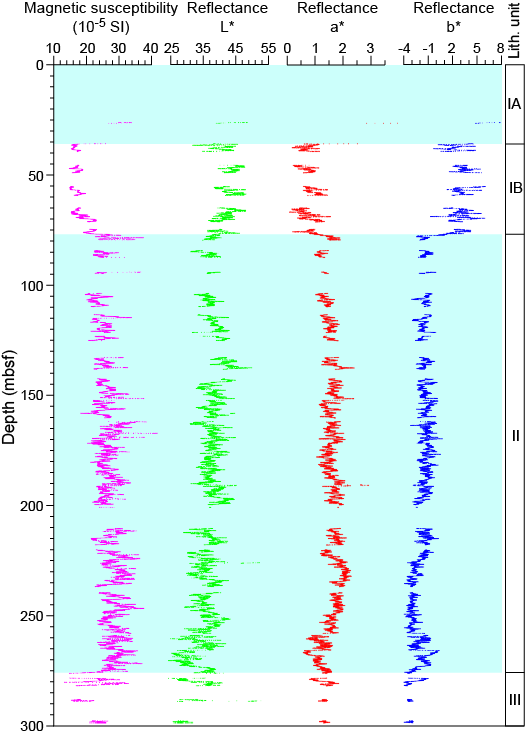
Figure F4. Lithostratigraphic units and magnetic susceptibility.
Unit descriptions
Unit I (0–77.65 mbsf)
Unit I is a hemipelagic sedimentary deposit with a mixture of continentally derived clays and biogenic microfossils, especially nannofossils. Sedimentation was in deep water, not fundamentally different from the modern setting. However, because sediment did accumulate, the site must not have been continually swept by bottom currents as it is now by westward-moving flow related to the influx from the Pacific through the Luzon Strait (Wang et al., 2011). This period of accumulation was one with sediment starvation and manganese nodule formation, possibly linked to a change in current regime keeping the site free of clastic sediment. Very little sediment of Oligocene–Pleistocene age was recovered. Therefore, it is not apparent if sedimentation was actually slow during this entire period or whether more hemipelagic sediment had accumulated but was subsequently removed by current activity after the Miocene.
Subunit IA (0–36.04 mbsf)
The youngest sediment at this site was likely not recovered either because of poor recovery by RCB coring in soft sediment or because of Mn nodules blocking the core catchers. Core 349-U1435A-1R recovered a tiny amount of clay, whereas Section 3R-1 contained very hard manganese nodules with a typical lobate appearance (Figure F5). These deposits are typically associated with very low sedimentation rates, as the manganese is precipitated directly from seawater and is unable to form except in sediment-starved settings (Cronan, 1980). Manganese crusts normally grow at rates of 0.5–4.0 mm/million years (Cronan, 1980), so the amount of time represented by these nodules could be significant. Recovery of these nodules indicates that sedimentation rates at Site U1435 were very low in the most recent past, further evidence that the position of the drill site on a structural high allowed currents to remove hemipelagic sediment from the area (Hu et al., 2000). Manganese nodules are also found in Cores 4R and 5R, but these are likely fragments that have fallen into the hole from shallower depths.
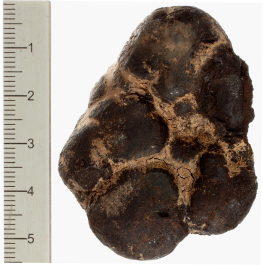
Figure F5. Manganese nodule.
Below the manganese nodules in Core 3R, the character of Subunit IA is based on only a single core with a recovery of 47 cm. The lithology is dominated by massive clayey nannofossil ooze with a few Planolites trace fossils visible on the cut surface.
Subunit IB (36.04–77.65 mbsf)
Subunit IB spans five cores with poor recovery and is composed of mostly greenish gray nannofossil-rich clay and lesser quantities of greenish gray claystone, silty claystone, and claystone with silt. Core 349-U1435A-5R contains interbedded silty claystone and claystone with silt intervals, but deeper in the section the sediment becomes more calcareous, with an increase in the proportion of nannofossils. The nannofossil-rich claystone, clay with nannofossils, and claystone with nannofossils are largely massive and homogeneous, but strong biscuiting over this interval may obscure some features. In more coherent sections, the sediment is heavily bioturbated with trace fossils of the Nereites ichnofacies. Figure F6 shows examples of the three burrow types most commonly observed in Subunit IB, Chondrites, Planolites, and less commonly Thalassinoides. The first two in particular are typical of sedimentation below 2500 m water depth (Ekdale et al., 1984).
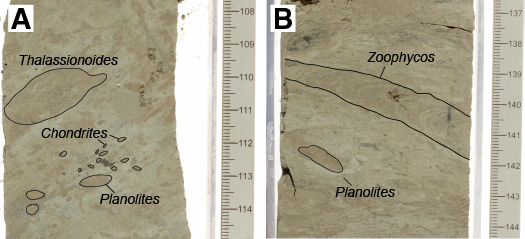
Figure F6. Burrows.
Subunit IB sediment often shows decimeter-scale color banding caused by changing proportions of clay versus nannofossils. In Core 349-U1435A-7R, two thin intervals of very light colored sediment are noted (Figure F7). The larger of these is ~4 cm thick and has both a sharp top and base and is almost pure white. The interior of this interval is faintly laminated, but no internal grading is observed. Smear slide analysis indicates that this layer is composed of clay, but without X-ray diffraction (XRD) analysis we were unable to tell what specific minerals may be present. Nonetheless, such a pure deposit without significant contamination from other sources represents a depositional anomaly of unknown origin at that time.
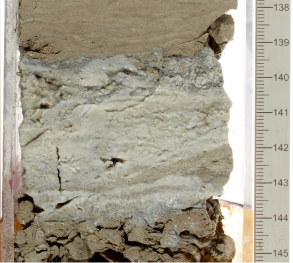
Figure F7. White clay layer.
Figure F8 shows a typical example of a smear slide from Subunit IB. The bulk of the sediment is clay and nannofossils, but smaller amounts of volcanic glass (both felsic and darker mafic compositions), opaque materials, broken fragments of foraminifer tests, rare silt-sized grains of quartz, and rock fragments (usually quartz bearing) are also seen. The sediment is all fine grained but not well sorted. Subunit IA is essentially similar but with more nannofossils and slightly less clay.
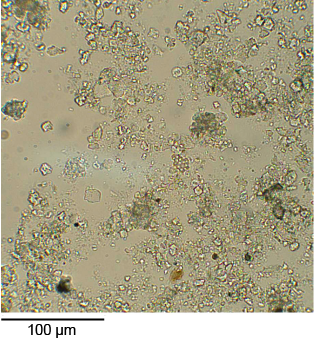
Figure F8. Clay with nannofossil ooze.
The composition of Subunit IB changes a few meters above the basal contact with an underlying carbonate that forms the top of underlying Unit II. Nannofossils are generally abundant throughout Subunit IB but become rare toward the base of the subunit, whereas clay over this interval contains larger amounts of euhedral crystalline calcite, with grains typically 3–8 µm across (Figure F9). Calcite makes up a significant proportion of the total sediment volume. Both calcite crystals and nannofossils are found in some samples (Figure F9B). We suggest that the disappearance of calcareous microfossils and the presence of pristine crystalline calcite are linked, representing dissolution of the fossils toward the unit base and the precipitation of calcite during early diagenesis.

Figure F9. Clay with calcite crystals.
Unit II (77.65–275.54 mbsf)
Most of the drilled section at Site U1435 is represented by the dominantly sandy sediment of Unit II. The division between Units I and II is marked by a carbonate cap rock spanning interval 349-U1435A-9R-2A, 135–141 cm (Figure F10A), with a few disrupted pieces of this material floating in the underlying sands likely caused by drilling. We recognize that the Unit I/II boundary may be more complex because there is a sharp but contorted interface at Section 9R-2A, 70 cm, where muddy and more calcareous material changes downsection to clayey sandy sediment just above the carbonate. We place the boundary at the top of the carbonate because it is easy to identify and likely represents a hiatus in the sedimentation history, whereas the overlying sand may represent sediment reworking or gradual environmental changes. In thin section, the carbonate is fine grained and dominated by microcrystalline calcite with small, rounded pods of crystalline calcite floating in the medium-gray background sediment (Figure F10B). There are also minor amounts of brown and opaque materials of unknown composition.
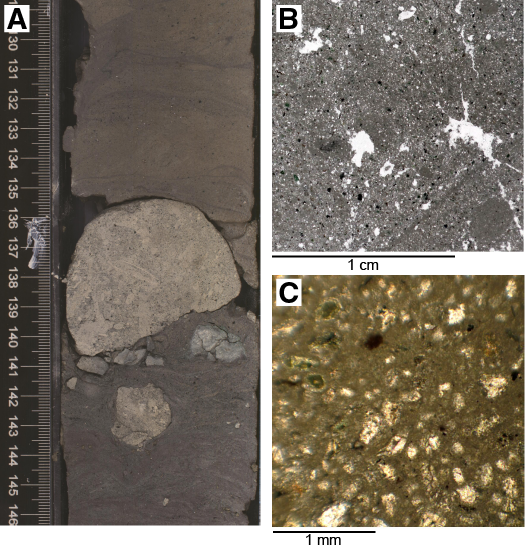
Figure F10. Carbonate rock.
Given the location of the carbonate at the boundary between two contrasting facies and the distinctly different lithology, we consider this carbonate to be a hardground-type deposit, representing a lengthy period of no or very slow accumulation. The carbonate must have accumulated at a time of minimal clastic sedimentation, and its highly cemented character is unusual compared to the sediment above and below. The major change in composition between Units I and II can be explained by a switch in depositional environment. Although the magnetostratigraphy does not require a significant hiatus, the sedimentary evidence would be supportive of a break of up to millions of years.
The bulk of Unit II is composed of dark gray silty sandstone, mostly medium sand sized and thick bedded with very little carbonate. The sandstone is better cemented than the Unit I nannofossil-rich clay and increases in lithification downhole. Although coarse sandstone is seen, it is minor, and pebble conglomerate is only recovered in Section 29R-CC (Figure F11). The sediment is thus more proximal than in Unit I but is still moderately distal from the source because the grain size of the vast majority of the sediment is not very coarse. This is indicative of current sorting over moderate transport distances, possibly only on the order of tens of kilometers. Larger clasts are very rare, with the exception of a subrounded, 2.5 cm wide clast of limestone (interval 15R-1A, 29–32 cm; Figure F12B), which is very similar to that seen at the top of the unit. This clast was found significantly below the top contact, so we do not think that it represents downhole contamination, although that remains a possibility. Alternatively, the carbonate clast could be the product of reworking laterally across the basin during sedimentation or erosion from an outcrop of limestone not far from the basin edge.
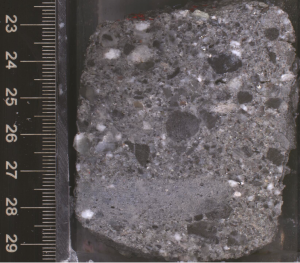
Figure F11. Conglomerate bed.
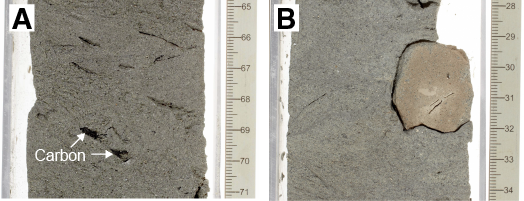
Figure F12. Carbon fragments in limestone.
A more typical feature of Unit II is the common observation of dispersed black carbon fragments within the massive gray sandstone (Figure F12A). These dispersed fragments do not represent a large proportion of the total lithology but are common throughout the coarser sediment of the unit, with fragments often >5 mm across and sometimes as much as 15 mm across. The fragments appear to be generally dispersed and not preferentially concentrated into layers or burrows.
Sandstone is by far the most abundant lithology in this unit, particularly at the top of the unit, but there are also fine-grained rocks. Figure F13A shows an example of a relatively continuous sequence of clayey siltstone overlain sharply by fine sandstone. The clayey siltstone shows faint laminations and is marked by minor Planolites-type burrows. These are most visible toward the top of the section where burrowing has placed sand of contrasting color into these structures so that they stand out against the darker background.
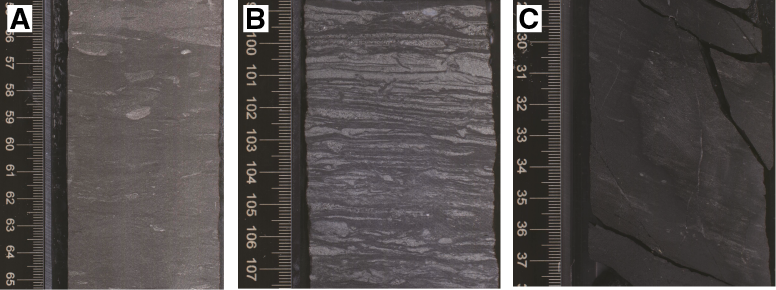
Figure F13. Finer grained facies.
Alternation of fine and coarser grain sizes can be found intermittently through the unit. Figure F14A shows an example where silty claystone is interbedded with laminated sandstone. In this example, the general sedimentary layering has been further disrupted by bioturbation, which results in an interfingering geometry between the two lithologies, with claystone being in the minority. Current activity is implied throughout Unit II because of the common grain orientation lamination, even in the massive sandstone, and in some cases erosion and reactivation surfaces are visible in the core. Figure F14B shows where darker colored, parallel-laminated silty sandstone is lying with an erosional contact on top of lighter colored, coarser grained, more massive sandstone. Although these surfaces are not common, they do indicate that depositional environments associated with Unit II were high energy and included erosion as well as deposition. The sandstone shows cycles of both fining upward into silty sandstone or claystone and coarsening upward. These grain size–related cycles span several meters of section and could represent a response to varying sea level, with coarser grained sediment associated with higher energy after a sea level fall in a shallow-marine setting. Alternatively, the cycles may reflect a simple switching of sediment supply.
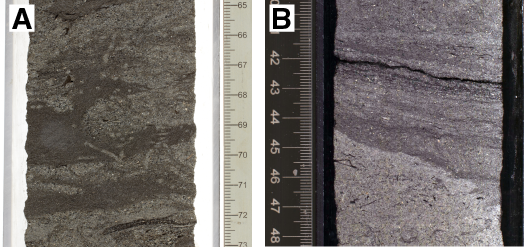
Figure F14. Sandstone.
The thickest section of fine-grained sediment can be found right at the base of Unit II where >1 m of very dark gray, massive, poorly laminated claystone was recovered. This sediment appears to be relatively organic rich and less bioturbated than other units, as there is little color contrast to pick out the burrows. This lithology suggests sedimentation in a lower energy setting compared to the high-energy sandstone that dominates the rest of the section, but this could simply represent the effects of local sediment bypassing or abandonment of a channel.
Almost all the sediment recovered in Unit II shows some form of mostly shallow marine bioturbation, with common Planolites (Figure F15A) and abundant Thalassinoides (Figure F15B), as well as some vertical or subvertical burrows ~5–10 mm across. We interpret this assemblage to indicate sedimentation in an environment with a soft seafloor and probably one in relatively shallow water (<100 m) and high-energy conditions, such as the Cruziana ichnofacies (Ekdale et al., 1984). In contrast to overlying Unit I, we note that there are almost no Chondrites, and we see a dominance of the larger Thalassinoides. Much of the sand is quite intensively burrowed, suggesting a relatively productive environment with an active and flourishing fauna. These trace fossils can be seen throughout the unit and underline the marine character of the sedimentation.
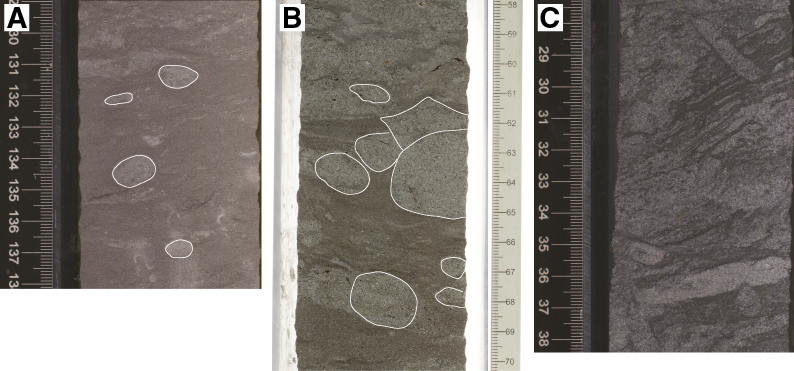
Figure F15. Bioturbated silty sandstone.
There is a significant amount of evidence to show that sedimentation likely occurred in near-shore, shallow-marine conditions. As well as the organic carbon mentioned above, there are examples of broken shelly material throughout much of the sandstone, albeit much of it broken into small pieces (<2 mm) and disseminated throughout the sediment; however, some larger and more coherent fragments are observed. Figure F16A shows an example of a large bivalve shell surrounded by the background sandstone. This is in contrast to the example seen in Figure F16B, where the bivalve shell is surrounded by orangeish pink sandstone and forms a clast that has been eroded from an earlier sedimentary deposit. This is not so dissimilar to the limestone clast seen in Figure F12B, providing evidence for significant reworking into the basin. Nonetheless, there is plenty of evidence for a bivalve community living either at or near the site because several of the shells are not broken and have both valves in place. We presume that the fragmented shell material represents the breakdown of more distally derived material that is abraded during transport.
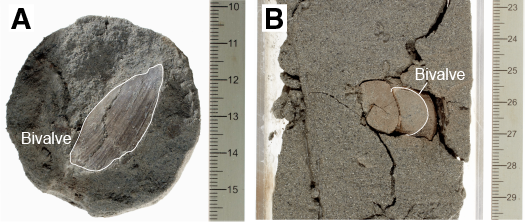
Figure F16. Bivalves in sandstone.
At the microscopic scale, the sandstone is not very well sorted and has grains that are mostly subangular (Figure F17A). The mineralogy is dominated by quartz, although there are grains of feldspar and quartz-bearing lithic fragments, as well as opaque minerals and a minority of heavy minerals. There are small amounts of clay that act as a matrix to the sandstone. This rather immature textural character suggests that sediment transport distances may not have been very far from the original source and that some of the deposition could have been rapid and not very heavily worked by currents. Some intervals of the core show well-developed current structures, so there is some variability in the flow regime within the unit. Figure F17B shows a close-up of some of the mineral grains, largely quartz fragments, as well as one darker lithic grain. It is noteworthy that some of the smaller fragments are less dominated by quartz than the sand grains and highlight the significance of mafic minerals to the overall composition.
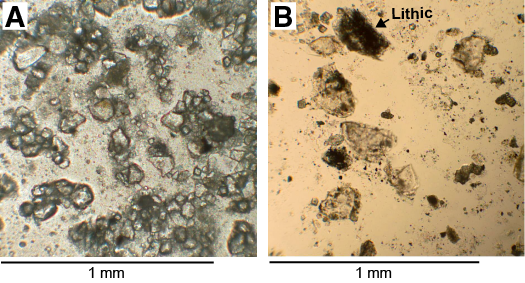
Figure F17. Sand.
Simply considering the degree of lithification, we infer that diagenesis is more advanced in Unit II compared to Unit I. We see little alteration or growth of nodules or concretions. Pyrite is, however, visible in some smear slides and is visible on the cores in the lower part of Unit II as sparse, relatively small nodules (<5 mm) within sandstone. Compared to other sites cored during this expedition, the degree of pyrite growth is relatively moderate.
Overall, the sandstone characteristics indicate deposition of Unit II in a relatively high-energy shallow-marine environment. There was significant supply of coarse clastic material to the basin, and the sources may not have been very far from the depocenter based on the textual evidence from the sandstone, as well as the occasional observation of minor conglomerate, which bears quartzite and rare carbonate pebbles. Trace fossil assemblages also point to a shallow-marine, high-energy environment with a soft seafloor. The proportion of sand in Unit II suggests that Site U1435 was close to a major sediment delivery pathway, and the most likely setting is a river mouth or deltaic environment. This conjecture is favored because such settings would provide the required sediment supply and also the relatively high energies related to both river discharge and tidal currents. Such environments are also relatively nutrient rich and would sustain the strong burrowing fauna observed and provide organic carbon through terrestrial run-off. This interpretation is consistent with the absence of typical marine microfossils, as well as with the occurrence of shallow- to brackish-water benthic foraminifers that require marine conditions but not normal salinities (see Biostratigraphy). The coarsening and fining upward cycles seen in the unit are explained by the progradation of delta lobes that would generate a coarsening-upward cycle. When each lobe is abandoned, it would then be covered by more distal hemipelagic sediment, generating a fining-upward cycle.
Unit III (275.54–300.00 mbsf)
- Interval: 349-U1435A-29R-5, 74 cm, through 32R-CC, 10 cm
- Depth: 275.54–300.00 mbsf (total depth)
- Age: pre-Oligocene
Unit III is distinguished from Unit II largely on the basis of being finer grained. The top boundary is placed at the top of a mixed claystone–sandstone interval and at the base of a major sandstone layer. We note that fine-grained intervals also occur in Unit II but are more dominant in Unit III, even though sand and conglomerate are also recognized. Fine-grained sedimentary rocks are often interpreted to indicate low-energy depositional settings, but that may only be the case part of the time in Unit III. Some fine-grained intervals show alternation of thin-bedded fine sandstone together with mudstone, mixed in relatively equal proportions and interbedded on the scale of a few millimeters. These structures are indicative of continued high-energy current activity and relatively modest amounts of bioturbation (Figure F13B). These sandstone structures are reminiscent of flaser bedding and are suggestive of high current velocities across an unconsolidated seafloor. The most coherent section of muddy sediment occurs in the final core (349-U1435A-32R), where there is >1 m of silty mudstone marked by poorly defined lamination (Figure F13C). Even here there are common thin, fine sandstone intervals and occasional burrows filled with fine sandstone. The lamination that we do see is defined by slightly coarser layers and does not imply stagnant conditions or slow sedimentation. This deposit is similar to ones seen in Unit II but is thicker. The presence of conglomerate in Section 349-U1435A-31R-1 indicates that Unit III is not exclusively a fine-grained or low-energy sequence. Clasts in the conglomerate are >8 mm across and moderately sorted. Clast compositions are similar to those seen in Unit II and require high-energy flow and erosion to have affected the site between periods of slower flow and faster accumulation.
Trace fossils in Unit III are similar to those see in Unit II and mostly show vertical and subvertical burrows (Figure F15C) consistent with a shallow-marine, soft-bottomed seafloor setting.
Diagenesis has lithified the sandstone of Unit III, and pyrite is visible as small nodules (<5 mm), as was the case in the lower parts of Unit II. The better-preserved laminations in Unit III sandstone illuminate the timing of pyrite growth (Figure F18), which must have been relatively late stage because the laminations do not drape around and are not compacted across nodules, suggesting that they formed after initial lithification.
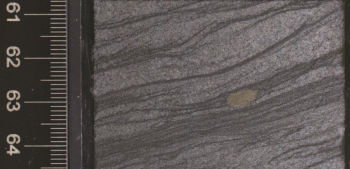
Figure F18. Pyrite concretion.
Unit III is interpreted as a shallow-water marine deposit and could represent a more sheltered setting within the river mouth/delta interpretation favored for Unit II. Finer grained intervals represent accumulation of mud, either because of switching sediment delivery pathways, potentially on relatively small spatial scales, or in response to moderate changes in sea level. Abandonment of a channel system within a delta would result in a clay-rich drape, but more distal suspended sediment delivery would continue. Unit III also shows evidence for strong current activity and even gravel/conglomerate sedimentation, so this is not an especially sheltered or intrinsically different depositional setting. A possible depositional environment for the more claystone-rich intervals would be within some type of coastal lagoon system, which could then alternate with periods of more active deltaic sedimentation driven by the autocyclic migration and avulsion of the river mouth.
Discussion
The stratigraphy at Site U1435 divides neatly into three units, which can be formed into two groups. Unit I is clearly of much deeper water origin than the lower units and was likely deposited on the Chinese continental margin in the present location under something comparable to modern conditions (i.e., water depths deeper than 2500 m). The fact that significant material is no longer accumulating is unlikely to be related to significant subsidence generating accommodation space since the Miocene because we would anticipate that postrift thermal subsidence had largely occurred before that time. Tectonic activity was largely stable during the time of low sedimentation because this is in the postrift stage of basin development. The lack of accumulation, as evidenced by manganese nodules and extremely thin sediment cover, probably reflects both the elevated position of the drill site on a structural high after 33 Ma, as well as changing oceanographic conditions, particularly the start of strong bottom currents along the base of the continental slope that are related to overflow of Pacific water into the South China Sea through the Luzon Strait (Wang et al., 2011).
Reduced sediment flux to the outer part of the continental margin is a little unusual in the context of generally lower sea levels since the Miocene, which should reduce accommodation space on the shelf and force sediment into deeper water. Increased flux to deeper water settings would also be expected given the more erosive environmental conditions onshore linked to glacial–interglacial climatic cycles that are generally associated with enhanced sediment delivery to passive continental margins worldwide (Zhang et al., 2001). Because most sediment budgets for East Asia also show this increased sediment flux (Métivier et al., 1999), the lack of accumulation at Site U1435 reflects the fact that either the sediment is not being transported to this location in the first place, or more likely, it is deposited then eroded and not preserved because of the location on top of a structural high.
The sediment of Unit I most likely came from southern China; however, since ~6 Ma, Taiwan has probably dominated as a sediment source for the northeastern South China Sea since uplift began in the latter part of the late Miocene (Huang et al., 2006). Earlier work has established that Taiwan is the primary source of sediment to nearby Ocean Drilling Program Site 1148 (Prell, Wang, Blum, Rea, and Clemens, 2006), at least in post-Oligocene periods (Li et al., 2003; Clift et al., 2014), and a similar source is inferred for Site U1435.
The two older units cored at Site U1435 both represent relatively shallow marine conditions. The pre-Oligocene age, together with observed extensional structures in the core (see Lithostratigraphy), indicate that this unit is syntectonic and deposited at a time of rapid extension in the adjacent continental shelf (Ru and Pigott, 1986; Clift and Lin, 2001). Unit II in particular shows evidence of high-energy conditions and the types of facies associated with rapid sediment delivery. Unit III is generally finer grained but probably part of a single shallow-marine–deltaic depositional environment. The finer-grained material would represent sedimentation in a slightly more sheltered setting than the more massive sandstone, but this is explained by the variety of different environments found in a deltaic system, such as abandoned channels or lagoons that are close to the main distributary channels.
The source of sediment to Units II and III is not entirely obvious, as there has been some debate about whether Oligocene and presumably older materials at Site 1148 are coming from the north (i.e., from southern China) or from the southwest from Indochina (e.g., Li et al., 2003). Given the coarse grain size and the textual immaturity, a more proximal source seems likely. The source must have been dominated by quartzose bedrock, and the granite and volcanic rock that dominate the geology of Southeast China are therefore suitable. During the early stages of extension, structural highs in the basement of the Chinese continental margin would have been exposed to erosion, providing a very local source of sediment from what are now the horst structures that underlie the outer part of the continent shelf, separating the Pearl River Mouth Basin and the continental slope. The fact that the bedrock geology of both onshore and offshore areas is formed from the Mesozoic arc complexes of southeast China, indicates that the structural highs within the margin are probably magmatic-arc related. We envisage a deltaic system building out into the initiating rift basin at a time when it had already been connected to the open ocean as a result of extension within the rift axis. Because of the location of Site U1435 directly next to the continent/ocean boundary, we would anticipate the highest degrees of extension and synrift subsidence to have taken place in this region. This would result in Site U1435 having a more distal, marine sedimentary assemblage compared to more continental-type facies developed in subbasins closer to the South China block.
Biostratigraphy
All core catcher samples from Hole U1435A were analyzed for calcareous nannofossils, planktonic foraminifers, and radiolarians. In addition, split-core samples were analyzed to refine the ages of core sections. Based on nine nannofossil and four planktonic foraminifer bioevents (Figure F19; Tables T2, T3), the sedimentary sequence shallower than 77.62 mbsf is assigned an age spanning the early Oligocene (<33.43 Ma) to the Pleistocene (>0.12 Ma), with possible unconformities or condensed sections existing between the upper Oligocene and middle Miocene, the upper Miocene and lower Pliocene, and the upper Pliocene and Middle Pleistocene.
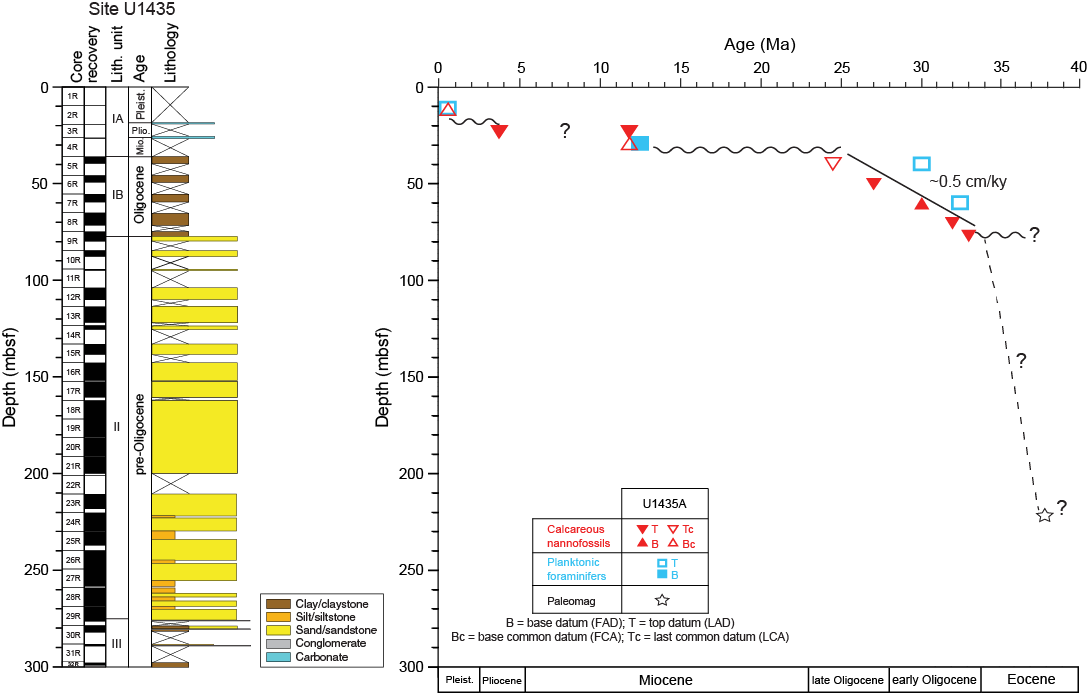
Figure F19. Age-depth model.
Table T2. Depths and ages of calcareous nannofossil events, Hole U1435A. Download table in .csv format.
Table T3. Depths and ages of planktonic foraminifer events, Hole U1435A. Download table in .csv format.
No nannofossils, planktonic foraminifers, or radiolarians were found from 79.78 mbsf to the bottom of the hole at 299.16 mbsf. A few benthic foraminifers occur in samples from Core 349-U1435A-21R through 26R, which indicate a shallow-water marine to brackish water depositional environment for lithostratigraphic Unit II (see Lithostratigraphy). Pollen specimens from gymnosperms (conifer) and angiosperms (S. Warny, pers. comm., 2014) also occur in some samples from Unit II intervals and are presumed to be derived from source areas in southern China. Shore-based studies of palynomorph assemblages are needed to determine if Units II and III can be dated biostratigraphically.
Because the upper part of the sedimentary sequence is truncated by hiatuses or condensed sections, it is difficult to calculate sedimentation rates; however, the Oligocene section is fairly continuous and we calculate sedimentation rates to have been ~0.5 cm/ky during that time, based on a limited number of bioevents (Figure F19).
Calcareous nannofossils
Calcareous nannofossil biostratigraphy for Hole U1435A was established by analyzing all core catcher samples and additional split-core samples. Nannofossils are found only in the upper part of the hole, from Core 349-U1435A-2R (9.7 mbsf) to the upper part of Core 9R (77.62 mbsf). All of these samples have abundant nannofossils, except for Sample 9R-2, 132–136 cm, which has few. The rest of the hole, from the lower part of Core 9R to 32R (77.66–299.06 mbsf) corresponding to lithostratigraphic Units II and III, is barren of nannofossils (Table T4). Preservation of nannofossils is good to moderate with heavy overgrowth on discoasters (e.g., Samples 4R-CC and 5R-CC; 26.65 and 39.62 mbsf, respectively).
Table T4. Distribution of calcareous nannofossils, Hole U1435A. Download table in .csv format.
The nannofossil bioevents identified show that the sedimentary sequence at this site consists of a discontinuous record dated to the early Oligocene (Zone NP21; <33.43 Ma) to the Pleistocene (Zone NN21; <0.29 Ma) (Table T2; Figure F19). The presence of Emiliania huxleyi in Sample 2R-CC (9.7 mbsf) indicates a Pleistocene age (<0.29 Ma). Two subsamples were taken from Sample 3R-CC (19.43 mbsf): one from the upper greenish gray clay and another from the lower brown clay forming the contact with a manganese nodule. The greenish gray clay yielded a Pliocene nannofossil Zone NN15 assemblage characterized by the presence of Reticulofenestra pseudoumbilicus (LAD at 3.7 Ma). However, the brown clay is late Miocene in age based on the presence of Cyclicargolithus floridanus (LAD at 11.85 Ma within Zone NN7). These two events suggest a hiatus or very low sedimentation rate during deposition of the gray and brown clay and the formation of the manganese nodules. The age of the next sample (4R-CC; 26.65 mbsf), which is also brown clay, is middle Miocene based on the presence of common Discoaster kugleri. This taxon has a short range within Zone NN7 (11.58–11.90 Ma).
A significant hiatus (~12 million years) occurs between Cores 4R and 5R. Samples 5R-CC (39.62 mbsf) and 6R-CC (49.25 mbsf) contain nannofossils that indicate a late Oligocene age representing Zones NP25 and NP24 (last common appearance [LCA] of Cyclicargolithus abisectus at 24.67 Ma and LAD of Sphenolithus predistentus at 26.93 Ma, respectively). Three early Oligocene nannofossil datums spanning Zones NP23–NP21 occur from 59 to 77.62 mbsf:
- The FAD of Sphenolithus distentus (26.93 Ma) in Sample 7R-CC (59.54 mbsf),
- The LAD of Reticulofenestra umbilicus (32.02 Ma) in Sample 8R-CC (71.55 mbsf), and
- The LAD of Coccolithus formosus (32.92 Ma) in Sample 9R-1, 69-73 cm (75.19 mbsf).
The deepest sample examined that contains nannofossils, Sample 9R-2, 132–136 cm (77.62 mbsf), does not contain Clausicoccus subdistichus, suggesting this sample is younger than 33.43 Ma (the last appearance of the acme of C. subdistichus). Based on these findings, the oldest sediment that contains calcareous nannofossils at this site is <33.43 Ma (early Oligocene). The presence of the LAD of C. formosus at this site allows correlation to the base of the sequence at Site 1148 in the South China Sea, located north of Site U1435 (Su et al., 2004).
Planktonic foraminifers
Planktonic foraminifers were analyzed in all core catcher and additional split-core samples from Hole U1435A. In general, planktonic foraminifers are common to abundant with moderate to good preservation in the upper section shallower than 70 mbsf but become rare in samples from Cores 349-U1435A-8R and 9R and barren from Sample 9R-CC (79.78 mbsf) to the base of the hole (Table T5). Our results indicate that the sedimentary sequence recovered in Hole U1435A spans three discontinuous intervals: the lower Oligocene (Zone O2/O1; ~32 Ma), the upper Miocene (Zones M9–M10; ~12 Ma), and the Pleistocene (Subzone Pt1b; <0.4 Ma) (Table T3; Figure F19). In Sample 2R-CC (9.70 mbsf), the planktonic foraminifer assemblage is dominated by species characteristic of the late Quaternary tropical Indo-Pacific, such as Globigerinoides ruber, Globigerinoides sacculifer, Globorotalia menardii, Pulleniatina obliquiloculata, Neogloboquadrina dutertrei, Sphaeroidinella dehiscens, and Orbulina universa. The LAD (0.12 Ma) and FAD (0.4 Ma) of G. ruber (pink) in Samples 2R-CC (9.70 mbsf) and 3R-CC (19.43 mbsf), respectively, indicate Pleistocene Subzone Pt1b. The occurrence of many typical Pliocene species such as Dentoglobigerina altispira, Globorotalia multicamerata, and Sphaeroidinellopsis seminulina in the latter sample is attributed to mixing due to drilling disturbance in an interval with manganese nodules (see Lithostratigraphy). Postcruise studies may help clarify whether any Pliocene sediments were recovered in Cores 3R and 4R. Sample 4R-CC (26.65 mbsf) contains abundant late Miocene species, mainly D. altispira, Dentoglobigerina globosa, Globoquadrina dehiscens, and Globoquadrina venezuelana, although the assemblage has been altered by dissolution, as indicated by a high proportion (30%–40%) of broken tests. This sample likely represents deposition at ~12 Ma (Zones M9–M10) based on the occurrence of Globorotalia lenguaensis (FAD at 12.84 Ma), G. dehiscens (local LAD at ~10 Ma; Li et al., 2006), and Paragloborotalia mayeri (LAD at 10.46 Ma), as well as the absence of Globoturborotalita nepenthes (FAD at 11.63 Ma). The sporadic occurrence of younger, mainly Quaternary species such as S. dehiscens and Globigerinoides obliquus, is considered to be contamination caused by drilling disturbance.
Table T5. Distribution of planktonic foraminifers, Hole U1435A. Download table in .csv format.
Further downhole, abundant moderately preserved Oligocene planktonic foraminifers, including Turborotalia ampliapertura (LAD at 30.28 Ma), Dentoglobigerina galavisi, Cassigerinella chipolensis, Chiloguembelina cubensis (LCA at 28.5 Ma), and G. venezuelana, occur in Samples 349-U1435A-5R-CC through 7R (39.62−59.64 mbsf), indicating lower Oligocene Zones O2 and O1. The LAD of Pseudohastigerina naguewichiensis (32.10 Ma) in Sample 7R-CC (59.54 mbsf) marks the Zone O2/O1 boundary. Rare, poorly preserved specimens and the occurrence of C. chipolensis (FAD at 33.89 Ma) in Samples 8R-CC through 9R-2, 132–136 cm (71.55−77.62 mbsf) indicate an earliest Oligocene age for this interval. Samples 9R-CC through 32R-CC (79.78–299.16 mbsf) are barren of planktonic foraminifers, thus hampering age determination for lithostratigraphic Units II and III in Hole U1435A. Sporadic benthic foraminifers (mainly Ammonia beccarii var. and Florilus sp.) in Samples 21R-CC (199.95 mbsf), 24R-CC (229.86 mbsf), and 26R-CC (249.14 mbsf) may indicate a brackish water or coastal marine environment.
Radiolarians
All core catcher samples from Hole U1435A were analyzed for radiolarians, which are abundant and well preserved only in Samples 349-U1435A-2R-CC and 3R-CC (9.7–19.43 mbsf). The presence of Late Pleistocene radiolarian species Buccinosphaera invaginata in Sample 2H-CC (9.7 mbsf) indicates an estimated age younger than 0.21 Ma (Table T6). Radiolarians are rare and poorly preserved in Sample 3R-CC (19.43 mbsf). No biostratigraphic markers were found in this sample. Downhole, samples are barren of radiolarians but sponge spicules are abundant in Sample 4R-CC (26.65 mbsf) and between Samples 6R-CC and 7R-CC (49.05–59.54 mbsf).
Table T6. Distribution of radiolarians, Hole U1435A. Download table in .csv format.
Geochemistry
Interstitial water chemistry
No interstitial water samples were collected shallower than 50 mbsf due to extremely poor core recovery. We collected 20 whole-round samples (5–15 cm long) for interstitial water measurements from 58 to 244 mbsf in Hole U1435A at a frequency of one sample per core, unless core recovery was <10%. Interstitial water chemistry data are given in Table T7 and shown in Figures F20 and F21.
Table T7. Interstitial water major element concentrations, Hole U1435A. Download table in .csv format.
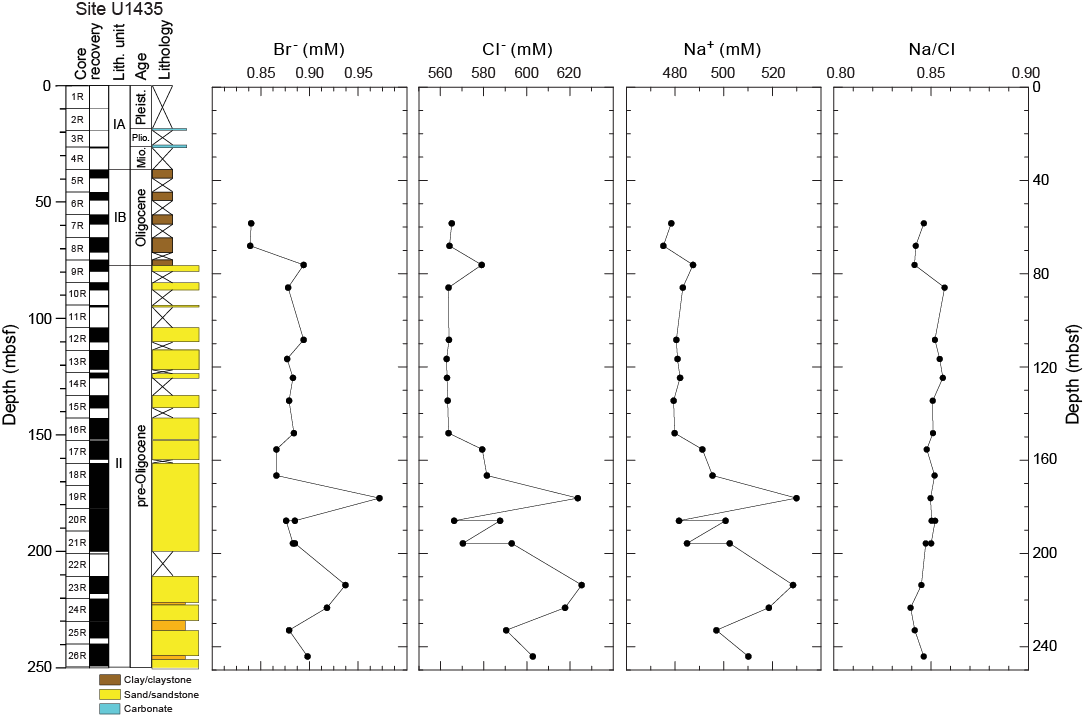
Figure F20. Bromide, chloride and sodium.

Figure F21. Alkalinity, sulfate, calcium, and magnesium.
Chloride, bromide, and sodium
Downhole profiles of chloride, bromide, sodium, and Na/Cl ratio at Site U1435 are shown in Figure F20. Chloride, bromide, and sodium concentrations show similar profiles with depth. The concentrations are similar to the values of modern seawater in lithostratigraphic Subunit IB but increase slightly at the transition from the nannofossil-rich clay of Subunit IB to the sandstone of Unit II. Concentrations are then constant and similar to modern seawater values shallower than 150 mbsf in Unit II but become more variable below that depth. As the Na/Cl ratio is ~0.85 (similar to modern seawater) throughout the hole, the anomalies could be caused by simple evaporation.
Alkalinity, sulfate, calcium, and magnesium
Alkalinity, sulfate, calcium, and magnesium profiles are shown in Figure F21. As the volume of interstitial water was limited (mostly <10 mL), only 5 interstitial water samples from the uppermost part of Unit II were analyzed for alkalinity; values for which range from 3.8 to 4.1 mM. Sulfate concentrations gradually decrease from 25.5 mM at 58 mbsf to 23.1 mM at 170 mbsf. Below 175 mbsf, sulfate concentrations are variable, ranging from 25.0 to 21.6 mM. Calcium concentrations increase from 15.9 to 38.2 mM at 244 mbsf, which is likely caused by dissolution of calcareous microfossils (see Lithostratigraphy). Magnesium concentrations decrease from 49 mM at 58 mbsf to 32 mM at 244 mbsf.
Headspace gas geochemistry
Headspace gas was monitored in cores from Hole U1435A as part of the shipboard safety and pollution prevention program. Methane and ethane were detected in very low concentrations of <10 ppmv (Figure F22; Table T8).
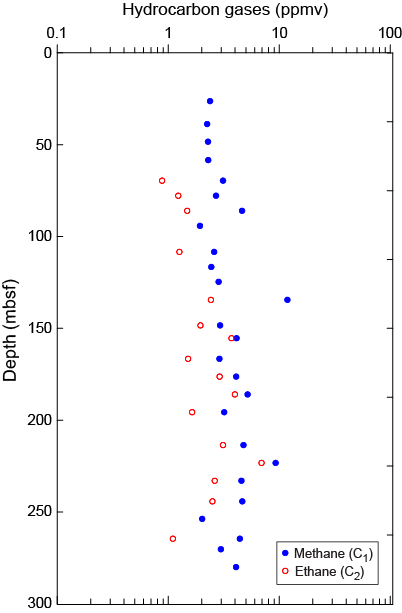
Figure F22. Hydrocarbon gases.
Table T8. Hydrocarbon headspace gas concentrations, methane and ethane, Hole U1435A. Download table in .csv format.
Bulk carbon and nitrogen analysis
Thirteen samples from lithostratigraphic Units I and II, between ~50 and 180 mbsf, were analyzed for total carbon, total inorganic carbon, and total nitrogen (TN). Distributions of CaCO3, total organic carbon (TOC), TN, and total organic carbon to nitrogen ratio (C/N) for Hole U1435A are illustrated in Figure F23 and listed in Table T9. The CaCO3 content decreases from 40.9 to 16.0 wt% from 58–90 mbsf and then generally remains below 10 wt% to 180 mbsf. The low values correspond to the lithologic change from nannofossil-rich clay in Subunit IB to sandstone in Unit II (see Lithostratigraphy). TOC ranges from 0.5 to 1.3 wt%, except for one sample at ~58 mbsf that contains no measurable TOC. Total nitrogen is very low (<0.05 wt%). C/N is generally high, ranging from 10 to 31, especially in the upper part of Unit II (Figure F23), indicating a dominantly terrestrial source for the organic matter.
Table T9. Carbonate, total nitrogen, and TOC contents and C/N ratios, Hole U1435A. Download table in .csv format.
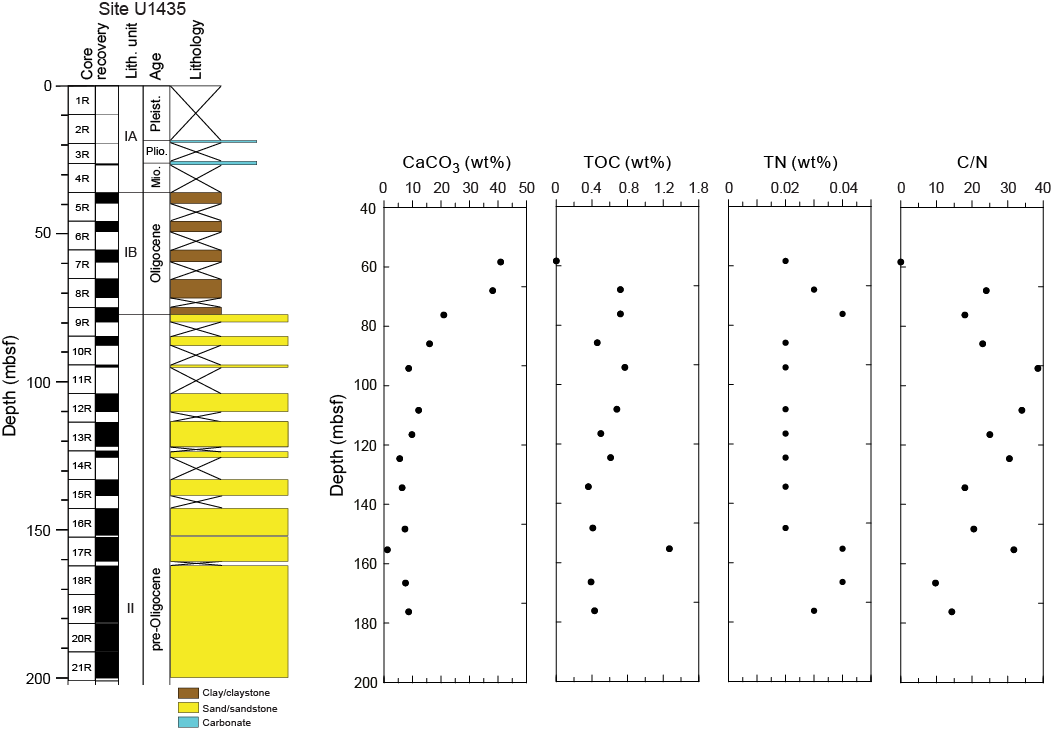
Figure F23. Calcium carbonate, TOC, TN, and C/N ratios.
Microbiology
Our goal for microbiological research conducted at Site U1435 was to collect and preserve samples for shore-based characterization of the microbial communities. We collected 25 routine, 5 cm whole-round samples to be used for microbiological analysis from 37 to 299 mbsf in Hole U1435A (Figure F24). The whole-round samples for microbiology were taken adjacent to samples for interstitial water measurements in order to understand proximal interstitial water chemistry. In addition, we collected samples for measuring contamination testing tracers, including microspheres and fluid community tracers.
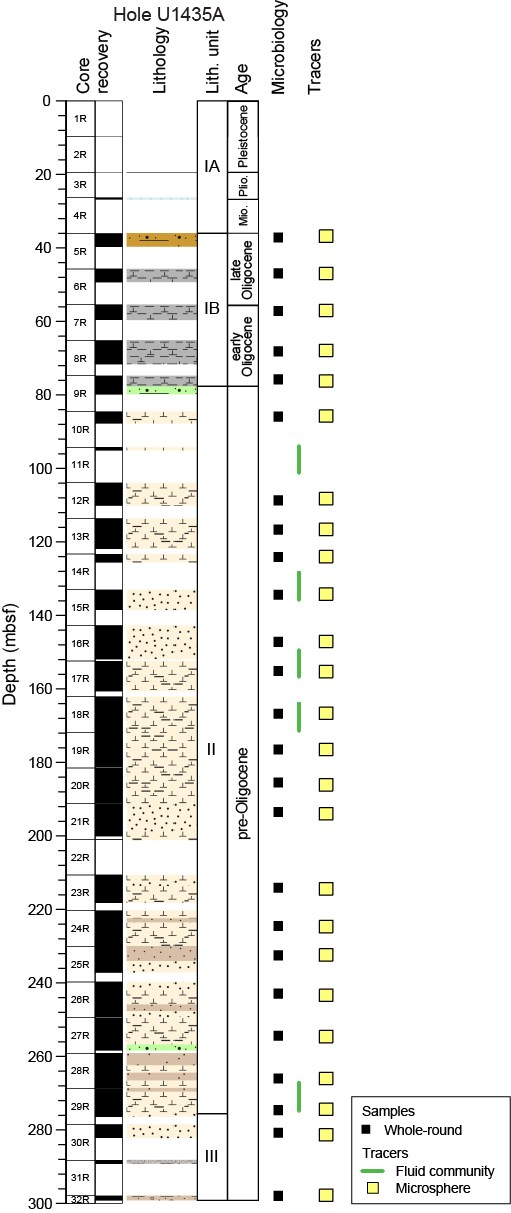
Figure F24. Microbiology sample collection depths.
Microbiological analyses
Most of the samples collected at Site U1435 were preserved for shore-based analysis. Samples to be used for DNA extractions and sequencing were frozen at 80°C, and samples to be used for lipid extraction and analysis were frozen at −80° or −20°C. Portions of the whole-round samples selected for cultivation-based studies to enrich for anaerobic heterotrophs, autotrophs, and predatory bacteria were preserved at 4°C.
Contamination testing
We used two different methods of contamination testing during coring at Site U1435. Microsphere tracers were used with the RCB coring system in Hole U1435A by adding them to the core catcher sub for Cores 349-U1435-5R through 32R (37–299 mbsf; Figure F24). Two microsphere samples were collected from each of the cores collected between those depth intervals: one from scrapings of the core surface and one as a subsample from the interior of each sample. Microscopic counts of the microspheres in these samples will be performed in shore-based laboratories using the Procedure for Curation of DeepBIOS (www.kochi-core.jp/DeepBIOS).
Five fluid community tracer (FCT) samples were collected either from the drilling fluids that drained from the core liners when cores arrived on the catwalk or from a sampling port near the mud pumps on the rig floor during active coring. The fluids collected for FCT samples correspond to cores obtained between ~90 and 273 mbsf. Microbial community DNA and lipids from FCT samples will be compared to the same measurements made on the core samples to determine if the drilling fluids contain microbes that can be regularly tracked as recognizable contaminant taxa.
Paleomagnetism
Because of time constraints at the end of Expedition 349, regular discrete sample measurements and demagnetization could not be carried out for Site U1435. Therefore, only pass-through magnetometer measurements on all archive-half Cores 349-U1435A-4R through 32R were conducted using the 2G superconducting rock magnetometer (SRM) with demagnetization steps of 5, 10, and 20 mT. We analyzed the results in Zijderveld diagrams (Zijderveld, 1967) and calculated the characteristic remanent magnetization (ChRM) direction by using principal component analysis (Kirschvink, 1980).
Natural remanent magnetization of sedimentary cores
Paleomagnetic data obtained at Site U1435 exhibit significant variations in magnetic property among the various lithologies recovered. As shown in Figure F25, the natural remanent magnetization (NRM) intensity for the recovered sediment in Hole U1435A ranges between 0.0001 and 0.01 A/m. Shallower than ~100 mbsf, paleomagnetic measurements indicate that the average NRM intensity for the greenish gray clayey nannofossil ooze and claystone in lithostratigraphic Unit I and upper part of Unit II averages ~0.002 A/m and then decreases to ~0.0005 A/m between ~80 and 200 mbsf. After 20 mT AF demagnetization, the remanent magnetization significantly decreases by almost 80% for the dark gray silty sandstone in Unit II below 80 mbsf, which indicates that the NRM carrier for this interval is magnetically soft. Generally, in sand layers, coarser grained (pseudosingle domain [PSD] and multiple domain) magnetite is abundant. These pseudosingle-domain/ multiple-domain magnetite particles have lower remanence coercivity (Bcr < 10–15 mT) compared to their single-domain counterparts (Bcr > 20 mT); therefore, they can be easily AF demagnetized. In contrast, the upper part of the section has relatively higher remanent magnetization and is also magnetically harder than the underlying Units II and III. This indicates that sediments above 100 mbsf contain relatively finer grained (PSD) magnetic particles than Units II and III. From ~210 mbsf to near the bottom of Unit II (~280 mbsf), NRM intensities consistently exhibit higher values (Figure F25).
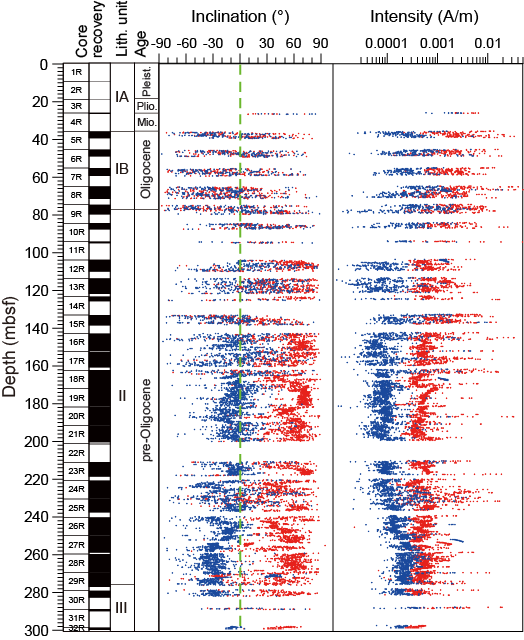
Figure F25. Paleomagnetism.
For the units deeper than 80 mbsf, initial NRM exhibits steep downward inclinations up to ~80°, which indicates strong drilling-induced remagnetization. For the sediment shallower than 80 mbsf, NRM inclinations alternate between positive and negative values, indicating that either strong disturbance effects or the presence of magnetically hard minerals (e.g., hematite, which may be more resistant to drilling-induced overprint) may have played a role. The appearance of upward (negative) inclinations before any AF demagnetization is puzzling but could indicate inversion of core sections either during the coring process or measurement on the magnetometer. Further shore-based experiments on the corresponding discrete samples are required to understand the origin of these NRMs with negative inclinations.
Paleomagnetic demagnetization results and magnetostratigraphy
Representative vector plots (Zijderveld, 1967) showing magnetic behavior of detailed AF demagnetization are given in Figure F26. Overall, the plots exhibit very soft magnetic behavior. For example, Samples 349-U1435A-5R-2A, 40.0 cm (Figure F26A), and 9R-2A, 117.5 cm (Figure F26B), were fully demagnetized by 20 mT AF demagnetization. For samples from greater depths (Figures F26C, F26D), initial NRM intensities are only on the order of 10−5 A/m, indicating that the samples contain either only minor amounts of magnetic minerals or more antiferromagnetic minerals (e.g., hematite and goethite) with weak magnetic properties.

Figure F26. Demagnetization.
Because of the rotary technique used for drilling, relative rotation frequently occurs between different segments of sediment within the core. Consequently, we used ChRM inclinations to define polarity sequences for Hole U1435A (Figure F27). Overall, the polarity pattern can be roughly divided into two parts. Shallower than ~165 mbsf, the inclinations alternate more frequently between positive and negative polarities. In contrast, core sections between 165 and 280 mbsf show dominantly reversed polarity. Biostratigraphic samples at ~77.6 mbsf have been assigned an age of ~33.0 Ma (see Biostratigraphy), suggesting that the reversed polarity zone between ~77 and 146 mbsf could be of Chron C12r age (31.03–33.16 Ma) if there is not a significant hiatus between lithostratigraphic Units I and II. This match is reasonable because Chron C12r is the only reversed chron of this particular age with relatively longer duration. Furthermore, this information also suggests that the relatively well defined polarity record at ~165–290 mbsf might span Chrons C13r (33.70–35.00 Ma) to C16n (36.05–36.70 Ma).
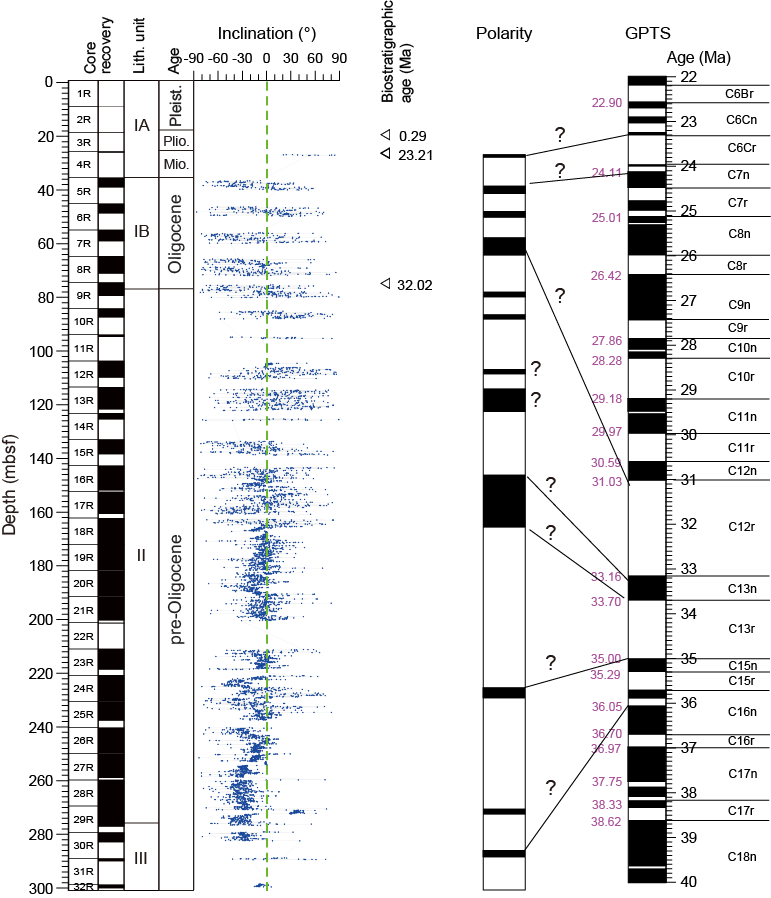
Figure F27. Magnetostratigraphy.
Physical properties
Cores from Hole U1435A were measured for physical properties on whole-round cores (P-wave velocity, gamma ray attenuation [GRA] bulk density, magnetic susceptibility, and natural gamma radiation [NGR]), as well as on split cores (point magnetic susceptibility and x-caliper P-wave velocity) and discrete samples (moisture and density). Because of the poor recovery at the top of the hole, measurements start from ~30 mbsf. Thermal conductivity was measured with a needle probe in soft sediment and then with a contact probe in lithified sediment.
Whole-Round Multisensor Logger measurements
Measurement points that are orders of magnitude out of range were removed from the whole-round core data, which were then smoothed using a five-point average moving window for GRA density and a 10-point average moving window for magnetic susceptibility and NGR. Plots of the physical property data in Hole U1435A are compiled in Figure F28.
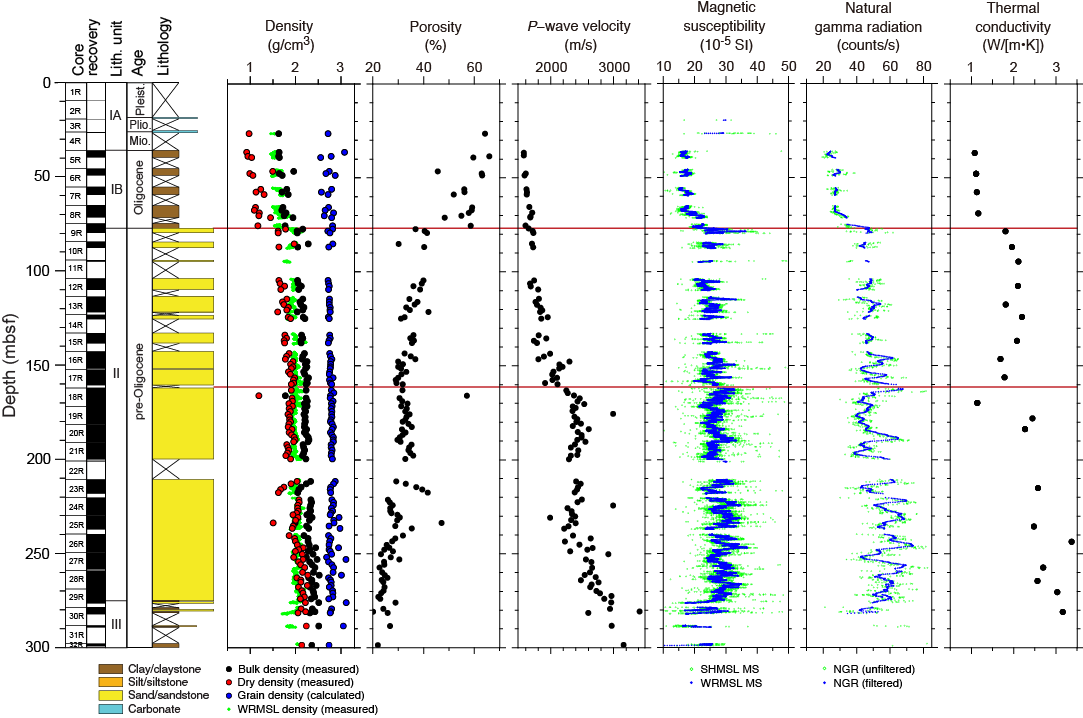
Figure F28. Physical properties.
GRA bulk density
Bulk density, measured from GRA on the Whole-Round Multisensor Logger (WRMSL) as well as on discrete samples, increases with depth from 1.5 to ~1.8 g/cm3 in the uppermost 78 mbsf. Dry density measured on discrete samples follows a similar trend, with values from 1 to 1.5 g/cm3 over the same depth interval. Bulk and dry densities increase by ~0.5 g/cm3 near 78 mbsf at the boundary between the claystone of lithostratigraphic Unit I and the sandstone of Unit II. Grain density varies between 2.5 and 3.2 g/cm3 in the uppermost 78 mbsf and then remains nearly constant around 2.8 g/cm3 deeper. Porosity decreases with depth in the uppermost 78 mbsf, from 65% to 50% in the claystone, drops to 40% in the sandstone of Unit II, and then continues to decrease to 30% near 150 mbsf. Porosity then varies between 20% and 40% to the bottom of the hole.
Magnetic susceptibility
Magnetic susceptibility values are relatively constant, near 15 × 10−5 to 20 × 10−5 SI, downhole to 70 mbsf in the claystone of lithostratigraphic Subunit IB and increase with depth from 70 to 78 mbsf, reaching values of ~20 × 10−5 to 30 × 10−5 SI in the sandstone of Unit II. Magnetic susceptibility values then remain relatively constant to ~165 mbsf, where they slightly increase to 25 × 10−5 to 35 × 10−5 SI, remain relatively constant to 275 mbsf, and then decrease with depth to ~20 × 10−5 SI in the silty sandstone and shale of Unit III.
Natural gamma radiation
In Hole U1435A, NGR values display trends and variations similar to magnetic susceptibility values across the different lithologic boundaries. NGR counts are close to 20–30 counts/s in the claystone of Subunit IB, increase to ~50 counts/s in the sandstone of Unit II, and show a slight increase to ~60 counts/s near 220 mbsf. The values decrease with depth to 40 counts/s in Unit III.
Thermal conductivity
Thermal conductivity is constant in the claystone of lithostratigraphic Subunit IB at 1 W/(m·K). Values increase to ~2 W/(m·K) in the sandstone, where they remain relatively constant downhole to ~165 mbsf. Below this depth, thermal conductivity increases to 2.2–3.2 W/(m·K) in the rest of the hole, with higher variability than in the uppermost 165 m.
Compressional wave (P-wave) velocity
In Hole U1435A, P-wave velocity gradually increases from near seawater velocity at the seafloor (1480 m/s) to ~2200 m/s at 165 mbsf. Values do not change significantly at the lithostratigraphic Subunit IB/Unit II boundary near 78 mbsf, whereas most other properties show large changes across the boundary. P-wave velocity remains constant near 2400 m/s from 165 to 220 mbsf and then increases with depth to the bottom of the hole to values near 3000 m/s.
Data interpretation and lithology correlation
In Hole U1435A, variations of some of the physical properties near the seafloor reflect compaction of sediment, but most variations appear to be related to lithology and lithification. P-wave velocity increases gradually with depth over the uppermost 150 m, whereas porosity measured on discrete samples decreases from 65% to 30% over the same depth range, reflecting sediment compaction. Bulk density, NGR, magnetic susceptibility, and thermal conductivity show a sharp increase near 78 mbsf at the boundary between the claystone of lithostratigraphic Subunit IB and the sandstone of Unit II. A significant increase in P-wave velocity and thermal conductivity is observed near 165 mbsf, which is associated with an increase in sandstone lithification. Magnetic susceptibility and NGR values tend to decrease with depth below 270 mbsf. This corresponds to the increase in silt and mud content in the rocks of Unit III compared to Unit II, which is dominated by sandstone.
References
Berggren, W.A., Kent, D.V., Swisher, C.C., III, and Aubry, M.-P., 1995. A revised Cenozoic geochronology and chronostratigraphy. In Berggren, W.A., Kent, D.V., Aubry, M.-P., and Hardenbol, J. (Eds.), Geochronology, Time Scales and Global Stratigraphic Correlation. Special Publication - SEPM (Society for Sedimentary Geology), 54:129–212. http://dx.doi.org/10.2110/pec.95.04.0129
Clift, P., and Lin, J., 2001. Preferential mantle lithospheric extension under the South China margin, Marine and Petroleum Geology, 18(8):929–945. http://dx.doi.org/10.1016/S0264-8172(01)00037-X
Clift, P.D., Wan, S., and Blusztajn, J., 2014. Reconstructing chemical weathering, physical erosion and monsoon intensity since 25 Ma in the northern South China Sea: a review of competing proxies. Earth-Science Reviews, 130:86–102. http://dx.doi.org/10.1016/j.earscirev.2014.01.002
Cronan, D.S., 1980. Underwater Minerals: London (Academic Press).
Ekdale, A.A., Bromley, R.G., and Pemberton, S.G. (Eds.), 1984. Ichnology: The Use of Trace Fossils in Sedimentology and Stratigraphy. SEPM Short Course, 15.
Hu, J., Kawamura, H., Hong, H., and Qi, Y., 2000. A review on the currents in the South China Sea: seasonal circulation, South China Sea Warm Current and Kuroshio Intrusion. Journal of Oceanography, 56(6):607–624. http://dx.doi.org/10.1023/A:1011117531252
Huang, C.-Y., Yuan, P.B., and Tsao, S.-J., 2006. Temporal and spatial records of active arc-continent collision in Taiwan: a synthesis. Geological Society of America Bulletin, 118((3–4):274–288. http://dx.doi.org/10.1130/B25527.1
Kirschvink, J.L., 1980. The least-squares line and plane and the analysis of palaeomagnetic data. Geophysical Journal of the Royal Astronomical Society, 62(3):699–718. http://dx.doi.org/10.1111/j.1365-246X.1980.tb02601.x
Li, C.-F., Lin, J., Kulhanek, D.K., Williams, T., Bao, R., Briais, A., Brown, E.A., Chen, Y., Clift, P.D., Colwell, F.S., Dadd, K.A., Ding, W., Almeida, I.H., Huang, X.-L., Hyun, S., Jiang, T., Koppers, A.A.P., Li, Q., Liu, C., Liu, Q., Liu, Z., Nagai, R.H., Peleo-Alampay, A., Su, X., Sun, Z., Tejada, M.L.G., Trinh, H.S., Yeh, Y.-C., Zhang, C., Zhang, F., Zhang, G.-L., and Zhao, X., 2015. Methods. In Li, C.-F., Lin, J., Kulhanek, D.K., and the Expedition 349 Scientists, Proceedings of the Integrated Ocean Drilling Program, 349: South China Sea Tectonics: College Station, TX (International Ocean Discovery Program). http://dx.doi.org/10.14379/iodp.proc.349.102.2015 [This volume]
Li, Q., Li, B., Zhong, G., McGowran, B., Zhou, Z., Wang, J., and Wang, P., 2006. Late Miocene development of the western Pacific warm pool: planktonic foraminifer and oxygen isotopic evidence. Palaeogeography, Palaeoclimatology, Palaeoecology, 237(2–4):465–482. http://dx.doi.org/10.1016/j.palaeo.2005.12.019
Li, X., Wei, G., Shao, L., Liu, Y., Liang, X., Jian, Z., Sun, M., and Wang, P., 2003. Geochemical and Nd isotopic variations in sediments of the South China Sea: a response to Cenozoic tectonism in SE Asia. Earth and Planetary Science Letters, 211(3–4):207–220. http://dx.doi.org/10.1016/S0012-821X(03)00229-2
Martini, E., 1971. Standard Tertiary and Quaternary calcareous nannoplankton zonation. In Farinacci, A. (Ed.), Proceedings of the Second Planktonic Conference, Roma 1970: Rome (Edizioni Tecnoscienza), 2:739–785.
Métivier, F., Gaudemer, Y., Tapponnier, P., and Klein, M., 1999. Mass accumulation rates in Asia during the Cenozoic. Geophysical Journal International, 137(2):280–318. http://dx.doi.org/10.1046/j.1365-246X.1999.00802.x
Prell, W.L., Wang, P., Blum, P., Rea, D.K., and Clemens, S.C. (Eds.), 2006. Proceedings of the Ocean Drilling Program, Scientific Results, 184: College Station, TX (Ocean Drilling Program). http://dx.doi.org/10.2973/odp.proc.sr.184.2006
Ru, K., and Pigott, J.D., 1986. Episodic rifting and subsidence in the South China Sea. AAPG Bulletin, 70(9):1136–1155. http://aapgbull.geoscienceworld.org/content/70/9/1136.short
Su, X., Xu, Y., and Tu, Q., 2004. Early Oligocene–Pleistocene calcareous nannofossil biostratigraphy of the northern South China Sea (Leg 184, Sites 1146–1148). In Prell, W.L., Wang, P., Blum, P., Rea, D.K., and Clemens, S.C. (Eds.), Proceedings of the Ocean Drilling Program, Scientific Results, 184: College Station, TX (Ocean Drilling Program), 1–24. http://dx.doi.org/10.2973/odp.proc.sr.184.224.2004
Wade, B.S., Pearson, P.N., Berggren, W.A., and Pälike, H., 2011. Review and revision of Cenozoic tropical planktonic foraminiferal biostratigraphy and calibration to the geomagnetic polarity and astronomical time scale. Earth-Science Reviews, 104(1–3):111–142. http://dx.doi.org/10.1016/j.earscirev.2010.09.003
Wang, G., Xie, S.-P., Qu, T., and Huang, R.X., 2011. Deep South China Sea circulation. Geophysical Research Letters, 38(5):L05601. http://dx.doi.org/10.1029/2010GL046626
Zhang, P., Molnar, P., and Downs, W.R., 2001. Increased sedimentation rates and grain sizes 2–4 Myr ago due to the influence of climate change on erosion rates. Nature, 410(6831):891–897. http://dx.doi.org/10.1038/35073504
Zijderveld, J.D.A., 1967. AC demagnetization of rocks: analysis of results. In Collinson, D.W., Creer, K.M., and Runcorn, S.K. (Eds.), Methods in Palaeomagnetism: Amsterdam (Elsevier), 254–286.
1Li, C.-F., Lin, J., Kulhanek, D.K., Williams, T., Bao, R., Briais, A., Brown, E.A., Chen, Y., Clift, P.D., Colwell, F.S., Dadd, K.A., Ding, W.-W., Hernández-Almeida, I., Huang, X.-L., Hyun, S., Jiang, T., Koppers, A.A.P., Li, Q., Liu, C., Liu, Q., Liu, Z., Nagai, R.H., Peleo-Alampay, A., Su, X., Sun, Z., Tejada, M.L.G., Trinh, H.S., Yeh, Y.-C., Zhang, C., Zhang, F., Zhang, G.-L., and Zhao, X., 2015. Site U1435. In Li, C.-F., Lin, J., Kulhanek, D.K., and the Expedition 349 Scientists, Proceedings of the International Ocean Discovery Program, 349: South China Sea Tectonics: College Station, TX (International Ocean Discovery Program). http://dx.doi.org/10.14379/iodp.proc.349.107.2015
2Expedition 349 Scientists’ addresses.
Figure F1. A. Bathymetric map of the South China Sea region. Solid yellow circles = Expedition 349 sites. Solid pink circles = ODP Leg 184 sites. Yellow dashed line = inferred continent/ocean boundary, blue lines = fossil South China Sea spreading center, white-flagged line = Manila Trench. B. Detailed bathymetry around Site U1432 (red box in A) showing nearby continental shelf, the Manila Trench, and inferred continent/ocean boundary.
Figure F2. A. Regional contoured bathymetric map showing seismic reflection profiles (yellow, pink, and blue lines) and the location of Sites U1432 and U1435 and Ocean Drilling Program (ODP) Site 1148. Contour interval = 100 m. B. Seismic profile Line 973SCSIO_01A with location of Site U1435. SP = shotpoint.
Figure F4. Correlation of lithostratigraphic units with magnetic susceptibility and reflectance spectroscopy (after 20-point running average), Site U1435.
Figure F5. Manganese nodule, suggestive of very slow sedimentation at this site in the recent geological past during deposition of Subunit IA, Hole U1435A (3R-CCA, 1–5 cm).
Figure F6. Burrows in Subunit IB, Hole U1435A. A. Planolites, Chondrites, and Thalassinoides (5R-1A, 106–114 cm). B. Zoophycos and Planolites (7R-2A, 137–144 cm).
Figure F8. Clay with nannofossil ooze in Subunit IB, Hole U1435A (6R-1A, 95 cm; plane-polarized light [PPL]).
Figure F9. Clay with calcite crystals in Subunit IB, Hole U1435A (PPL). Calcite is a diagenetic product. A. 9R-2A, 91 cm. B. 7R-2A, 138 cm. Sparse nannofossils are circled.
Figure F10. (A) Core image and (B, C) photomicrographs (PPL) of the carbonate rock separating Units I and II, immediately overlying sandstone, Hole U1435A (9R-2, 137–140 cm; TS119). In photomicrographs, note pods of recrystallized calcite spar within a background of micritic carbonate mudstone.
Figure F12. Unit II, Hole U1435A. (A) Carbon fragments in sandstone (10R-2A, 65–71 cm) and (B) limestone pebble in sand (15R-1A, 28–34 cm).
Figure F13. Finer grained facies, Hole U1435A. A. Clayey siltstone with Planolites burrows (27R-6A, 55–65 cm; Unit II). B. Very thin sand lenses interbedded with mudstone (29R-5A, 99–107 cm; Unit III). C. Massive black silty claystone (32R-1A, 29–37 cm; Unit III).
Figure F14. Sandstone in Unit II, Hole U1435A. A. Medium sandstone and interbedded claystone with Chondrites trace fossils (19R-6, 65–73 cm). B. Laminated silty sandstone overlying a gently inclined erosion surface (19R-2A, 40–48 cm).
Figure F15. Bioturbated silty sandstone in (A, B) Unit II and (C) Unit III showing large Thalassinoides burrows (circled in A and B), Hole U1435A. A. 20R-5A, 129–138 cm. B. 18R-5A, 58–70 cm. C. Vertical burrows in 30R-1A, 28–38 cm.
Figure F16. Bivalves in sandstone of Unit II, Hole U1435A. A. 20R-CC, 10–16 cm. B. 16R-7A, 23–29 cm.
Figure F17. Sand in Unit II showing poor sorting, subangular grains, and quartz-dominated mineralogy, Hole U1435A (PPL). A. 9R-3A, 60 cm. B. 18R-4A, 113 cm.
Figure F18. Pyrite concretion in thinly laminated sandstone and claystone in Unit III, Hole U1435A (30R-3A, 61–64 cm).
Figure F19. Age-depth model. FAD = first appearance datum, LAD = last appearance datum, FCA = first common appearance, LCA = last common appearance, wavy line = possible hiatus.
Figure F25. Paleomagnetic measurements of NRM inclination and intensity on archive core sections after 0 mT (red) and 20 mT (blue) AF demagnetization, Hole U1435A.
Figure F26. A–D. Representative vector endpoint diagrams (Zijderveld, 1967) of magnetization directions for sediment samples through stepwise AF demagnetization.
Figure F27. Magnetostratigraphic results with biostratigraphic age correlation, Hole U1435A. Paleomagnetic inclination after 20 mT AF demagnetization. For polarity and GPTS (Gradstein et al., 2012), black = normal polarity and white = reversed polarity. ? = uncertain correlation or questionable chron identification.
Figure F28. Physical property measurements, Hole U1435A. Red lines = correlation between physical property changes associated with lithostratigraphic boundaries and lithification changes.
Table T1. Coring summary, Site U1435. Download table in .csv format.
Table T2. Depths and ages of calcareous nannofossil events, Hole U1435A. Download table in .csv format.
Table T3. Depths and ages of planktonic foraminifer events, Hole U1435A. Download table in .csv format.
Table T4. Distribution of calcareous nannofossils, Hole U1435A. Download table in .csv format.
Table T5. Distribution of planktonic foraminifers, Hole U1435A. Download table in .csv format.
Table T6. Distribution of radiolarians, Hole U1435A. Download table in .csv format.
Table T7. Interstitial water major element concentrations, salinity, pH, alkalinity, sulfate, chloride, bromide, calcium, magnesium, sodium, potassium, and Na/Cl ratios, Hole U1435A. Download table in .csv format.
Table T8. Hydrocarbon headspace gas concentrations, methane and ethane, Hole U1435A. Download table in .csv format.
Table T9. Carbonate, total nitrogen, and TOC contents and C/N ratios, Hole U1435A. Download table in .csv format.