Tamura, Y., Busby, C.J., Blum, P., and the Expedition 350 Scientists, 2015
Proceedings of the International Ocean Discovery Program Volume 350
publications.iodp.org

doi:10.14379/iodp.proc.350.103.2015
Site U14361
Y. Tamura, C.J. Busby, P. Blum, G. Guèrin, G.D.M. Andrews, A.K. Barker, J.L.R. Berger, E.M. Bongiolo, M. Bordiga, S.M. DeBari, J.B. Gill, C. Hamelin, J. Jia, E.H. John, A.-S. Jonas, M. Jutzeler, M.A.C. Kars, Z.A. Kita, K. Konrad, S.H. Mahony, M. Martini, T. Miyazaki, R.J. Musgrave, D.B. Nascimento, A.R.L. Nichols, J.M. Ribeiro, T. Sato, J.C. Schindlbeck, A.K. Schmitt, S.M. Straub, M.J. Vautravers, and Y. Yang2
Keywords: International Ocean Discovery Program, IODP, JOIDES Resolution, Expedition 350, Site U1436, Izu-Bonin-Mariana, IBM, prehnite, rear arc, seamount, Manji, tuffaceous mud, volcaniclastic, hyaloclastite, zircon, Neogene, ash, pumice, tuff, lapilli, Quaternary, breccia, peperite, rhyolite, intrusive, subduction, glass, continental crust, fore arc, density current, turbidite, fall deposit, tephra, greigite, volcano-bounded basin, VBB, hemipelagic mud, caldera, andesite, pXRF, ICP-AES, bioturbation, hydrothermal alteration, smectite, hornblende, sulfide reduction, fiamme, diagenesis, Aogashima, Kuroshio, explosive volcanism, submarine volcanism
MS 350-103: Published 30 May 2015
Background and objectives
International Ocean Discovery Program (IODP) Site U1436 was drilled as a geotechnical survey requirement for proposed D/V Chikyu drilling at Site IBM-4. Site U1436 is located at 32°23.88′N, 140°21.93′E in the Izu arc (Figure F1). It lies 1776 m below sea level in the western half of the Izu fore-arc basin, about 60 km east of the arc-front volcano Aogashima (Figures F1B, F2) and 170 km west of the axis of the Izu-Bonin Trench (Figure F3). Because Site U1436 is a geotechnical hole for proposed Site IBM-4, the first part of this section focuses on the background and objectives for Site IBM-4 ultradeep (~5.5 km) drilling to arc middle crust, which is inferred to represent juvenile continental crust. However, Site U1436 yielded a rich record of Quaternary explosive volcanism; therefore, the second half of this section provides background on Quaternary volcanism in the Izu-Bonin arc and objectives for ash recovered.

Figure F1. Tectonic setting of IBM arc.
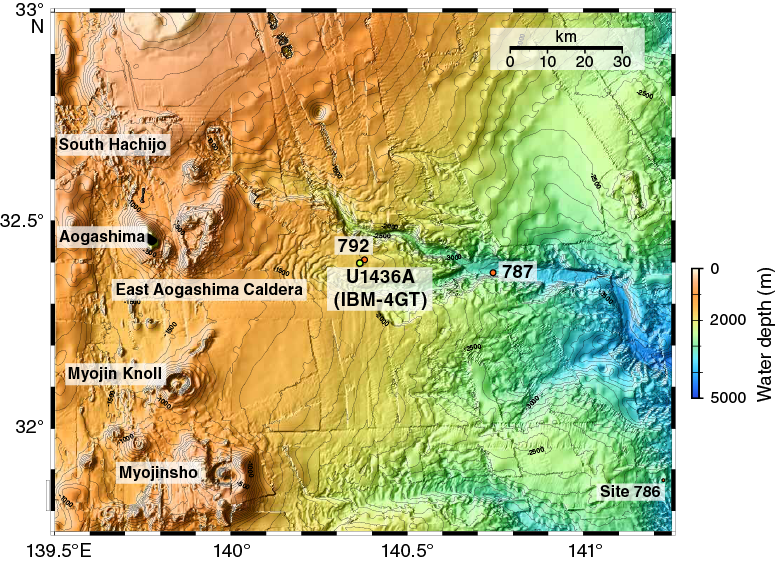
Figure F2. Location of Site U1436.

Figure F3. Izu arc seismic stratigraphy.
IODP Expedition 350 drilled only 150 m at Site U1436 because this was sufficient to meet the geotechnical survey requirements for Chikyu drilling. We successfully obtained 10 geotechnical core samples from 2.5 to 104 meters below seafloor (mbsf), which have been kept in the refrigerator for postcruise transfer to the Kochi Core Center.
The main objective for Expedition 350 was to drill rear-arc IODP Site U1437 (Figure F1B). However, Site U1436 is highly complementary to Site U1437 in terms of understanding the Izu arc system as a whole.
Site U1436 lies only about 1.5 km west of Ocean Drilling Program (ODP) Site 792 (Figure F2) (Shipboard Scientific Party, 1990; Taylor, 1992), so in this site chapter comparisons are made between Site U1436 (150 m) and the uppermost 150 m of Site 792. The 150 m thick interval cored at Site U1436 and described as Unit I was also cored and described at Site 792 as part of the 184 m thick Unit I (Figure F4). At Site 792 (Shipboard Scientific Party, 1990), Unit I was described as silt/clay, although ash intervals were described. In contrast, in this site report we carefully quantify the explosive volcanic contribution to Unit I. We describe the same section as tuffaceous mud intercalated with intervals of mafic ash and lapilli-ash and evolved ash and lapilli-ash, for a total of ~40 m of tuffaceous mud and ~26 m of ash and lapilli-ash. Site 792 was estimated to have an average of one ash interval per meter, whereas we quantitatively show below that the same part of the section has a much higher average of 2.3 ash intervals per meter (see Lithostratigraphy). At Site 792, the calculated sedimentation rate for 0–87 mbsf is ~81 m/My, which is very similar to the minimum overall sedimentation rate since the Brunhes/Matuyama boundary (at ~56 mbsf) at Site U1436, ~73 m/My. Furthermore, because we used more rigorous techniques to determine the ratio of tuffaceous mud to volcaniclastic intervals, we can determine the rate of deposition of tuffaceous mud as 44 m/My. This rate is relatively high, reflecting the addition of volcanic ash to the hemipelagic component.
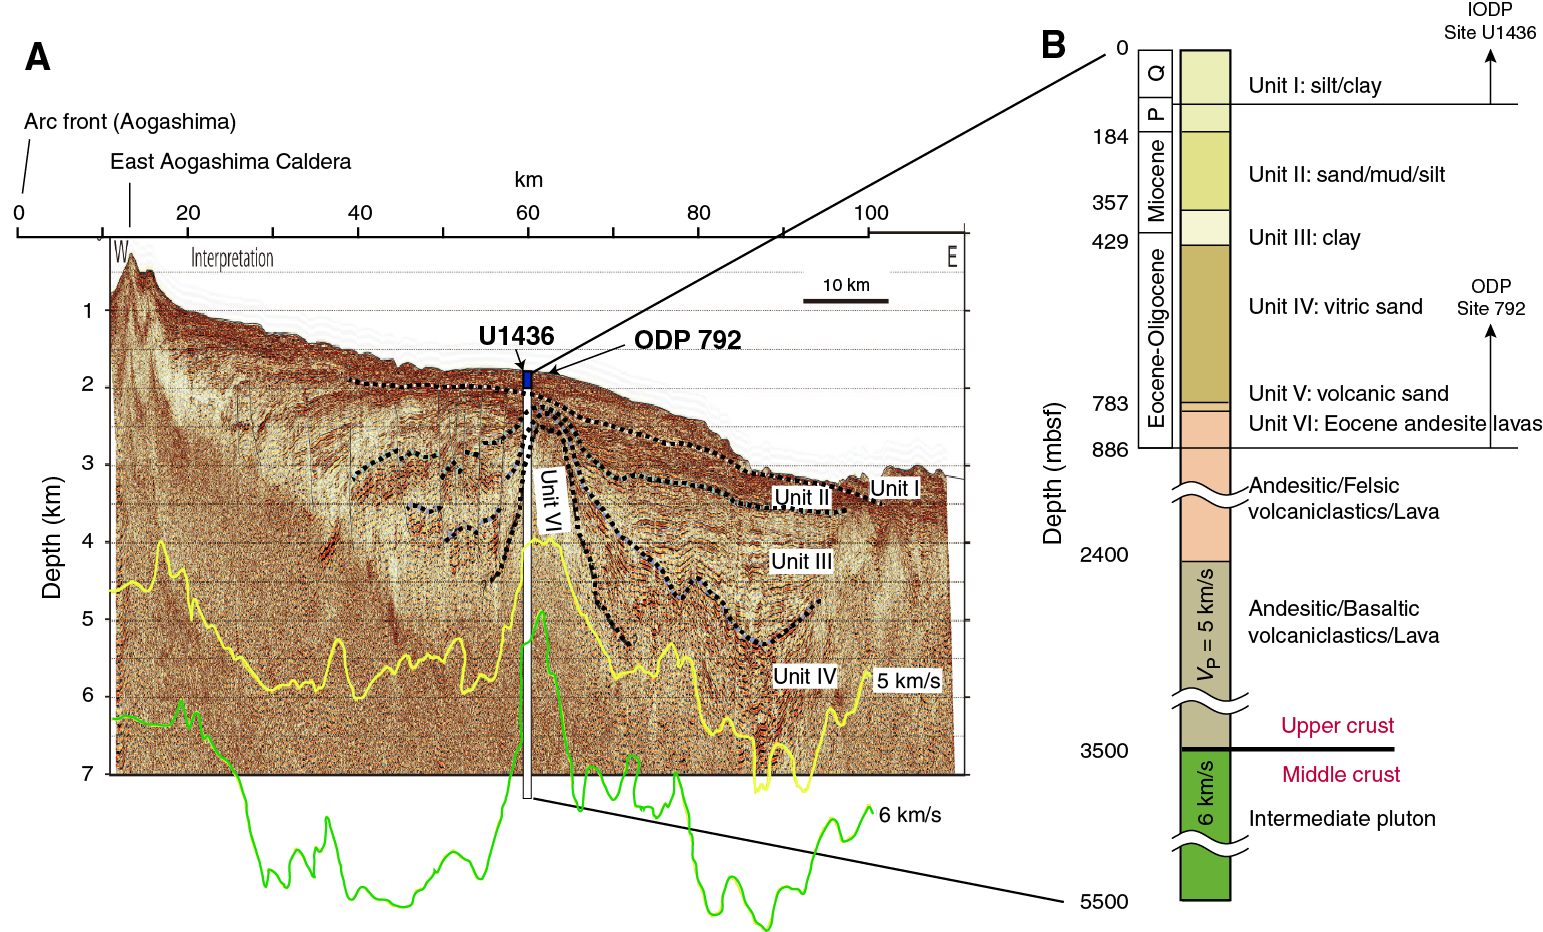
Figure F4. Time-migrated MCS section IBM4-EW5.
Site 792 penetrated much deeper than Site U1436, coring Quaternary to Oligocene volcaniclastic sediments to 804 mbsf and an additional 82 m of andesite lava with minor breccia and hyaloclastite to 885.9 mbsf (Figure F4). The lava was referred to as “basement” (Shipboard Scientific Party, 1990; Taylor, 1992). K-Ar ages were used to estimate a minimum basement age of 33 Ma (Shipboard Scientific Party, 1990), or early Oligocene. However, more recent 40Ar/39Ar dating on samples from two different depths gave consistent and well-defined plateaus of 40.4 ± 0.8 Ma and 40.6 ± 0.3 Ma, or Eocene ages (Ishizuka et al., 2011). The lava is inferred to form the upper part of a buried, conical Eocene volcanic edifice identified in multichannel seismic (MCS) surveys (Figure F4). This conical edifice in turn lies along a segment of the north–south Shin-Kurose Ridge (Honza and Tamaki, 1985), which is also referred to as the fore-arc high (Shipboard Scientific Party, 1990), shown in Figure F5. The Shin-Kurose Ridge/fore-arc high is defined by long-wavelength magnetic anomalies identified by Yamazaki and Yuasa (1998); it forms a bathymetric feature in the northern Izu arc and is buried beneath Quaternary to Oligocene sediments to the south at Site 792 (Figure F4). The Shin-Kurose Ridge/fore-arc high is interpreted to consist of Eocene arc-front rocks. It is inferred that most of the Izu-Bonin crust was generated in Eocene–Oligocene time, so it is this “basement” that is the target of Site IBM-4. The goal for Site IBM-4 is to reach the arc middle crust by ultradeep drilling. Site IBM-4 was selected because the boundary between the upper and middle crust appears to be relatively shallow there.

Figure F5. Bathymetric features of the eastern Philippine Sea.
Site IBM-4
The main objective of Site IBM-4 is to determine how continental crust forms in an oceanic-arc setting (Figure F6). The IODP Initial Science Plan states “The creation and growth of continental crust remains one of the fundamental, unsolved problems in Earth science” (Bickle et al., 2011). The formation and evolution of continental crust is a first-order problem of terrestrial geochemistry because for many trace and minor elements, this reservoir is quantitatively important, despite its volumetric insignificance on a planetary scale. In the latter part of the 1960s, Taylor (1967) proposed the “andesite model” for the origins of continental crust on the basis of similarities between “calc-alkaline” or orogenic andesite formed in arc volcanoes and the “intermediate” bulk composition (~60 wt% SiO2) of this crustal type. For many arc enthusiasts, this observation has been a prime motivation for studies of island and continental arc systems. Subsequent studies have substantiated Taylor’s estimate of continental crust bulk composition and have noted that distinctive continental trace element fractionations (e.g., high U/Nb and Pb/Ce) are only found in suprasubduction zone magma types (Hofmann, 1988). Trace element patterns of continental crust and intraoceanic subduction zone primary magmas show similar negative and positive anomalies (Figure F7), but quantitatively, the differences of values can be explained neither by the degree of partial melting in the mantle source nor by differentiation from a primary basalt magma. Ultradeep drilling into arc crust is the best way to sample unprocessed juvenile continental-type crust as first generated at intraoceanic arcs to observe the processes that produce the nuclei of new continental crust (e.g., Tatsumi and Stern, 2006; Tatsumi et al., 2008).
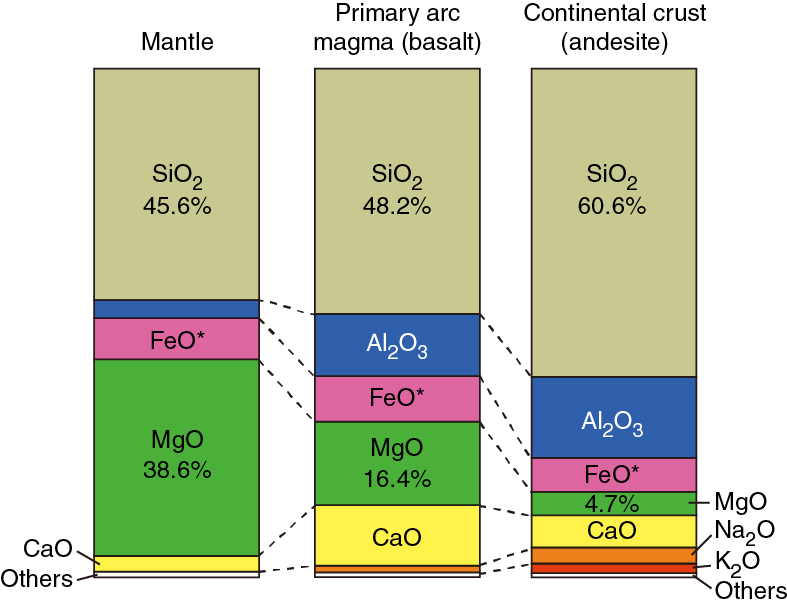
Figure F6. Major element compositions.
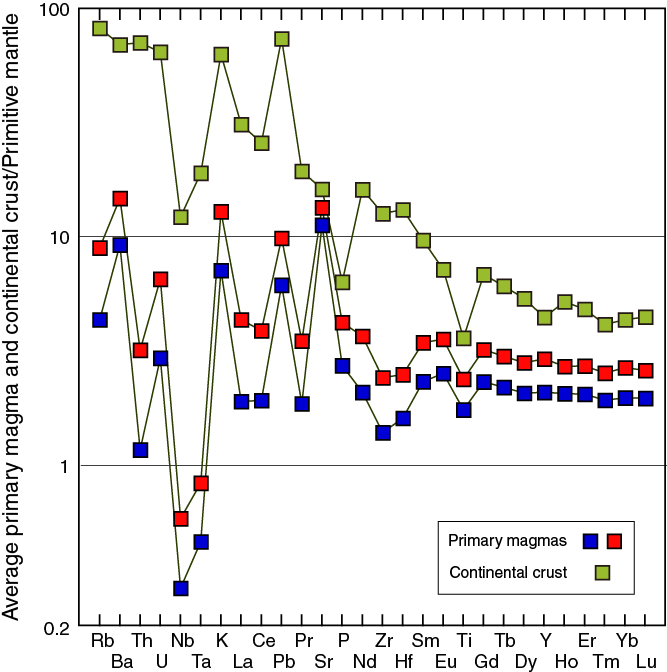
Figure F7. Primitive mantle–normalized trace element patterns.
Quaternary volcanism
The Izu-Bonin-Mariana (IBM) volcanic arc system is an excellent example of an intraoceanic convergent margin where the effects of crustal anatexis and assimilation are considered to be minimal (Stern et al., 2003; Tatsumi and Stern, 2006) (Figure F1). However, volume-weighted histograms of rock types from the Quaternary Izu arc (30.5°–35.0°N) suggest that dacite and/or rhyolite also form a major mode, although basalt and basaltic andesite (<57 wt% SiO2) are clearly the predominant eruptive products (Tamura and Tatsumi, 2002) (Figure F8A). About half of the edifices at the Quaternary arc front are submarine calderas dominated by rhyolite (i.e., volcanic rocks with ~70 wt% SiO2) (Yuasa and Kano, 2003). Turbidites sampled during ODP Leg 126 in the Izu arc, which range in age from 0.1 to 31 Ma, are similarly bimodal (Gill et al., 1994). Rhyolites were also abundant in the Oligocene and Eocene (Reagan et al., 2008), so the Izu-Bonin-Mariana oceanic arc has included abundant rhyolite from its earliest stage to the present. This is not unique to the Izu arc. The 30.0°–36.5°S sector of the Kermadec arc is another example of an oceanic arc with abundant Quaternary rhyolites (Smith et al., 2003, 2006; Wright et al., 2006) (Figure F8B). Thus, the crustal evolution of oceanic arcs must explain bimodal volcanism of basalt and rhyolite. Radiogenic isotopes (Figure F9) show that basalt-dominated volcanoes and rhyolite-dominated volcanoes of the Izu arc front are clearly distinguishable from active rift lava and rear-arc lava, which have less radiogenic Sr, Nd, and Pb isotopic compositions (Hochstaedter et al., 2001; Ishizuka et al., 2003).
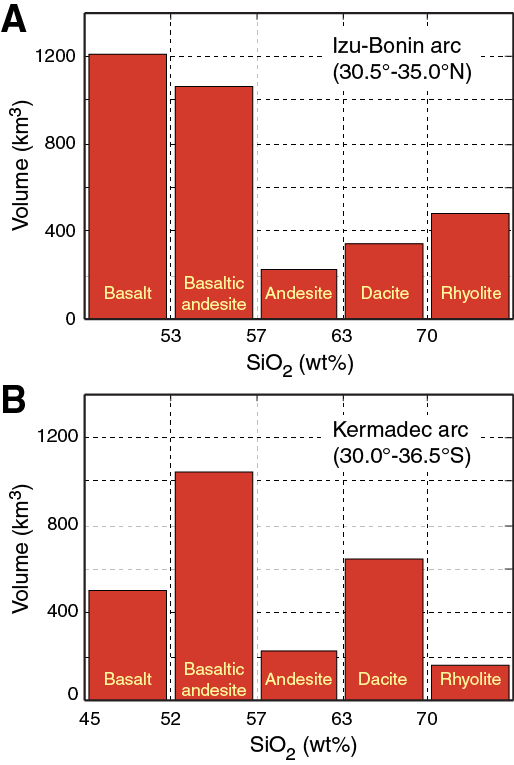
Figure F8. Volume-weighted histograms of rock types.
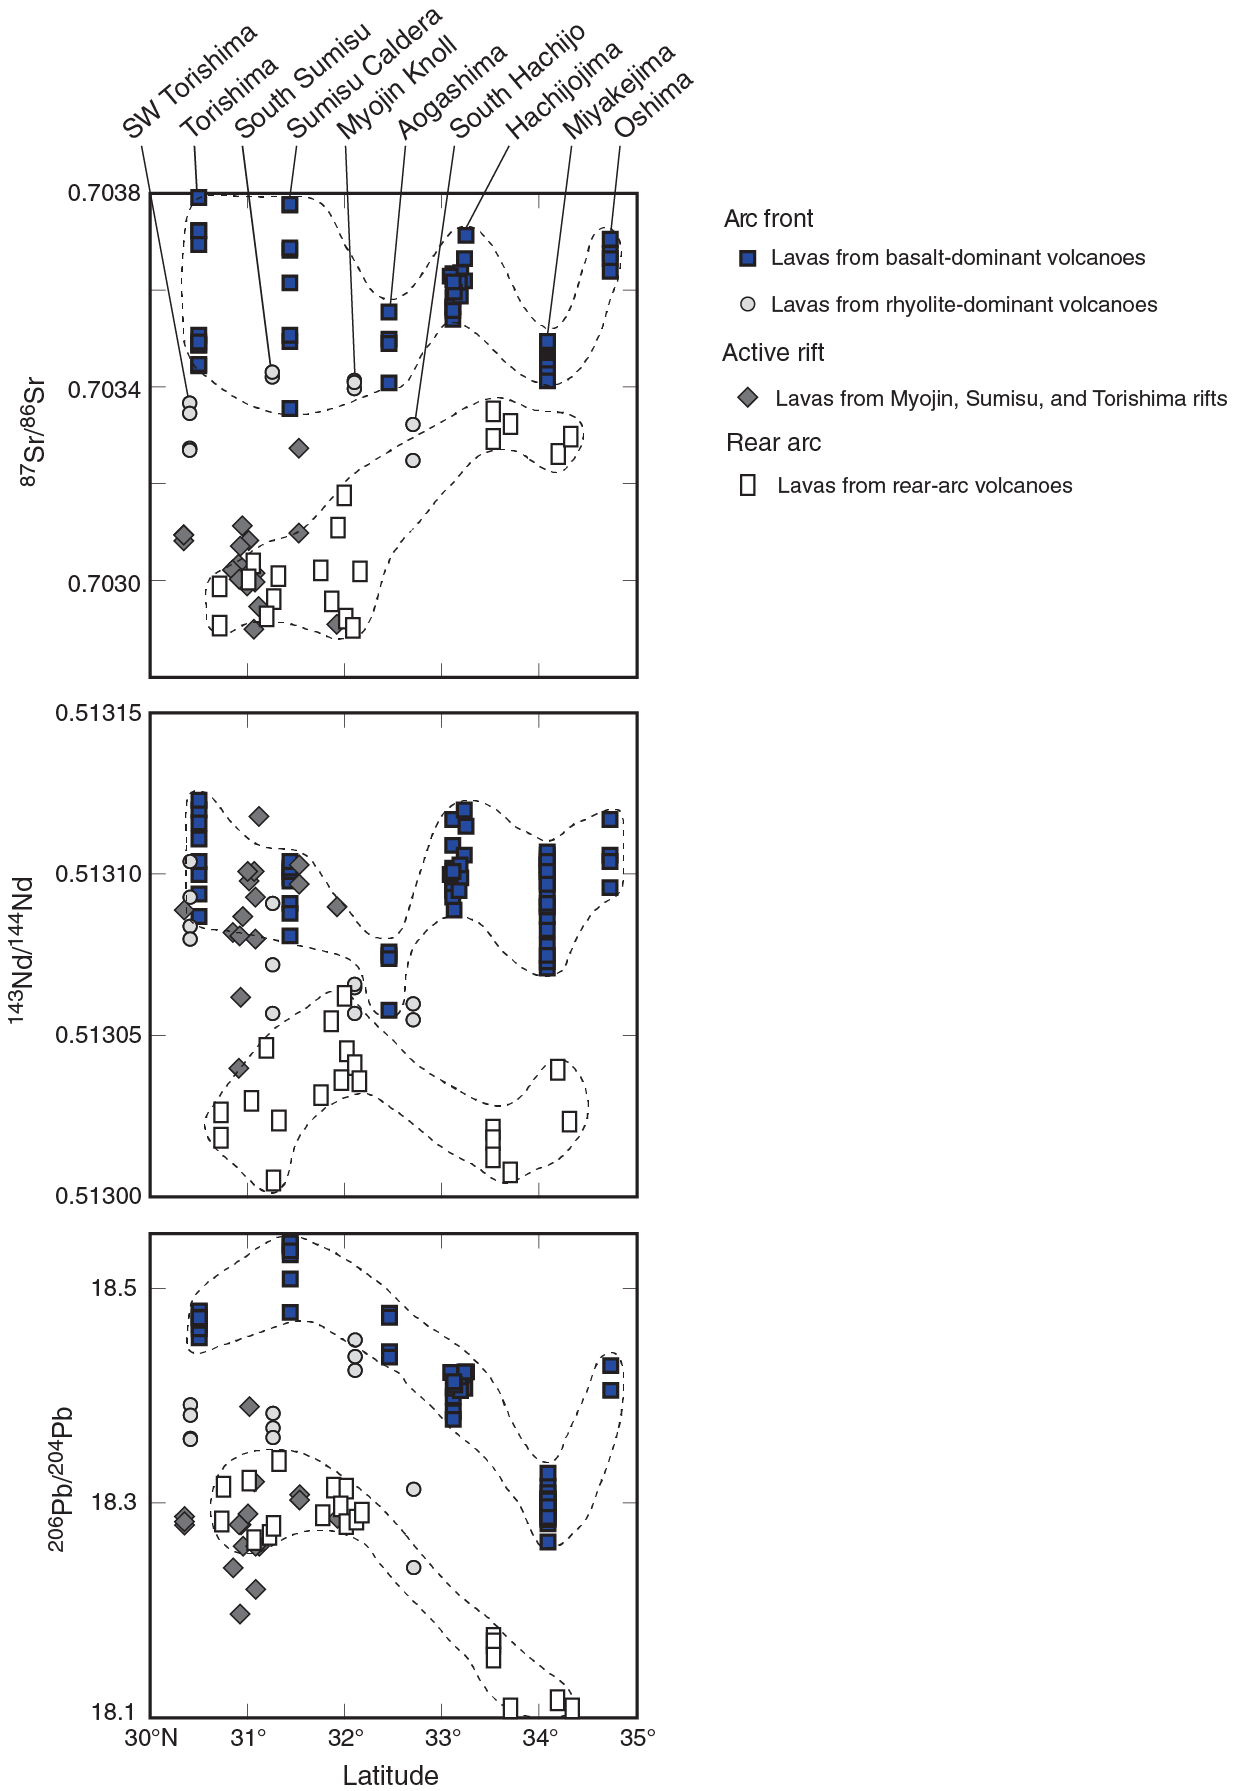
Figure F9. Sr, Nd, and Pb isotopes along the Izu arc front.
Along the Izu Quaternary arc front, along-strike correlations exist between crustal structure derived from active source wide-angle seismic study (Kodaira et al., 2007a) and the average composition of magmas of arc front basalt-dominant island volcanoes and rhyolite-dominant submarine calderas (Figure F1B). In terms of the average SiO2 content (wt%) of Quaternary arc-front volcanic rocks and the thickness of the middle crust along the arc front (Figure F10, based on Kodaira et al. [2007a]; Tamura et al. [2009]), (1) there is a remarkable along-arc periodic variation in average crustal thickness with a wavelength of ~80–100 km produced by variations in the thickness of the middle crust (whereas the lower crust has uniform thickness) and (2) there are periodic variations that correlate well with the average chemical composition of the overlying arc volcanoes; that is, the thicker middle crust underlies the basaltic island volcanoes, whereas the thinner middle crust underlies the rhyolitic submarine volcanoes (mainly calderas) (Kodaira et al., 2007a). It is remarkable that the velocity structure of this part of the Izu arc crust, which has a complex 50 My history, correlates with the chemical composition of the Quaternary volcanoes. Moreover, why should basaltic volcanoes overlie lower average velocity (more continental-like) crust compared with the silicic volcanoes, and why should rhyolitic volcanoes overlie thinner middle crust? Perhaps this can be explained by assuming that the silicic volcanoes formed by melting of Eocene–Oligocene arc crust (Tamura et al., 2009); this process may have thinned the middle crust beneath them in some way. However, more information is needed about the middle crust to test this hypothesis.

Figure F10. Along-arc crustal structure.
Although Site U1436 was scheduled as a 150 m deep geotechnical hole for Site IBM-4, the 66 m of core recovered also provided a nearly complete record of Late Pleistocene (<0.9 Ma) sedimentation, with much poorer recovery below (late Pliocene, 2.7 Ma; see Age model). One of the main objectives at Site U1436 was to “test drive” a newly devised descriptive scheme for volcaniclastic rocks, drafted at a workshop in January 2014 and elaborated during the first part of Expedition 350. This scheme was devised to facilitate the understanding of volcano-sedimentary processes by making observations of volcanic and sedimentary input highly quantifiable, with values that are easily searchable, through entry into a standardized logging sheet (DESClogik; see the Expedition 350 methods chapter [Tamura et al., 2015a]).
A major objective of Site U1436 was to characterize the age, chemistry, and provenance of Site U1436 explosive volcanic products. Because the wind blows predominantly from west to east over the Izu arc, the fore arc is a repository of ash/tuff erupted in the Izu arc front, although some ash/tuff may have come from farther away in the broader Japan area. Effusive eruptive products are better preserved on the arc-front islands, whereas deep marine basins form a complement by preserving more of the explosive products.
Operations
The transit from Keelung, Taiwan, started on 4 April 2014 and ended at 1142 h on 8 April, marking the beginning of operations at Site U1436. All times reported here are ship local time, which was UTC + 9 h. See Table T1 for the site coring summary.
Table T1. Coring summary, Site U1436. Download table in .csv format. View PDF table.
Hole U1436A
An advanced piston corer (APC)/extended core barrel (XCB) bottom-hole assembly (BHA) was built and deployed to a depth of 1781 meters below rig floor. The subsea camera was lowered to the bottom, and a seafloor survey was conducted to determine if any subsea communications cables could be found in the drilling area. None were found. After visually confirming that the drill pipe tagged the seafloor, the camera was retrieved. Coring in Hole U1436A (32°23.883′N, 140°21.928′E; 1775 m water depth) commenced at 0705 h on 9 April. Cores 350-U1436A-1H through 9H (0–59.7 mbsf) cored with the APC system yielded 59.4 m of core (99% recovery). Cores 10F through 12F (59.7–65.0 mbsf) drilled with the half-length APC (HLAPC) system retrieved a total of 5.22 m of core (98% recovery). The rate of penetration with the HLAPC decreased exponentially, and we switched to the XCB system. Cores 13X through 21X (65.0–150.0 mbsf; total depth) recovered only 7.1 m of core (8% recovery). The drill string was recovered and the bit cleared the rotary table at 1245 h, ending operations in Hole U1436A. Hole U1436A was completed with a total of 21 cores for a total of 150 m cored and 71.6 m recovered (average recovery = 48%). The rig was secured for transit to Site U1437 (proposed Site IBM-3C).
Return to Site U1436
After operations were prematurely terminated at Site U1437, the science party decided to use the remaining time to attempt to recover undisturbed sections containing conspicuous black glassy mafic ash layers found 7 weeks earlier at ~50 mbsf in Hole U1436A, which was severely disturbed by coring. This would better constrain the thickness to assist in determining the explosivity of the eruption that generated them. The short transit to Site U1436 took from 0930 to 1700 h on 25 May 2014.
Hole U1436B
An APC/XCB BHA was made up and deployed to the seafloor. Hole U1436B (32°23.896′N, 140°21.929′E; 1774 m water depth) was positioned 20 m north of Hole U1436A, and coring was initiated at 0015 h on 25 May. Cores 350-U1436B-1H through 14H (0–61.8 mbsf) obtained 61.79 m of core (100% recovery). After the target depth of ~62 mbsf was reached, the bit was raised and cleared the seafloor at 1425 h.
Hole U1436C
The ship moved 20 m south of Hole U1436A, where Hole U1436C (32°23.873′N, 140°21.930′E; 1775 m water depth) was initiated at 1545 h on 25 May. Cores 350-U1436C-1H through 18F (0–70.4 mbsf) obtained 70.38 m of core (100% recovery). The sequence recovered in Hole U1436C had less coring disturbance than sequences obtained in Holes U1436A and U1436B, particularly over the target interval near 50 mbsf, presumably owing to the more extensive use of the HLAPC. Operations in Hole U1436C ended when the bit cleared the seafloor at 1255 h on 27 May.
Hole U1436D
We decided to make a last attempt to recover the black glassy mafic ash layer undisturbed in the shortest amount of time possible. The ship moved 20 m east of Hole U1436A, where Hole U1436D (32°23.885′N, 140°21.942′E; 1775 m water depth) was initiated at 1355 h on 27 May, using a center bit to wash down to 40 mbsf. Cores 350-U1436D-2F through 9F (40–62.0 mbsf) obtained 22.07 m of core (100% recovery). Although several cores in Hole U1436D were plagued by a large proportion of impenetrable volcaniclastics that fell into the hole from further up in the formation, presumably due to washing down to 40 mbsf, we did eventually, after a discussion of the circumstances with the Tool Pusher on shift, recover excellent cores containing the targeted volcaniclastic layers. The last core of Expedition 350, Core 350-U1436D-9F, arrived on deck at 0210 h on 28 May.
The ship remained on station at Site U1436 until departure for Yokohama, Japan, at 0930 h on 29 May. The transit took 24 h to the pilot station, and the ship was dockside at 1100 h on 30 May, ending Expedition 350.
Lithostratigraphy
Four holes were drilled at Site U1436 (Holes U1436A, U1436B, U1436C, and U1436D), recovering 71.64, 61.79, 70.38, and 22.07 m of core, respectively. The purpose of drilling Holes U1436B–U1436D was to recover undisturbed the mafic ash layers seen in Hole U1436A (intervals 350-U1436A-8H-1, 0 cm, to 8H-2, 108 cm [51.58–52.66 mbsf], and 8H-3, 49–64 cm [53.47–53.62 mbsf]). In Hole U1436A, these layers are disturbed by coring (sediment flowage, soupy, and fall-in), and the true thickness remains uncertain.
Sediment recovered in Holes U1436A–U1436D is described as a single lithostratigraphic unit (Unit I). In Hole U1436A, Unit I consists of tuffaceous mud intercalated with intervals of mafic ash, scoria lapilli-ash (~80 intervals), evolved ash, and pumice lapilli-ash (~70 intervals); Figure F11 is an example of a typical core (350-U1436A-3H). The total thicknesses are ~40 m of tuffaceous mud and ~26 m of volcaniclastic sediments (Figure F12). The mafic intervals are on average thicker than the evolved beds, for a total mafic to evolved thickness ratio of approximately 1.5:1 (Figure F13).
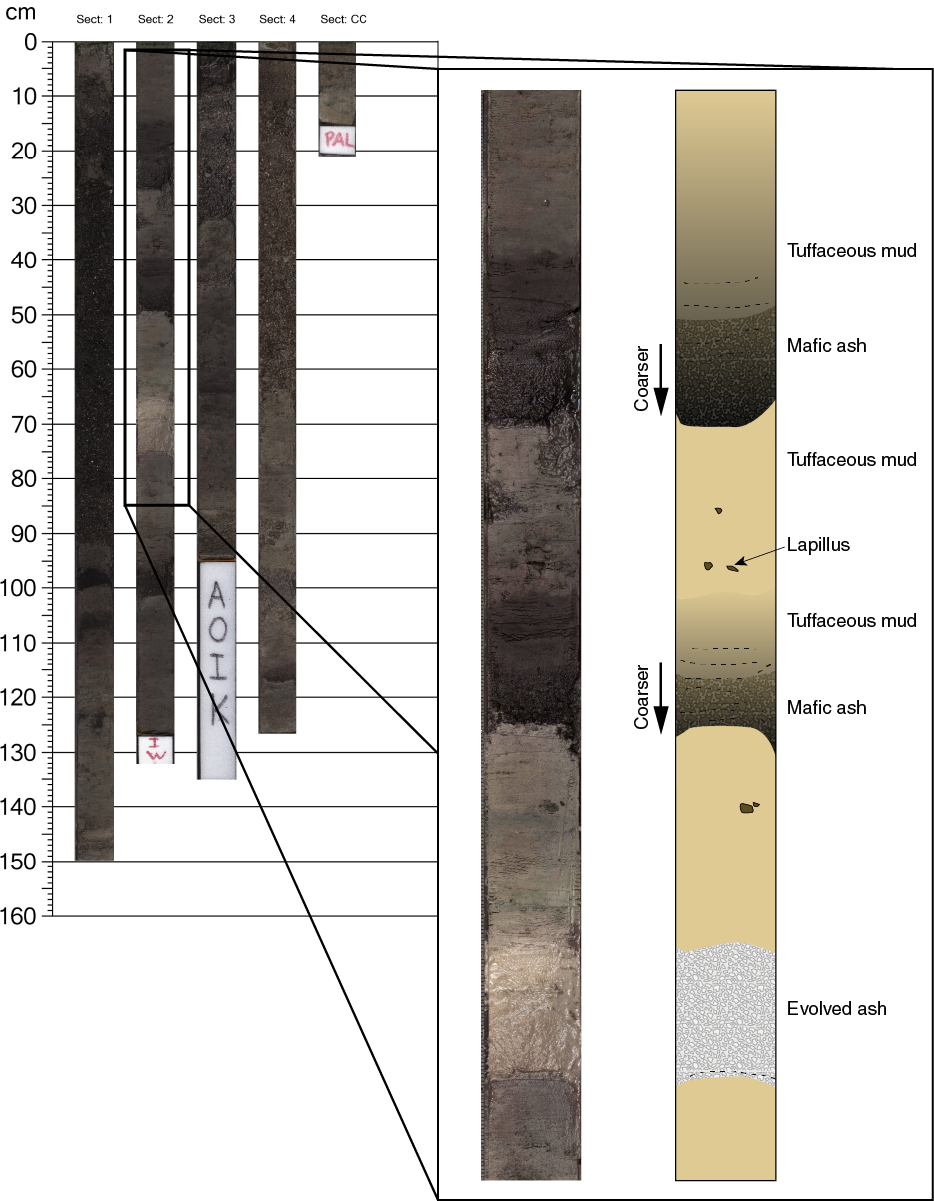
Figure F11. Composite core scan (350-U1436A-3H).
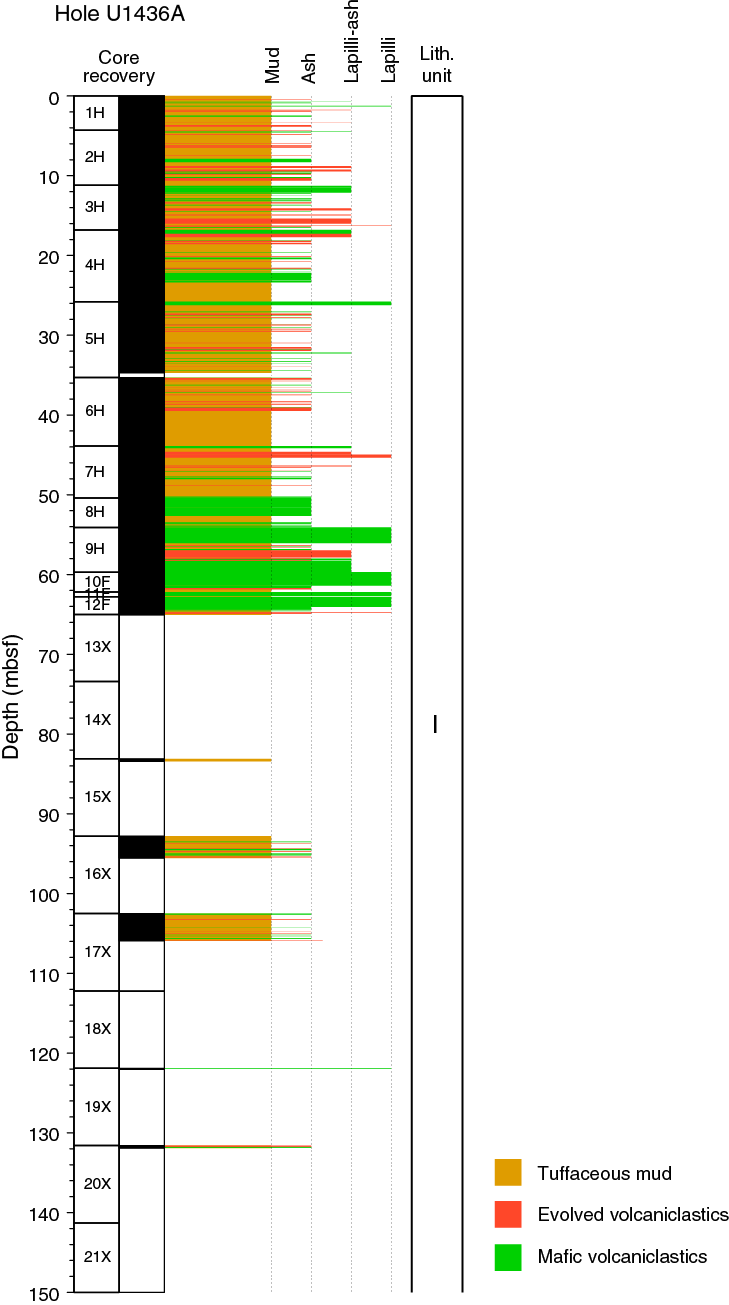
Figure F12. Summary lithostratigraphic log, Hole U1436A.

Figure F13. Downhole evolution in proportions of lithofacies, Hole U1436A.
The discrete ash intervals at Site U1436 appear to be similar to what was described as “vitric sand” intervals during ODP Legs 125 and 126 in the Izu fore arc. In Leg 125 and 126 cores, many intervals are normally graded, have a similar range in color of the glass shards, and contain a significant amount of phenocrysts (mostly plagioclase, pyroxene, and opaque minerals).
In this section we describe (1) the effects of core disturbances, (2) the five lithofacies identified within Unit I, and (3) correlations between the holes.
Core disturbance
Six types of core disturbance (see the Expedition 350 methods chapter [Tamura et al., 2015a]; Jutzeler et al., 2014) disrupt the lithostratigraphy at Site U1436:
- Fall-in and basal flow-in core disturbances create coarse clast-supported polymictic intervals at the tops of many cores (e.g., Core 350-U1436A-9H) and at the bases of others (e.g., Core 7H). Original lithofacies and sedimentary structures are usually destroyed in these intervals.
- Sediment flowage within core sections (e.g., Section 350-U1436A-2H-4) creates matrix-supported polymictic intervals. Original lithofacies and sedimentary structures are usually degraded.
- Soupy core disturbance is restricted to water-saturated, unconsolidated ash intervals destroying original internal structures (e.g., Section 350-U1436A-8H-1).
- Core extension fragments the core until it becomes sheared or brecciated (e.g., Sections 350-U1436A-4H-4 and 16X-1) or until it extends the thickness of granular clastic layers. Original lithofacies and sedimentary structures are usually still readily identified, although the contacts between intervals and stratifications in granular layers are commonly lost.
- Mid-core flow-in disturbance creates allocthonous beds or thickens preexisting units (e.g., interval 350-U1436A-8H-3, 49–64 cm).
Description interval lithofacies
Tuffaceous mud
The most abundant lithofacies is tuffaceous mud in intervals that average 0.25 m in thickness and are up to 4.20 m thick. Tuffaceous mud is light to dark gray-brown, commonly with a greenish hue (Figure F14). It is massive (i.e., lacks laminations) and sticky to the touch. The ash component is dispersed in the tuffaceous mud and consists of glass shards with rare crystals; rare, isolated, rounded pumice clasts are present, but they are usually poorly preserved.
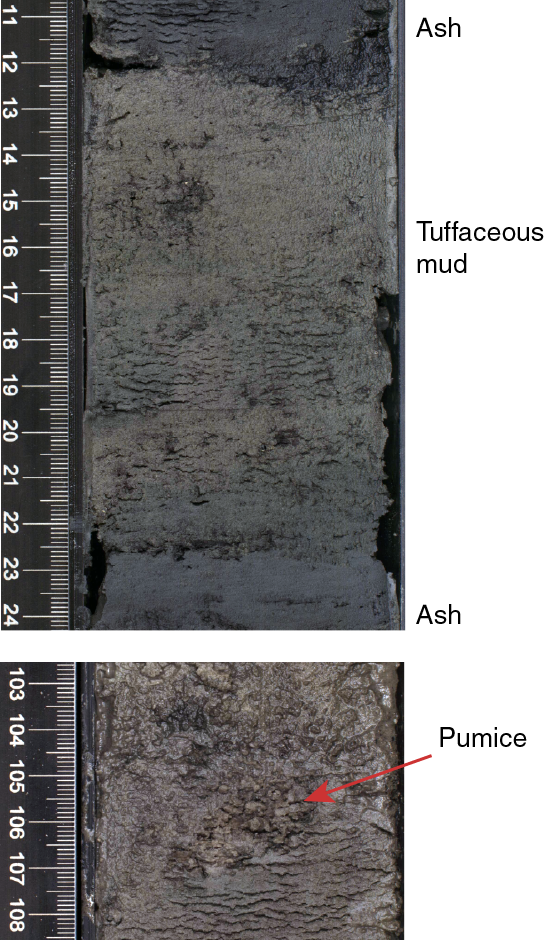
Figure F14. Tuffaceous mud, Hole U1436A.
Mafic ash
Mafic ash intervals are black to dark gray volcaniclastics (Figure F15) in thin (<1 cm) to thick (≤24 cm) intervals (Figures F11, F12). The mafic ash layers are generally massive and are commonly normally graded. Lower boundaries are sharp to gradational, and many mafic ash layers show gradational upper contacts because of a gradual upward increase in mud content. Mafic ash consists of silt- to sand-size scoria and brown glass shards with subordinate crystals (feldspar, ferromagnesian silicates, and opaques) and minor volcanic lithic clasts. Foraminifers are common trace constituents in mafic ash intervals.
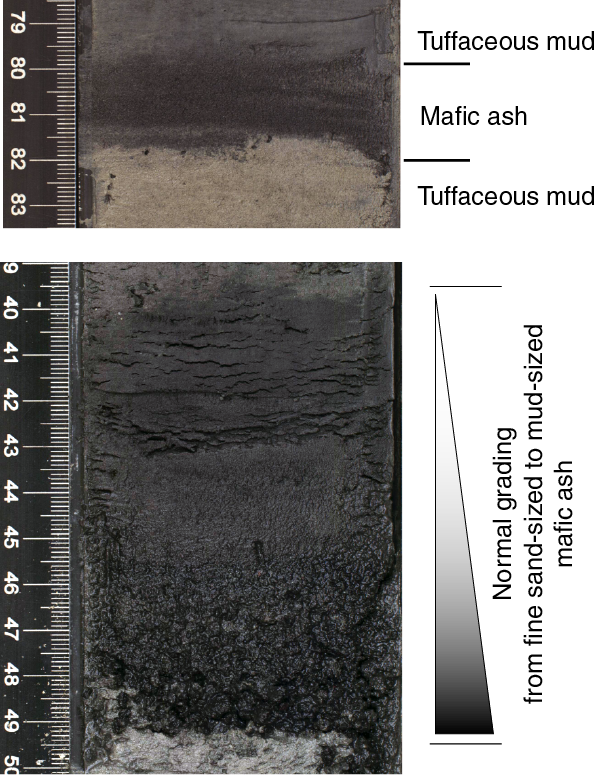
Figure F15. Mafic ash, Hole U1436A.
Three intervals of mafic ash lithofacies contain scoria lapilli, either as isolated pebble-sized clasts (interval 350-U1436A-1H-1A, 64–66 cm; Figure F16) or as granules within normally graded lapilli-ash intervals (1H-1A, 123–130 cm, and 6H-2A, 36–43 cm). Smear slides of some of these scoria lapilli show evidence for two types of vitric components distinguished by their color and texture.
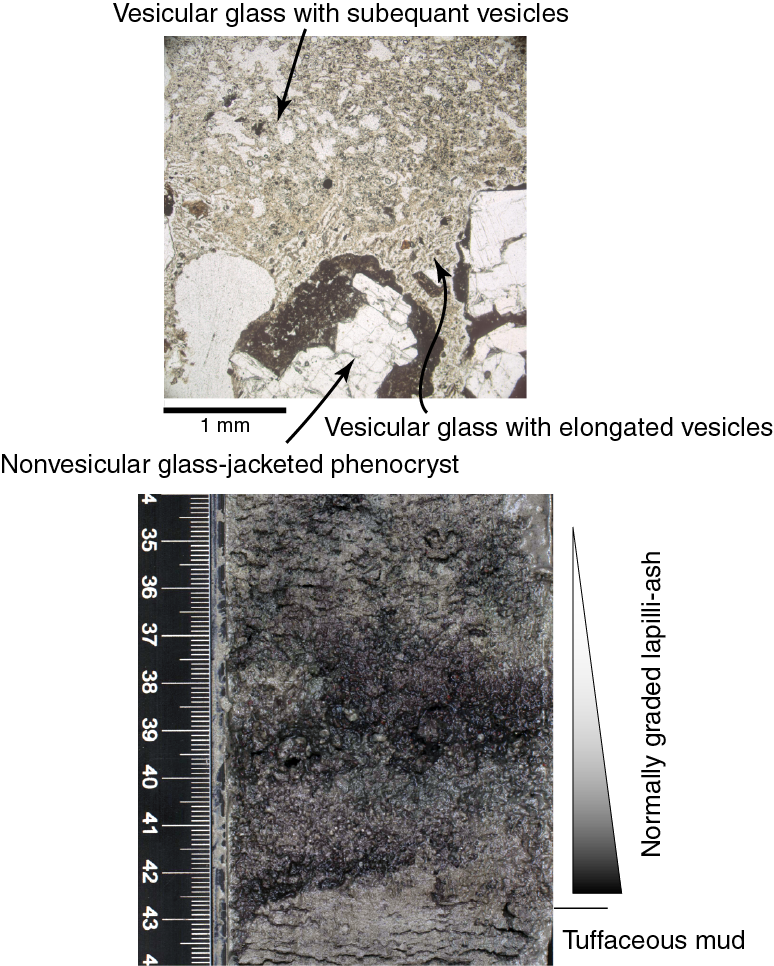
Figure F16. Scoria clast, Hole U1436A.
Black glassy mafic ash
One distinctive interval of black glassy mafic ash is recognized in all of the holes (Figure F17). This interval consists of massive, nongraded, well-sorted black glassy mafic ash with trace amounts of foraminifers. Under the microscope, the black glassy mafic ash is dominated by pale to dark brown shards (Figure F18) with sparse subhedral feldspar and clinopyroxene crystals. Juvenile particles are texturally varied: vesicular (including scoriaceous) and nonvesicular shards that are blocky and occasionally cuspate (i.e., bubble-wall). Most shards are glassy (i.e., microlite-free); however, many shards are weakly to moderately microcrystalline. The black glassy mafic ash is commonly soupy and water-logged and strongly disturbed (Figure F17). Two intervals of black glassy mafic ash were recovered in Hole U1436A at 50.40–52.66 (interval 350-U1436A-8H-1A, 0 cm, to 8H-2A, 108 cm) and 53.47–53.62 mbsf (interval 8H-3A, 49–64 cm). The 2.26 m thick interval is affected by fall-in, and the 0.15 m thick interval represents mid-core flow-in (Figure F18). However, in Holes U1436C and U1436D, the layer is bounded top and bottom by tuffaceous mud without obvious intrusion by sediment flow (Figure F19), and the layer is similar thickness (55 and 58 cm, respectively); because the layer extends across two sections in Hole U1436C (interval 350-U1436C-11F-1A, 106 cm, to 11F-2A, 40 cm), we take 58 cm as its thickness (interval 350-U1436D-7F-2A, 15–73 cm).

Figure F17. Correlation between all Site U1436 holes.
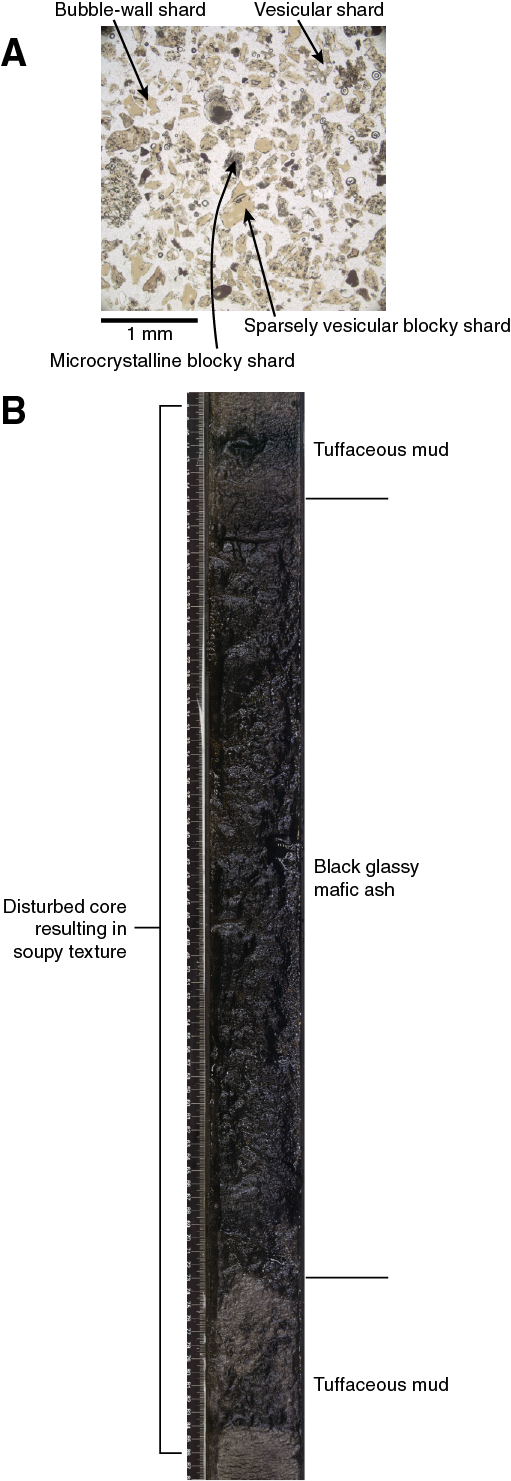
Figure F18. Black glassy mafic ash, Hole U1436A.
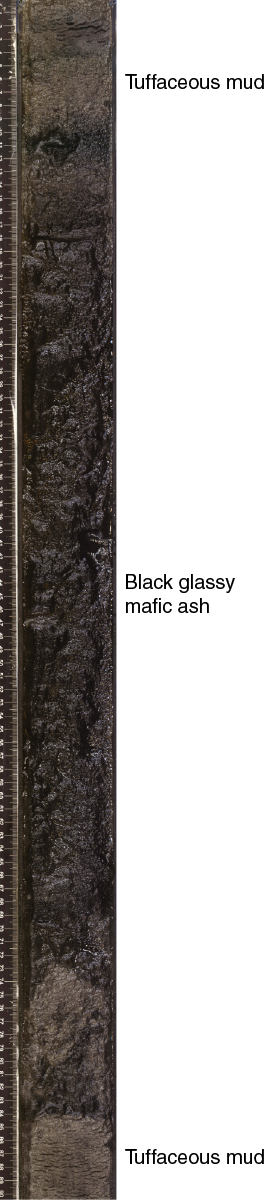
Figure F19. Nongraded, nonstratified layer of black glassy mafic ash, Hole U1436D.
Evolved ash
Evolved ash consists of white to medium gray or pale pink, normally graded or nongraded, very thin (<1 cm) to thick (up to 38 cm) intervals (Figure F20). Medium thickness (10–30 cm) intervals are commonly stratified into several sublayers that vary in color and componentry (e.g., crystal-rich layers versus glass-rich layers). Several intervals of evolved ash contain distinctive grain-supported basal horizons composed almost entirely of euhedral quartz and hornblende crystals, grading upward into finer grained pumice, glass shards, and small crystal fragments (e.g., interval 350-U1436A-4H-2, 10–29 cm). The upper contacts of many evolved ash intervals are altered to glauconite, although X-ray diffraction will be required to confirm this. Several of the evolved ash intervals are distinctive enough to act as marker layers that are used to correlate the holes at Site U1436 (below).
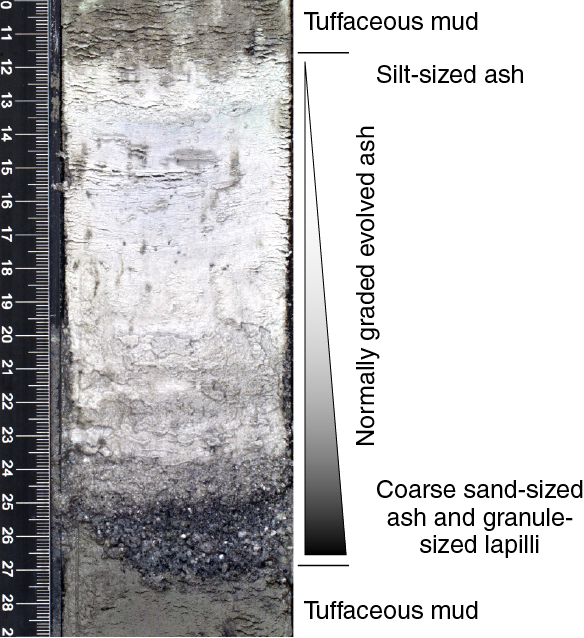
Figure F20. Normally graded evolved ash, Hole U1436A.
Evolved lapilli-ash with pumice
Evolved lapilli-ash intervals consist of yellowish white, normally graded, medium to thickly bedded with lapilli-size (>2 mm) pumice clasts in an ash matrix that is the same as the evolved ash described above (Figure F21). Two of the evolved lapilli-ash intervals (350-U1436A-2H-4, 42–64 cm, and 3H-3, 8–33 cm) contain pumice and subordinate scoria lapilli. Density grading is common, with denser dark lapilli at the base and pumice lapilli at the tops. The best examples of evolved lapilli-ash with pumice layers are observed in intervals 2H-4, 42–64 cm, 3H-3, 8–33 cm, 3H-4, 0–64 cm, 7H-2, 0–37 cm, and 9H-3, 42 cm, to 9H-4, 57 cm.
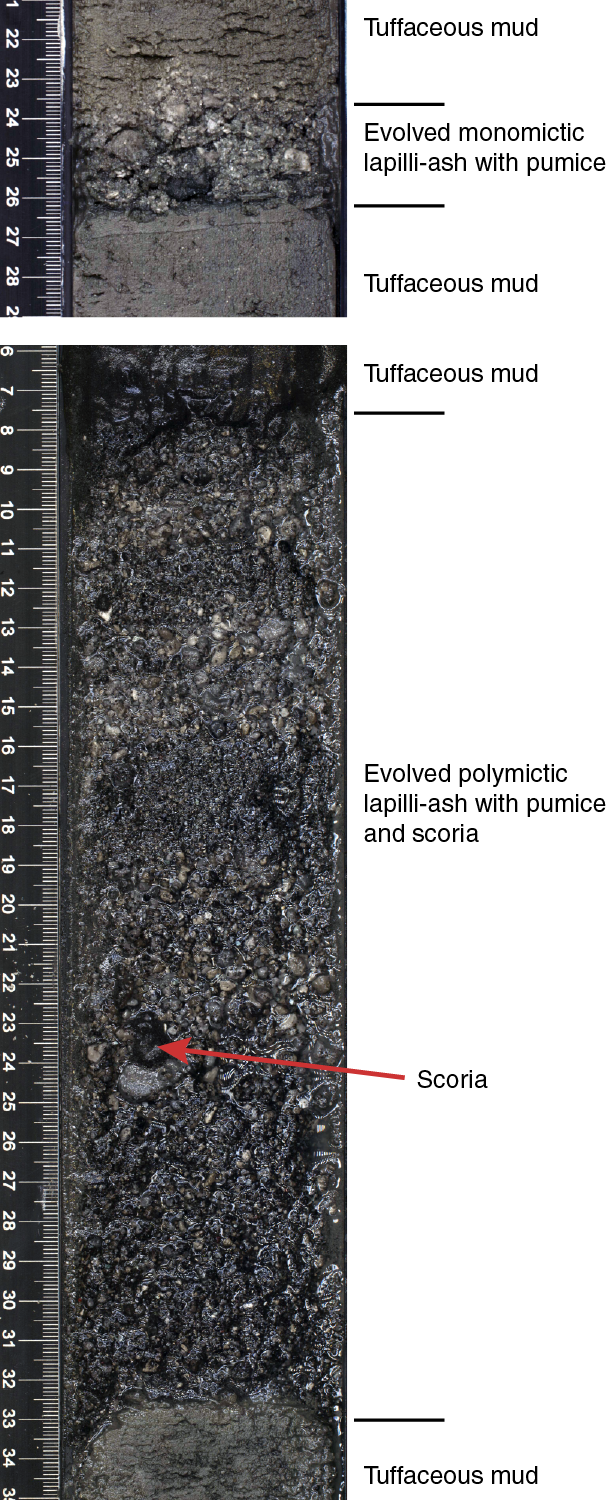
Figure F21. Evolved lapilli-ash, Hole U1436A.
Correlation between Holes U1436A–U1436D
The purpose of drilling Holes U1436B–U1436D 20 m apart was to determine the true, undisturbed thicknesses of any black glassy mafic ash layer(s) present at Site U1436. In this section, we correlate Hole U1436A with Holes U1436B, U1436C, and U1436D and show that (1) the black glassy mafic ash is present in all four holes at around the same depth (~49–53 mbsf) (Figure F17) and (2) a second, thinner (15 cm) black glassy mafic ash layer that lies deeper in Hole U1436A, at 53.47–53.62 mbsf, does not occur in the other three holes and is probably related to mid-core flow-in.
Correlation between lithostratigraphy in the upper 3 m of Holes U1436A–U1436C is excellent (Figure F22), but the stratigraphy is much more complicated below that. Correlation between all four holes (U1436A–U1436D) from 46.15 mbsf and deeper is shown for the purpose of discussing the black glassy mafic ash (Figure F17). Tie lines link evolved and mafic ash layers that form good markers because they are thin and bounded by cohesive tuffaceous mud, making them less susceptible to core disturbance than thicker layer.
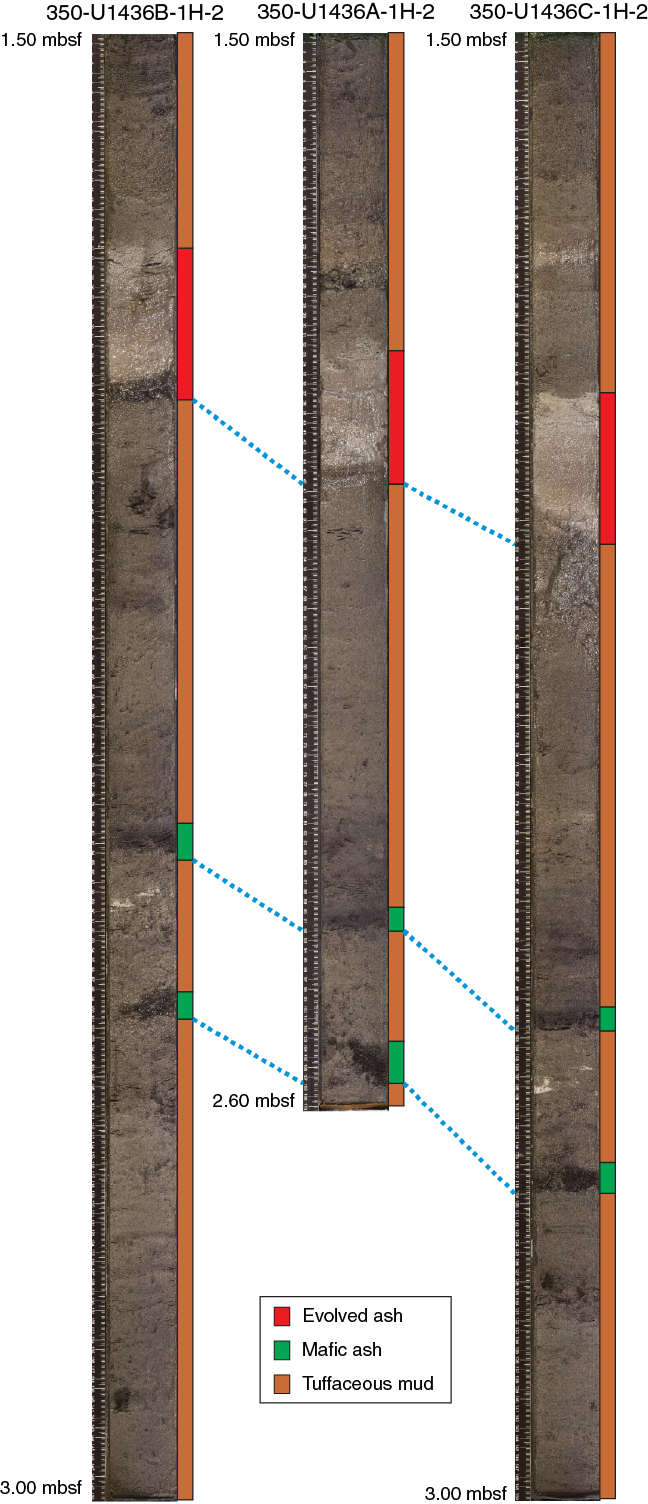
Figure F22. Lithostratigraphy correlation, upper 3 m of Holes U1436A–U1436C.
The thickness of the black glassy mafic ash layer varies between 0.55 and 2.44 m, but as noted above, we take 58 cm as its true undisturbed thickness (Hole U1436D). Downcore from that, in Hole U1436A, lies a 15 cm thick black glassy mafic ash interval (not shown on Figure F17; interval 350-U1436A-8H-3, 49–64 cm [53.47–53.62 mbsf]). This layer is not present in the other three holes; furthermore, it shows evidence of severe mid-core flow-in core disturbance because it is connected to the black glassy mafic ash layer above it by a veneer of black glassy mafic ash inside the core liner, which surrounds the intervening tuffaceous mud. Therefore, we recognize only one in situ black glassy mafic ash layer that is in Hole U1436D.
Discussion
When averaged for each core, mafic and evolved ash relative abundances increase downhole in Hole U1436A to 20% in the top ~17 m of Unit I and then decrease and remain lower (≤10%) to ~50 mbsf, where ash abundances increase again (25%–60%) downhole (Figure F13). These proportions appear similar in Holes U1436B–U1436D, although exact comparisons are difficult and potentially misleading because of differences in recovery and core disturbances. The changes in proportions of ash to tuffaceous mud probably record waxing and waning of bimodal volcanism in the region, superimposed on sustained hemipelagic sedimentation.
Intercalation and mixing of mud with ash between most of the volcaniclastic intervals at Site U1436 (e.g., Figure F11) suggests that the latter are separated by significant periods of time. The thin discrete intervals of mafic and evolved ash were sourced by ash fall from subaerial volcanoes of the Izu arc and possibly also the wider Japan region, as well as from subaqueous explosive eruptions at submarine calderas and volcanoes in the Izu arc. These also produced the ash component within the tuffaceous mud. Isolated pumice clasts in the tuffaceous mud lithofacies may have sunk from pumice rafts or deposited from dilute density currents. Medium- and thickly bedded intervals of evolved lapilli-ash with density grading probably represent eruption-fed density current deposits from Izu arc front subaerial and subaqueous volcanoes and calderas, such as the Aogashima Caldera.
Pyroclast textures in the distinctive black glassy mafic ash interval correlated between Holes U1436A, U1436B, U1436C, and U1436D may indicate an explosive submarine eruption of mafic magma because glassy shards are overwhelmingly dominant over microcrystalline shards, suggesting quench fragmentation, and the componentry is very homogeneous. In Holes U1436C and U1436D, the black glassy mafic ash layer is inferred to preserve primary depositional textures and structures with only minimal core disturbance. Because the black glassy mafic ash interval lacks grading or evidence for in-mixing of lithic volcaniclastic grains or mud and has almost uniform componentry, it is inferred to have had been efficiently sorted by water.
The distinctive black glassy mafic ash interval should be present in the core from nearby ODP Leg 126 Site 792A (Fujioka et al., 1992). Based on the Site 792A core images, possible equivalents include the following:
- Section 126-792A-6H-3 has three possible black glassy mafic ash layers: (a) 37–42 cm is not as dark and is finer gained than the layer in Site U1436, with laminations at the top and bottom; (b) 58–68 cm is lighter and has faint crude lamination; and (c) 120–136 cm looks dark but it is wet and soupy in the image.
- Interval 126-792A-6H-4, 57–85 cm, is a black massive well-sorted coarse ash with mud above and below, suggesting that it is not disturbed. This was described as vitric sand in the Site 792A chapter and interpreted as originating from the Aogashima Islands (Fujioka et al., 1992).
- Core 126-792A-6H has a thick black ash at the bottom of the core and in the core catcher (intervals 6H-5, 0–135 cm, and 6H-CC, 1–15 cm) with scoria at the base; however, it may be partly or wholly basal flow-in. This interval has distinctly similar physical properties to the two black mafic ash layers at Site U1436.
- Interval 126-792A-7H-1, 43–50 cm, is another massive black coarse ash with mud above and below.
All of these layers are approximately the same age as the black glassy mafic ash layer at Site U1436, within the resolution of the age models.
In summary, Site U1436 records hemipelagic sedimentation with mafic and evolved volcanic events in the Izu-Bonin fore-arc regime. Approximately 80 mafic and 70 evolved volcaniclastic layers were recovered, including an extraordinary black glassy mafic ash layer that records explosive submarine eruptions from the Izu arc front.
Geochemistry
Samples for hydrocarbon gas analysis from headspace and for interstitial water (IW) analysis were collected between 0 and 104 mbsf. One sample per core was collected when possible; however, due to sometimes very low recovery, only 13 out of 21 cores were sampled for analysis of headspace hydrocarbon gas analysis and only 10 for interstitial water extracted by squeezing whole-round core sections.
Concentrations of major elements and several trace elements were measured for 14 volcaniclastic samples and 1 impure tuffaceous mud sample by inductively coupled plasma–atomic emission spectroscopy (ICP-AES) (see Geochemistry in the Expedition 350 methods chapter [Tamura et al., 2015a] for additional information on analytical techniques, instrumentation, and data quality). Furthermore, a portable X-ray fluorescence (pXRF) device was utilized to quickly obtain chemical information on powdered samples of volcaniclastics and tuffaceous mud (n = 8). ICP-AES and pXRF results agree well for the elements CaO and K2O, which are critical for distinction between arc-front and rear-arc magmatic compositions.
Hydrocarbon gases
No hydrocarbon gases other than methane were detected in sediment headspace samples. The highest concentration of methane (14.7 parts per million by volume [ppmv]) was detected in Core 350-U1436A-1H (1.5 mbsf). Methane was either present in very low concentrations or below the detection limit throughout all deeper cores (Figure F23).
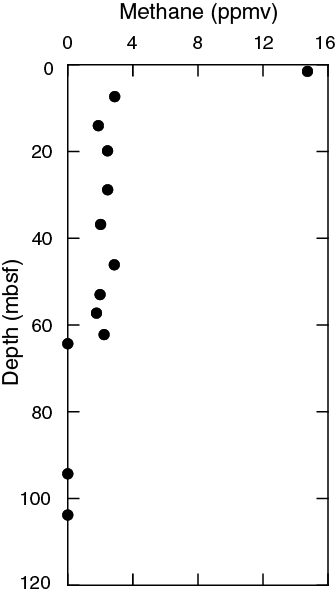
Figure F23. Headspace methane concentrations, Hole U1436A.
Pore fluid analysis
Salinity, chloride, and bromide
IW salinity is at a constant level of 36, equivalent to modern seawater, throughout the entire depth profile (Figure F24). Chloride concentrations obtained by titration range from 549 to 573 mM, close to modern seawater (559 mM). Chloride measured using ion chromatography (IC) varies over essentially the same range, as do published values from Hole 792A for the same depth interval (Egeberg, 1992). IW samples from shallow Cores 350-U1436A-1H through 3H (1.5–14 mbsf) yielded on average slightly lower chloride concentrations than those from deeper cores, but sampling density is insufficient to firmly establish systematic relations between chloride and depth. Moreover, chloride measured by titration and IC can differ by up to ~2% for individual samples. Given that the variability between methods is on the same order as the deviations from seawater, no clear trends can be established for deeper samples. Bromide concentrations range from 0.848 to 0.889 mM throughout the cored section. Pore water bromide and chloride are highly correlated (r2 = 0.97), excluding one exceptionally low bromide analysis in IW from Core 8H (54 mbsf), which corresponds to a discontinuity in physical properties shear strength, natural gamma radiation (NGR), thermal conductivity, and color at ~50–60 mbsf, and an increase in the abundance of mafic volcaniclastics (see Physical properties and Lithostratigraphy).

Figure F24. Salinity, chloride, and bromide, Hole U1436A.
Alkalinity, pH, ammonium, sulfate, and phosphate
IW alkalinity (Figure F25) is mildly elevated compared to modern seawater (2.33 mM). It ranges from 2.97 mM in the uppermost part of the cored sequence to 4.08 mM in Cores 350-U1436A-3H through 8H (14–54 mbsf). In the deepest cores, 16X and 17X (94–104 mbsf), alkalinity drops to 2.70 mM. IW pH averages 7.8 with a standard deviation of 0.2 pH units. A maximum pH of 8.3 is reached at 20 mbsf (Core 4H) and a minimum pH of 7.7 at 37 mbsf (Core 6H).
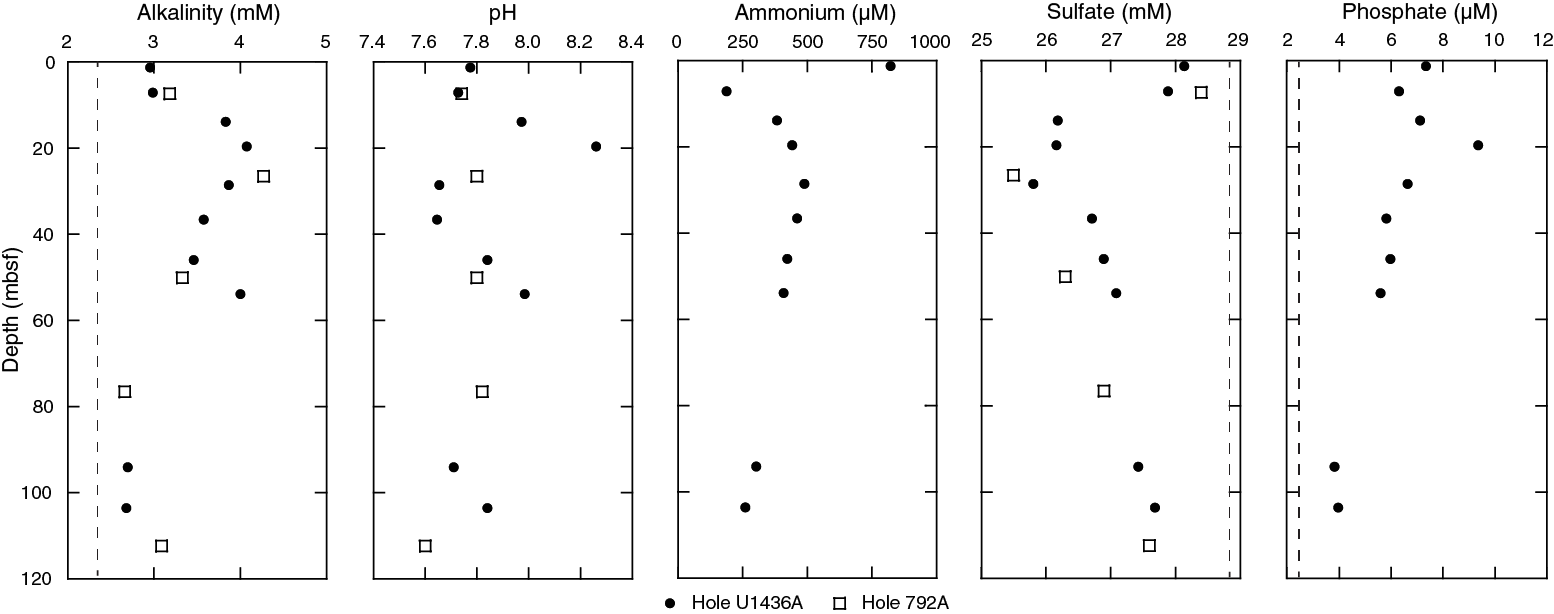
Figure F25. Alkalinity, pH, ammonium, sulfate, and phosphate, Hole U1436A.
Ammonium (Figure F25) is most enriched in the uppermost Core 350-U1436A-1H (1.5 mbsf) with a concentration of 820 µM, whereas deeper IW samples are generally more depleted (~290 µM in Core 17X at 104 mbsf). Ammonium is highly correlated with sulfate (r2 = 0.74), with the exception of the uppermost Core 1H (1.5 mbsf), where ammonium is elevated. Sulfate is slightly depleted relative to modern seawater (28.9 mM), with concentrations of ~28 mM in IW samples from the two uppermost samples from Cores 1H (1.5 mbsf) and 2H (7.3 mbsf). Sulfate decreases with depth to a minimum value of 25.8 mM in Core 5H (29 mbsf) and reverts to near-surface values in Cores 16X and 17X (94–104 mbsf). Sulfate is inversely correlated with IW phosphate concentrations (3.84–9.38 µM), which tend to decrease with depth. Although depth variations in alkalinity, pH, sulfate, ammonium, and phosphate are subtle, they agree with observations made in ODP Holes 792A–792E (Egeberg, 1992). IW samples where small but significant deviations from seawater occur (mostly between 14 and 37 mbsf) might be affected by minor microbially mediated reduction that would lead to sulfate depletion with concomitant increases in alkalinity and redox-sensitive elements in the pore water such as Mn and Fe (e.g., Expedition 344 Scientists, 2013).
Major (Na, Ca, and Mg) and minor (B, Ba, Fe, Li, Mn, Si, and Sr) cations
Major elements in IW samples are reported from IC analysis, whereas minor cations were analyzed by ICP-AES (Figure F26). Dissolved Na contents range from 476 to 492 mM, with a minor increase in Na concentrations with depth. Dissolved Ca mirrors the alkalinity trend (r2 = 0.76), suggesting carbonate precipitation in response to release of HCO3− as a product of biologically mediated oxidation of organic matter (see above). Near-surface IW samples have Ca abundances close to seawater compositions (10.6 mM) and reach a minimum downhole in Cores 350-U1436A-3H through 5H (14–27 mbsf). IW samples from deeper Cores 16X and 17X (94–104 mbsf) display a moderate Ca increase above seawater values to 13.6 mM. Dissolved Mg is variable throughout the cored sequence, with values between 52.1 and 55.1 mM, and scatters around the value for seawater Mg (54 mM), equivalent to concentrations measured in shallow IW samples from Hole 792A (Egeberg, 1992).

Figure F26. Geochemical depth profiles, Hole U1436A.
Boron is highest in the sample from the uppermost Core 350-U1436A-1H (1.5 mbsf) and gradually decreases with depth to seawater values in Core 8H and deeper. Similarly, Ba is elevated (~2 µM) in Core 1H (1.5 mbsf) compared to deeper cores, where Ba abundances decrease to an average of ~1 µM. IW Fe is generally near the detection limit with only one sample from Core 5H (28 mbsf) showing a moderately elevated value (5.39 µM), which corresponds to a minimum in sulfate pore water abundance. These values, however, are much lower than those reported for Hole 792A (Egeberg, 1992), possibly because of differences in the analytical techniques employed.
IW Li and Sr tend to increase over the uppermost 20 m of core and then remain largely invariant with depth. Trace Mn and Si show little variation with depth except for a minor shift to elevated abundances in the deepest IW sample from Core 350-U1436A-17X (104 mbsf).
In comparison with Holes 792A–792E, drilling was too shallow in Hole U1436A to reach the zone of intense Mg depletion and concomitant Ca enrichment that was previously penetrated at depths between 505 and 797 mbsf (Egeberg, 1992). Low Mg and high Ca in deep pore waters from Site 792 were interpreted to result from intense alteration of volcanic glass (Egeberg, 1992), whereas IW in the shallow volcaniclastic sediments of Hole U1436A are identified as comparatively unmodified seawater. This agrees with the freshness of volcanic glass observed in thin sections and smear slides (see Lithostratigraphy for more details).
ICP-AES and pXRF analyses of major and trace elements
Sampling, data acquisition, and data treatment
Composite samples of lapilli and lapilli-ash with pumice (n = 11) were collected covering a depth range from 12 mbsf (Sample 350-U1436A-3H-3, 10–32 cm) to 63 mbsf (Sample 10F-2, 10–18 cm). Lapilli-ash and lapilli deposits are often mixtures between scoriaceous and pumiceous clasts, and those were separated by hand-picking based on color. Textural differences between clasts are gradational, and for simplicity we use the term pumice here. Three lithostratigraphically distinct sets of samples (350-U1436A-8H-1, 92–93 cm, 8H-2, 97–99 cm, and 8H-3, 55–56 cm) were scooped from the unconsolidated black glassy mafic ash lithofacies in Hole U1436A away from the contacts with host tuffaceous mud.
Because volcaniclastic rocks from Site U1436 cover a wide range of compositions from basaltic andesite to rhyolite, several mafic, intermediate, and silicic standards were analyzed in replicate as unknowns in order to estimate precision and accuracy for both major elements (Si, Ti, Al, Fe, Mn, Mg, Ca, Na, K, and P) and Sr by ICP-AES analyses (see Geochemistry in the Expedition 350 methods chapter [Tamura et al., 2015a] for detailed information on analytical procedures, instrumentation, and data quality). In addition to ICP-AES analysis, reconnaissance data for abundances of K, Ca, Ti, Mn, Zn, Sr, and Zr were acquired using pXRF. Comparison between pXRF and ICP-AES data shows excellent agreement for K2O and CaO, two key components that can indicate provenance (low K being characteristic for the Izu arc front and medium K for the rear arc) and differentiation (high Ca for mafic magma compositions and low Ca for evolved). The advantage of ICP-AES over pXRF analysis is that it includes light elements (Na, Al, and Si), whereas pXRF data are rapidly generated over timescales of minutes compared to days for ICP-AES. In some cases (e.g., Zr), pXRF data appear more reliable than ICP-AES data (not shown) based on assessments of accuracy from analysis of standards and comparison with literature data for the Izu-Bonin region (see the Expedition 350 methods chapter [Tamura et al., 2015a] for more details).
ICP-AES analyses of both standards and samples were accepted if the total volatile-free major element weight percentages were within 100 ± 5 wt%. Possible causes for uncertainties include some combination of weighing errors for samples (on ship) and/or flux powders (on shore), variability in volumetric dilutions, and measurement uncertainties (e.g., drift) of the ICP-AES instrument. To facilitate comparison with each other and with data from the literature, we normalized the measured major element values to 100 wt% total when plotted, with total Fe calculated as ferrous Fe oxide (denoted as FeO*).
Major oxides, trace elements, and loss on ignition
The three bulk samples of black glassy mafic ash are largely indistinguishable in major element compositions (Figure F27). Sample 350-U1436A-8H-3, 55–56 cm, has slightly higher Na2O, whereas Sample 8H-1, 92–93 cm, has lower Sr measured by ICP-AES compared to the other mafic ash samples (Figure F28). These differences are minor, and in the case of Sr, unsupported by pXRF analyses of the same samples where Sr and Zr abundances are similar (Figure F29). This possibly reflects contamination of the larger ICP-AES samples with foraminifers (see below), minor alteration, analytical uncertainty, or a combination thereof.
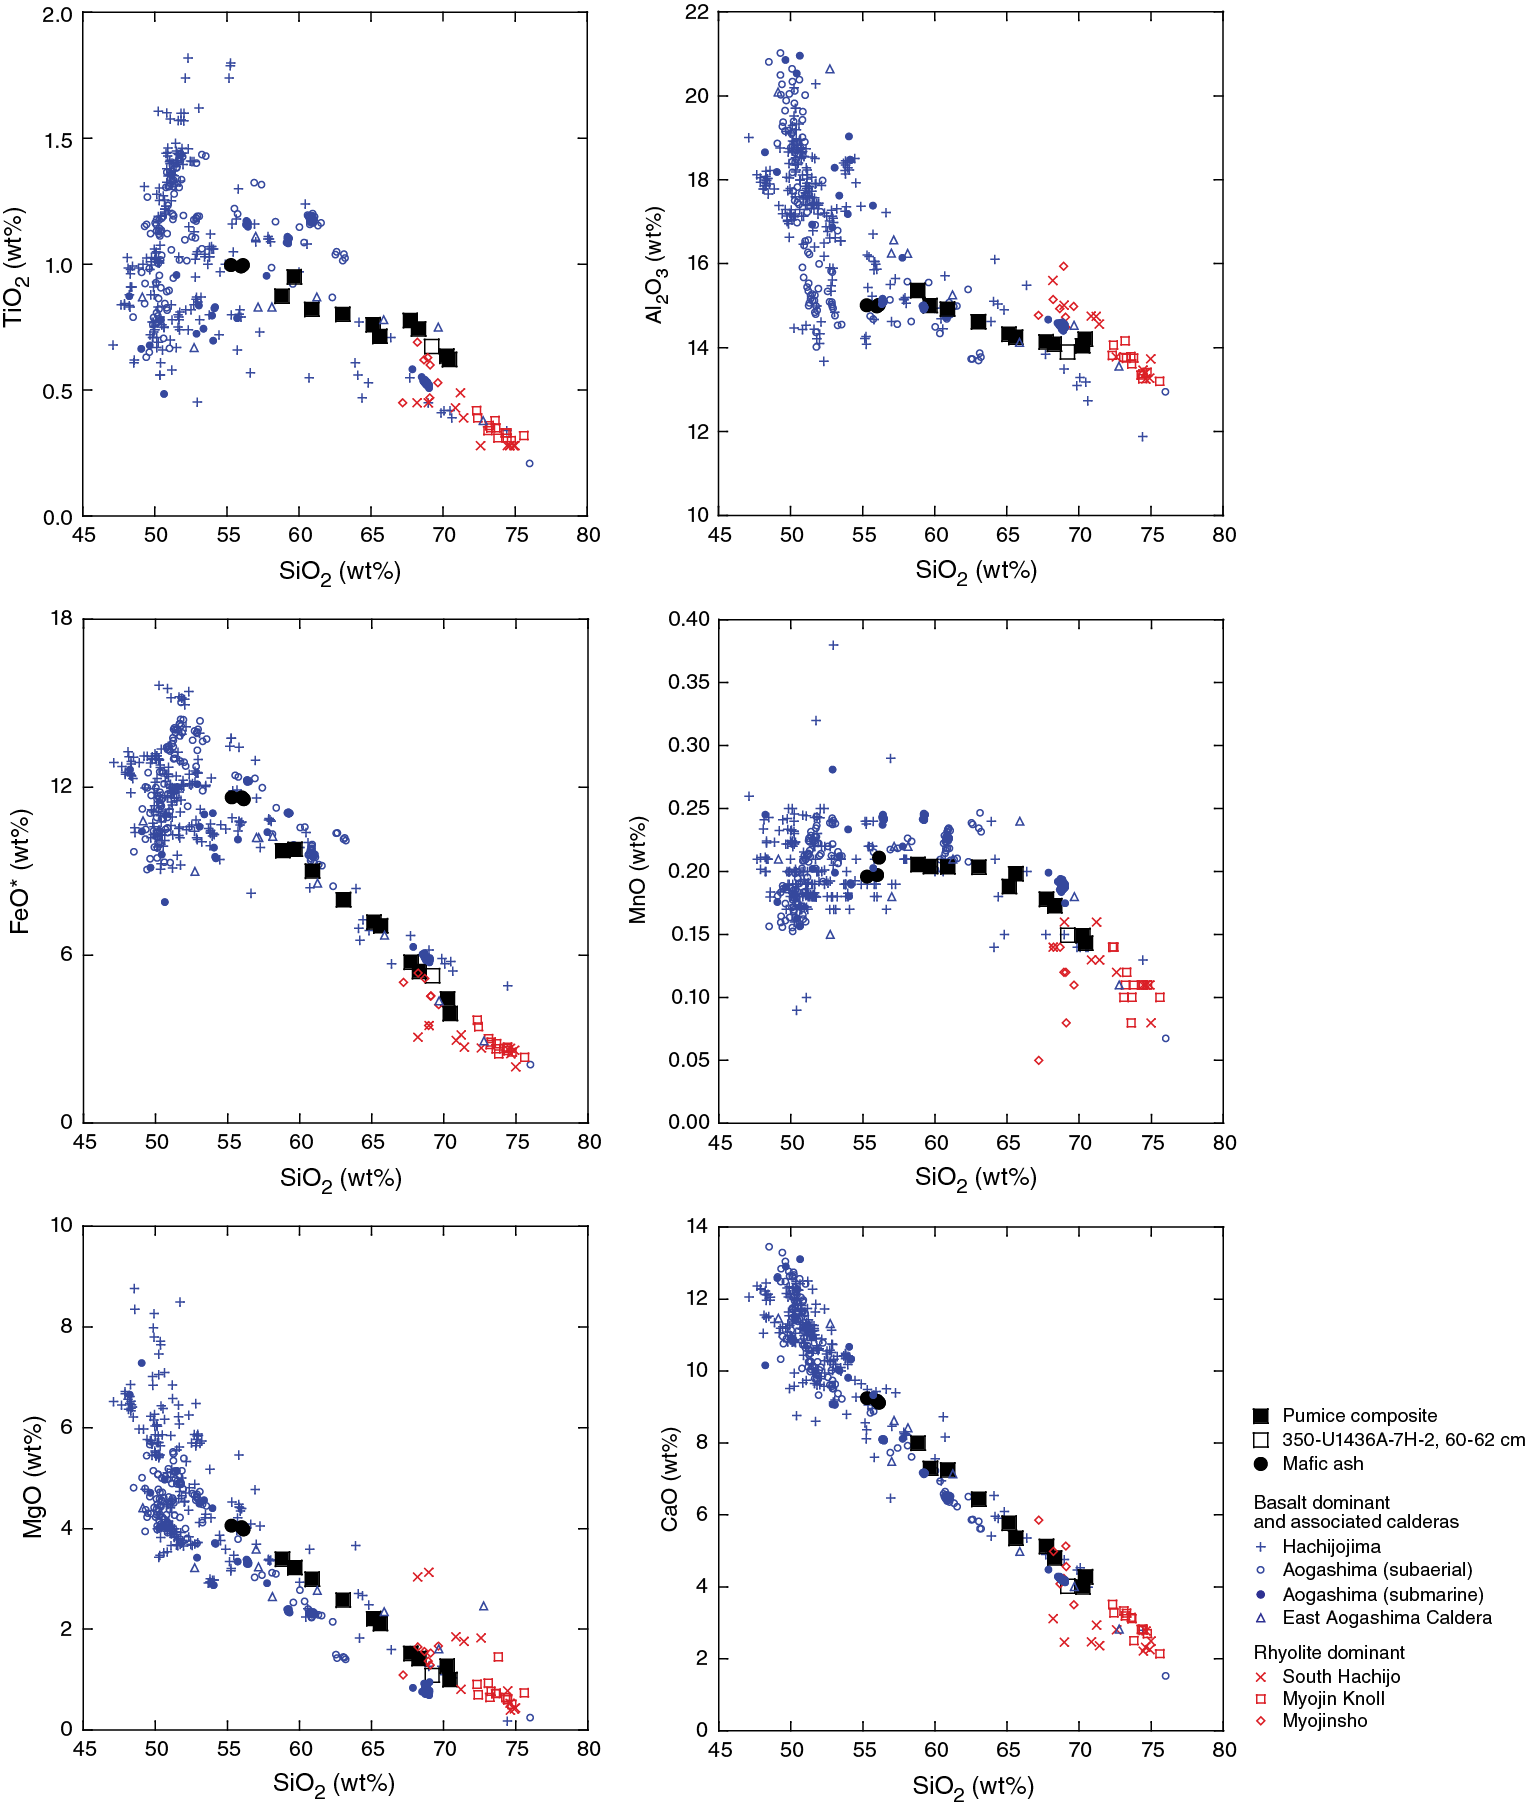

Figure F27. Major element compositions for ash and lapilli, Hole U1436A.
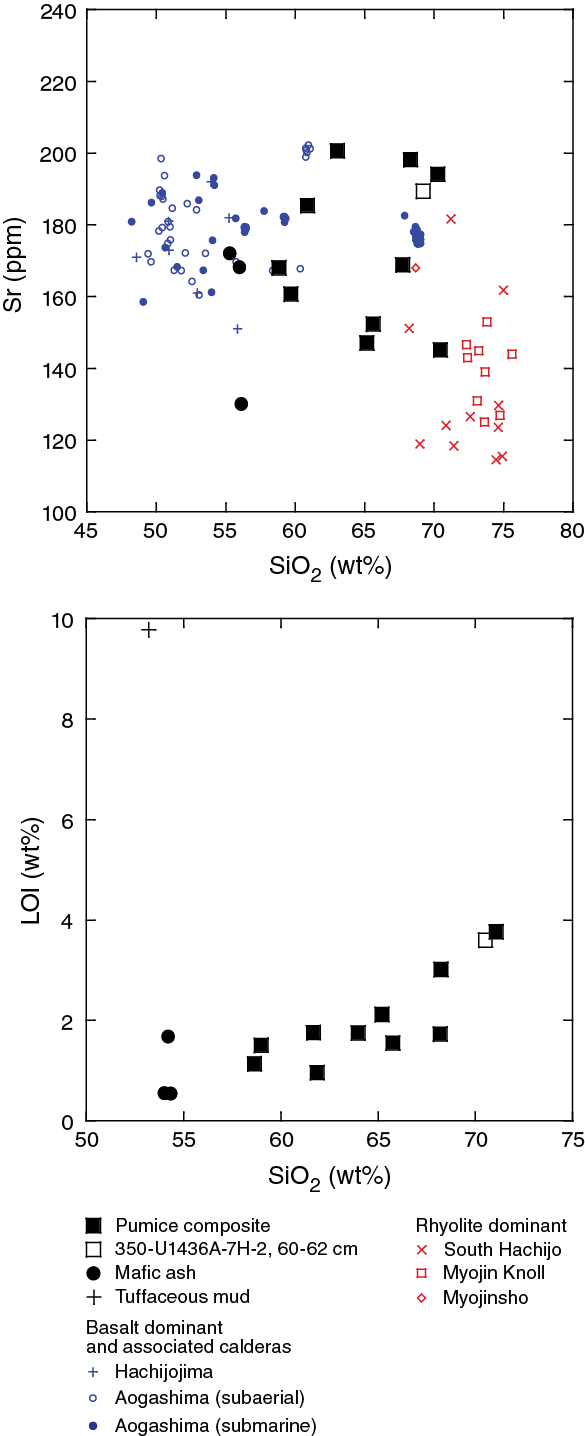
Figure F28. Trace element abundances for ash and lapilli, Hole U1436A.

Figure F29. Compositions for ash and lapilli, Hole U1436A.
The black glassy mafic ash forms a low-SiO2 end-member (SiO2 = 54.4 wt%) of tight linear trends in Harker diagrams together with more evolved pumice samples, which vary continuously between 58.8 and 70.4 wt% SiO2. Low MgO abundances (<4.05 wt%) attest to the overall evolved composition of even the most mafic samples. All samples ranging from 11 to 63 mbsf are categorized as low K (Figure F27), with only one pumice composite (Sample 350-U1436A-7H-2, 20–75 cm [45 mbsf]) plotting above the main K2O vs. SiO2 trend defined by the other samples. Sr (Figure F28) lacks a correlation with SiO2 and mostly varies between ~130 and 200 ppm, in agreement with the range of Sr in Izu-Bonin arc-front volcanic rocks (e.g., Tamura et al., 2005; Shukuno et al., 2006). Sample 4H-6, 60–62 cm, was visually identified as tuffaceous mud and was analyzed for comparison. It has much higher Sr (416 ppm) and CaO (14.3 wt%) abundances compared to the remainder of the volcaniclastic samples. Because of its distinct composition, it is omitted from major and trace element plots except for loss on ignition (LOI) (Figure F28). Zirconium abundances from pXRF vary between ~50 and 150 ppm and are higher in evolved low-CaO pumice compared to mafic ash (Figure F29).
LOI values for all volcaniclastic samples analyzed range from 0.54 to 3.8 wt% and generally show positive and negative correlations with SiO2 (Figure F28) and CaO abundances (not plotted), respectively. The tuffaceous mud (Sample 350-U1436A-4H-6, 60–62 cm [24.9 mbsf]) yielded a very high LOI value (9.8 wt%). This sample also has elevated CaO, suggesting that abundant carbonate is present in this tuffaceous mud interval. LOI values vary strongly for compositionally similar samples collected from nearby depth intervals. This is illustrated by the three samples of black glassy mafic ash that have LOI values between 0.53 and 1.67 wt%, suggesting a range of magmatic volatile contents or that they have been variably affected by secondary hydration. Minor carbonate contamination (e.g., from trace foraminifers) could also contribute to LOI variations of the bulk ash samples, although foraminifers occur only in trace amounts.
Discussion
Pumice composite and bulk ash samples recovered at Site U1436 are compositionally similar to volcanic rocks from nearby volcanic centers along the Izu arc front (Figures F27, F28, F29). The underlying assumptions of comparing these samples with known volcanoes are that (1) individual volcanoes erupted magma compositions that closely followed well-defined differentiation trends, (2) abundances in some minor and trace elements (e.g., K2O, Sr, and Zr) are characteristic for a particular volcano when compared at the same degree of differentiation, and (3) these characteristics remained invariant over time. Although geochronologic constraints for samples in our database (references in Tamura et al., 2013) are limited, it is reasonable to assume that they cover Quaternary eruptions that are equivalent in age to those recorded at Site U1436.
Most samples from Site U1436 overlap with the compositional field exhibited by rocks from Aogashima Island and the submarine East Aogashima Caldera ~56 and ~45 km west of Site U1436, respectively. They are generally more evolved than rocks from Aogashima Island, a basalt-dominant island volcano that erupted abundant basaltic lava and scoria with SiO2 between 49 and 53 wt% (Takada et al., 1992), but the pumice compositions from Site U1436 closely resemble the samples from the East Aogashima Caldera, many of which are evolved (SiO2 = 66–73 wt%) (Figures F27, F28, F29). It is also possible that our sampling is biased because deposits of lapilli-ash often comprise dark- and light-colored pumice, and although we attempted to purify the dominant pumice type by hand-picking, some uncertainty remains whether ICP-AES data for pumice composites represent magmatic compositions or some degree of mixture between mafic and evolved end-members. Reconnaissance pXRF analysis of individual pumice or composite pumice comprising only a few hand-selected lapilli is direct evidence for strong compositional differences between dark- and light-colored clast populations present in individual intervals, although never as mafic as the basalts from Aogashima. The three bulk samples of black glassy mafic ash, by contrast, are very homogeneous and might be approximate to actual melt compositions of evolved mafic lava from Aogashima Island.
The alternative hypothesis, that the black glassy mafic ash intervals represent proximal eruptive products of vents located in the fore arc, appears less likely. Although evidence for magmatism in the Izu fore arc exists in the form of a 6 m thick mafic sill (Taylor et al., 1995) that was penetrated at ODP Site 793 ~150 km to the south-southeast, bathymetric features recognized as fore-arc volcanoes are absent in the vicinity of Site U1436. Moreover, the sill at Site 793 has on average lower Sr (average = 116 ppm) and higher MgO (9 wt%) compared to Site U1436 mafic ash with similar SiO2 (Taylor et al., 1995) and thus is a poor compositional match in major and trace elements. Based on proximity and overlapping major and trace element abundances, we tentatively assign the dominant population of all low-K mafic ash and pumice sampled at Site U1436 to the Aogashima Volcano.
A single sample of evolved pumice composite (interval 350-U1436A-7H-2, 20–75 cm [45 mbsf]) has elevated K2O, which differs from the Aogashima trend. Instead, K2O in this pumice more closely resembles rhyolites erupted at Myojin Knoll and Myojinsho Volcano, two rhyolite-dominant submarine volcanoes ~57 and ~68 km from Site U1436, respectively. Sr and Zr abundances for this sample are also similar to Myojin Knoll when considering the pXRF Sr result instead of the comparatively high ICP-AES Sr value, which potentially is affected by minor carbonate contamination. Only one published trace element analysis is available for Myojinsho (Tamura et al., 2013), and although it matches poorly in Zr and Sr, it would be premature to dismiss Myojinsho given the compositional variability of individual volcanoes. South Hachijo Caldera (~70 km from Site U1436) also produced rhyolites with moderately elevated K2O, but Zr abundances are generally higher than in interval 7H-2, 20–75 cm (45 mbsf). Hachijojima, a basalt-dominant complex of subaerial and submarine volcanoes located ~100 km to the northwest (Taylor and Nesbitt, 1998; Tamura et al., 2005, 2007) has also erupted rhyolites with matching K2O, as did Sumisu Caldera ~120 km to the south (Tamura et al., 2005). Because of their large distances to Site U1436, however, they appear less likely sources for the comparatively coarse-grained lapilli in interval 7H-2, 37–74 cm (44.6–45.4 mbsf). Derivation from Myojin Knoll, presumably via density currents associated with an explosive eruption (see Lithostratigraphy), is thus our preferred scenario based on proximity and overlapping major and trace element compositions. The Myojin Knoll-type pumice (interval 7H-2, 20–75 cm) is separated from Aogashima-type pumice (interval 7H-1, 1–26 cm) by only a thin (~0.5 m) intercalated tuffaceous mud layer, implying that both eruptions occurred at ~0.5 Ma within a brief time period spanning ~7000 y (see Age model).
To summarize, our limited data currently suggest multiple explosive eruptions of Aogashima-type magma, whereas only a single deposit could be assigned to the Myojin Knoll.
Physical properties
Physical properties measurements were performed on cores recovered from Holes U1436A (0–132 mbsf), U1436B (0–62 mbsf), U1436C (0–70 mbsf), and U1436D (40–52 mbsf) to obtain basic information on the density, porosity, shear strength, NGR, color reflectance, thermal conductivity, magnetic susceptibility, and P-wave velocity. After the cores reached ambient temperature (~20°C), gamma ray attenuation (GRA) bulk density, magnetic susceptibility logger (MSL), and P-wave logger (PWL) measurements were taken on the Whole-Round Multisensor Logger (WRMSL) every 5 cm. The whole-round sections were then measured with the Natural Gamma Radiation Logger, with a counting period of 10 min and a measurement spacing of 10 cm. Thermal conductivity was then measured on whole-round sections (Hole U1436A only, because of time constraints). Three experiments were conducted at every measurement location, with the exceptions of Sections 350-U1436A-4H-3 and 7H-3, where only two and one measurements were taken, respectively. Thermal conductivity tests were made at irregular intervals, depending on the availability of material homogeneous and continuous enough for measurement, resulting in a sampling frequency of 1 per core. High-resolution images were taken of the archive halves with the Section Half Imaging Logger. Color reflectance and magnetic susceptibility measurements were taken from the archive halves using the point magnetic susceptibility (MSP) sensor on the Section Half Multisensor Logger (SHMSL). Discrete measurements of P-wave velocity, bulk density, porosity, and shear strength were obtained on the working halves. P-wave velocity was measured with the P-wave caliper (PWC) and P-wave bayonet (PWB) pulser-receiver systems of the Section Half Measurement Gantry (SHMG). Shear strength was determined only on tuffaceous mud and fine-grained ash layers from Hole U1436A using the Giesa automated vane shear on the SHMG. Bulk density and porosity measurements were performed for tuffaceous mud and fine-grained ash layers from Hole U1436A using the Method C technique for moisture and density (MAD) measurement on 53 10 cm3 samples removed from the working halves with a plastic syringe.
Basic statistics obtained for the different physical properties are given in Table T2.
Table T2. Statistics for physical properties measurements, Holes U1436A–U1436D. Download table in .csv format.
Physical properties profiles
Density and porosity
The GRA bulk density profiles obtained for Holes U1436A, U1436B, U1436C, and U1436D are similar (Figure F30). MAD bulk density and GRA bulk density values agree well in Hole U1436A, with GRA measurements showing greater scatter (Figure F31) than discrete values. The scatter of the GRA values is likely caused by measuring voids, cracks, and core slurry, all of which produce values that are not representative of core material. Therefore, we only report the GRA bulk density maximum value of 2.13 g/cm3 for Hole U1436A in Table T2. MAD bulk density measured on discrete samples from Hole U1436A produced a more restricted range of values (1.45–1.90 g/cm3; mean = 1.72 g/cm3). MAD measurements indicate a downhole increase in bulk density. Porosity measurements in Hole U1436A range from 49 to 70 vol% and average 59 vol% (Figure F31). Porosity decreases downhole.
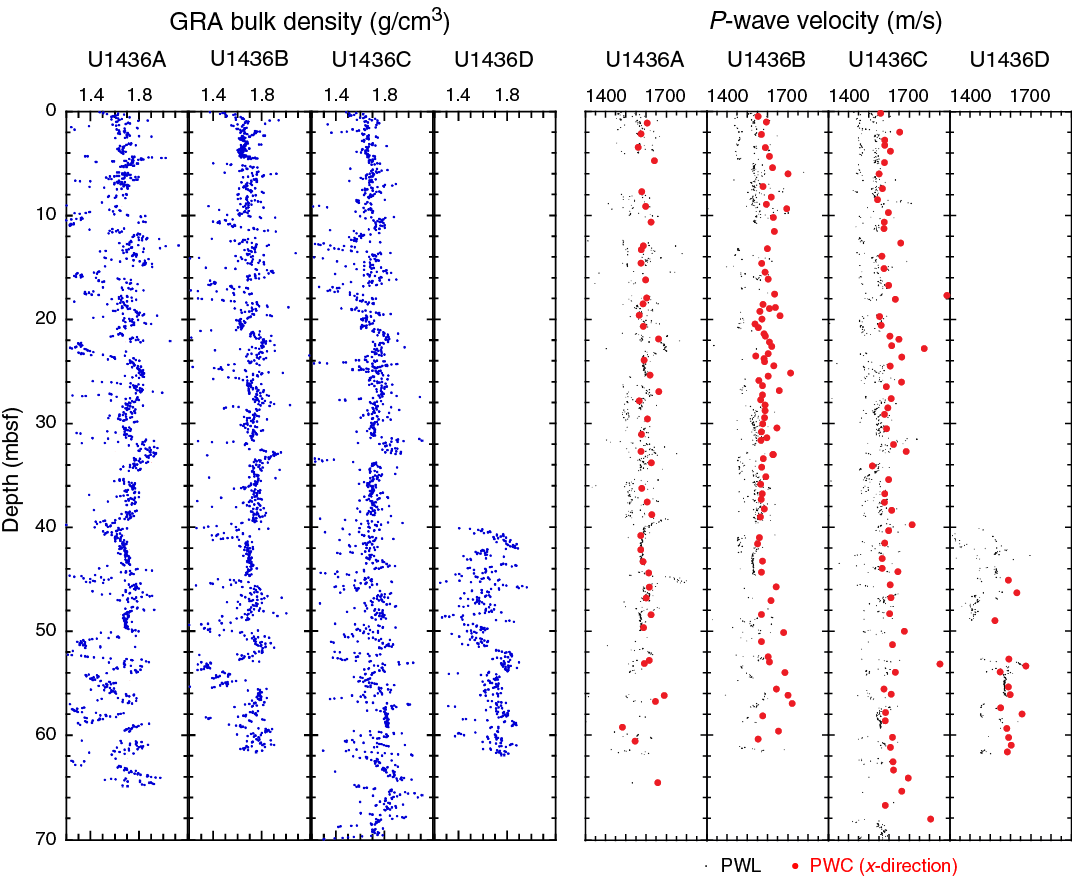
Figure F30. GRA bulk density and P-wave velocity profiles, Holes U1436A–U1436D.
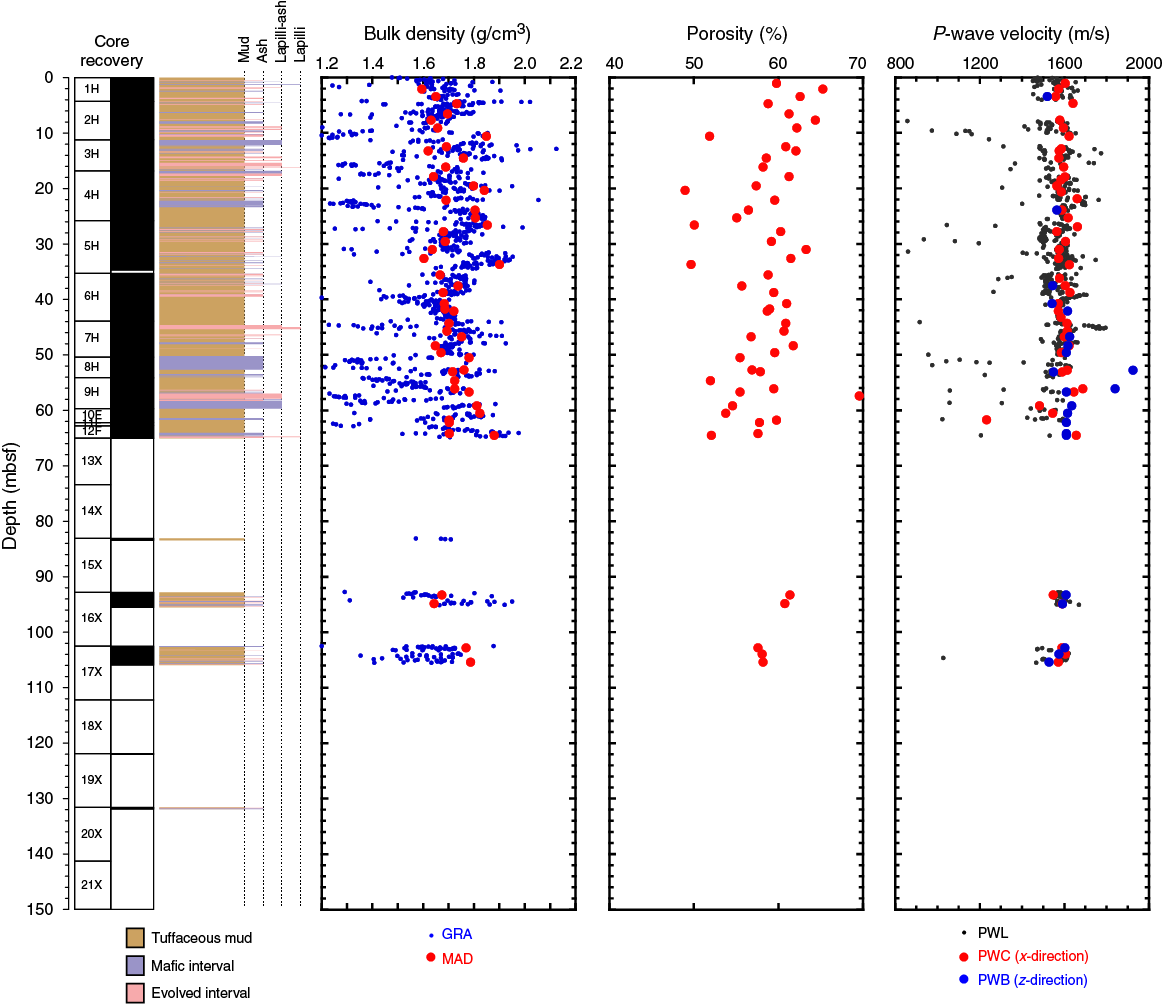
Figure F31. Bulk density, porosity, and P-wave velocity, Hole U1436A.
P-wave velocity
P-wave velocity profiles obtained with the PWL, PWC, and PWB are similar in Holes U1436A, U1436B, U1436C, and U1436D (Figure F30). P-wave velocities measured with the PWL are slower and more scattered than those obtained with the PWC and PWB (Figure F31). PWL data vary from ~812 to ~1796 m/s (Table T2) with many gaps (values near zero) over the entire interval due to incompletely filled core liners. Values less than the velocity of seawater (1480 m/s) are attributed to slurry or voids in the core liners. In contrast, the PWC and PWB data from the section half are better quality, as the transducers are in direct contact with the sample surface. The range of readings is 1233~1897 m/s for the x-direction caliper (PWC-X) and 1519~1926 m/s for the z-direction bayonet (PWB-Z). The mean values in Hole U1436A for the x- and z-axes are 1589 and 1617 m/s, respectively. The highest values fall in the interval of 50~60 mbsf.
Shear strength
The shear strength profile of Hole U1436A can be divided into two intervals according to downhole variations in the value distribution, range, and mean (Figure F32). The upper interval (0 to ~50 mbsf) has higher values with a range of 13 to ~51 kPa and a mean of 26.4 kPa (Table T2 shows values for 0–105.4 mbsf). The lower interval (50 to ~105.4 mbsf) has a range from 12 to ~28 kPa and a mean of 19.4 kPa.
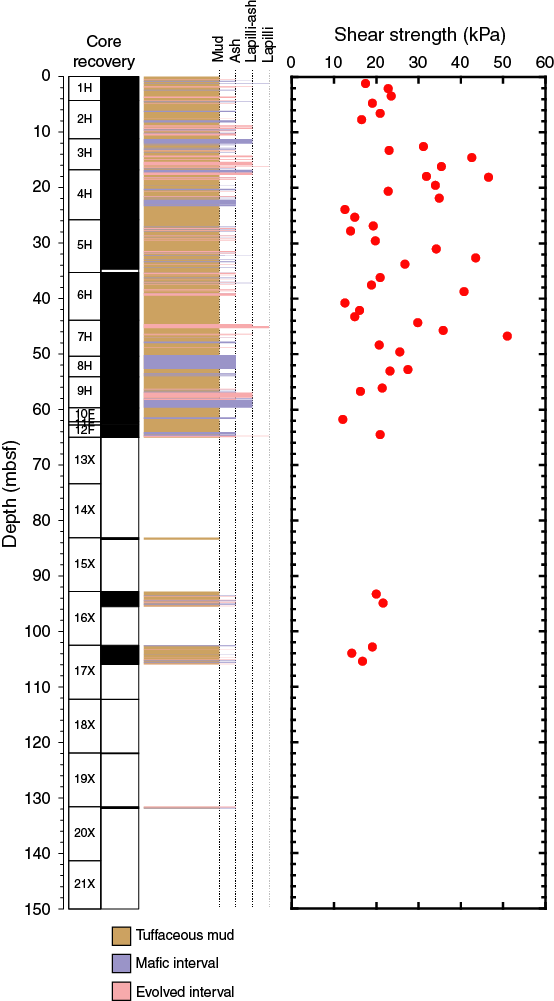
Figure F32. Shear strength, Hole U1436A.
Magnetic susceptibility
In Holes U1436A, U1436B, and U1436C, magnetic susceptibility (MS) measurements with the MSL and MSP produced similar results for the uppermost 40 m (Figure F33). Deeper, the MS profiles display differences between the four holes related to coring disturbance. The MS profiles show the largest fluctuations at the meter and submeter scale among all physical properties. Values show a large range of measurements downhole (7–2870 IU with the MSL; 5–3955 IU with the MSP) (Table T2; Figures F33, F34).

Figure F33. Magnetic susceptibility and NGR profiles, Holes U1436A–U1436D.
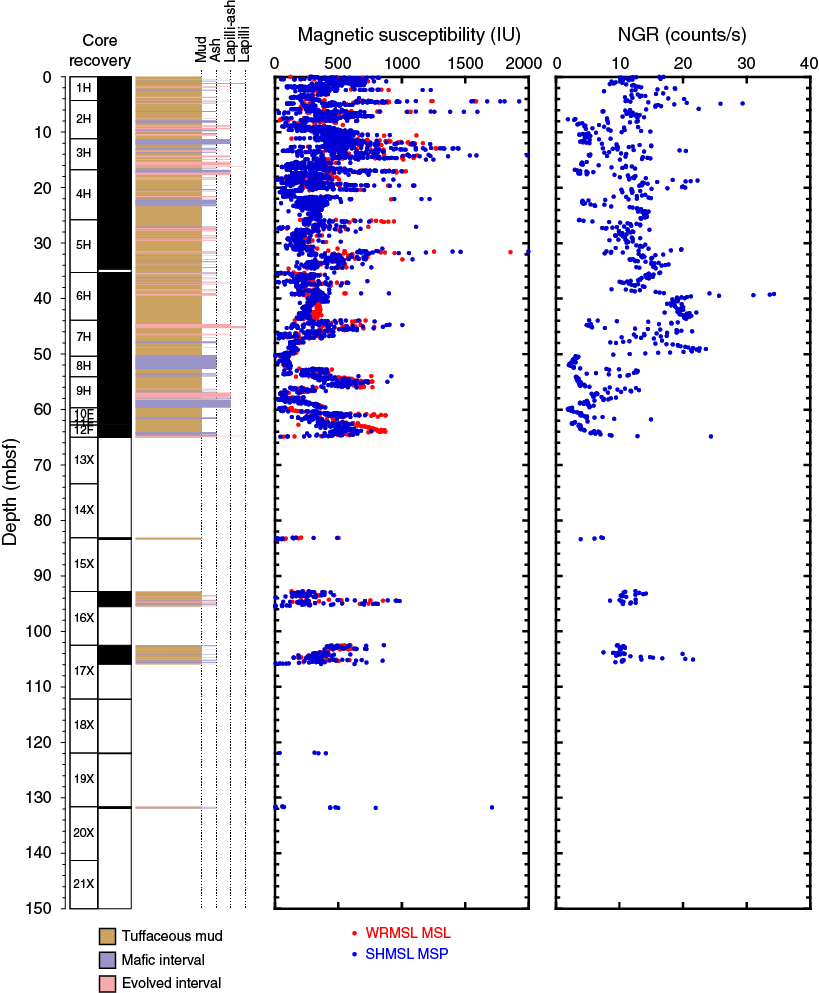
Figure F34. Magnetic susceptibility and NGR, Hole U1436A.
Natural gamma radiation
NGR values measured on cores from Holes U1436A–U1436D vary from 1.9 to 46.4 counts/s (Table T2; Figures F33, F34). As with MS, the NGR profiles for Holes U1436A, U1436B, and U1436C are similar shallower than 40 mbsf. Deeper, NGR profiles display differences related to coring disturbance.
Thermal conductivity
In Hole U1436A, thermal conductivity mean values (n = 3) calculated for every measurement position range between 0.86 and 1.04 W/(m·K), with a mean of 0.96 W/(m·K), and have a standard deviation of 0.05 W/(m·K) (Table T2). Standard deviations for the three experiments at each measurement position vary from 0 to 0.06 W/(m·K). Mean values vary from 0.92 to 1.04 W/(m·K) in the upper ~50 mbsf (Figure F35). Deeper than ~50 mbsf, thermal conductivity mean values decrease sharply to 0.86 W/(m·K) at ~65 mbsf, then increase to 1.00 W/(m·K) at ~104 mbsf.
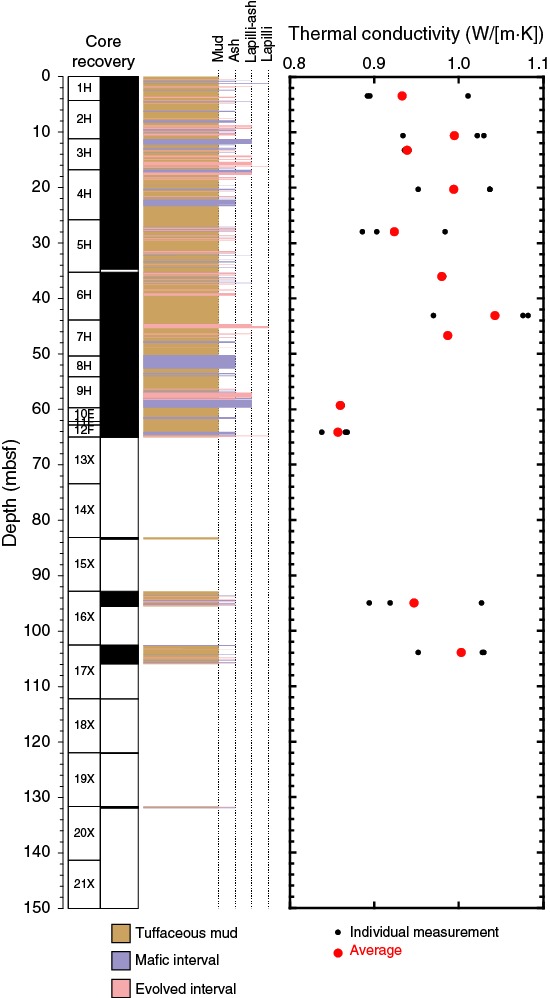
Figure F35. Thermal conductivity, Hole U1436A.
Reflectance spectrophotometry
Results from color reflectance measurements are presented in Figures F36 and F37. Reflectance L* and b* values fluctuate downhole in Holes U1436A–U1436D producing similar profiles for the uppermost ~40 mbsf. Reflectance a* values show very little variation downhole.
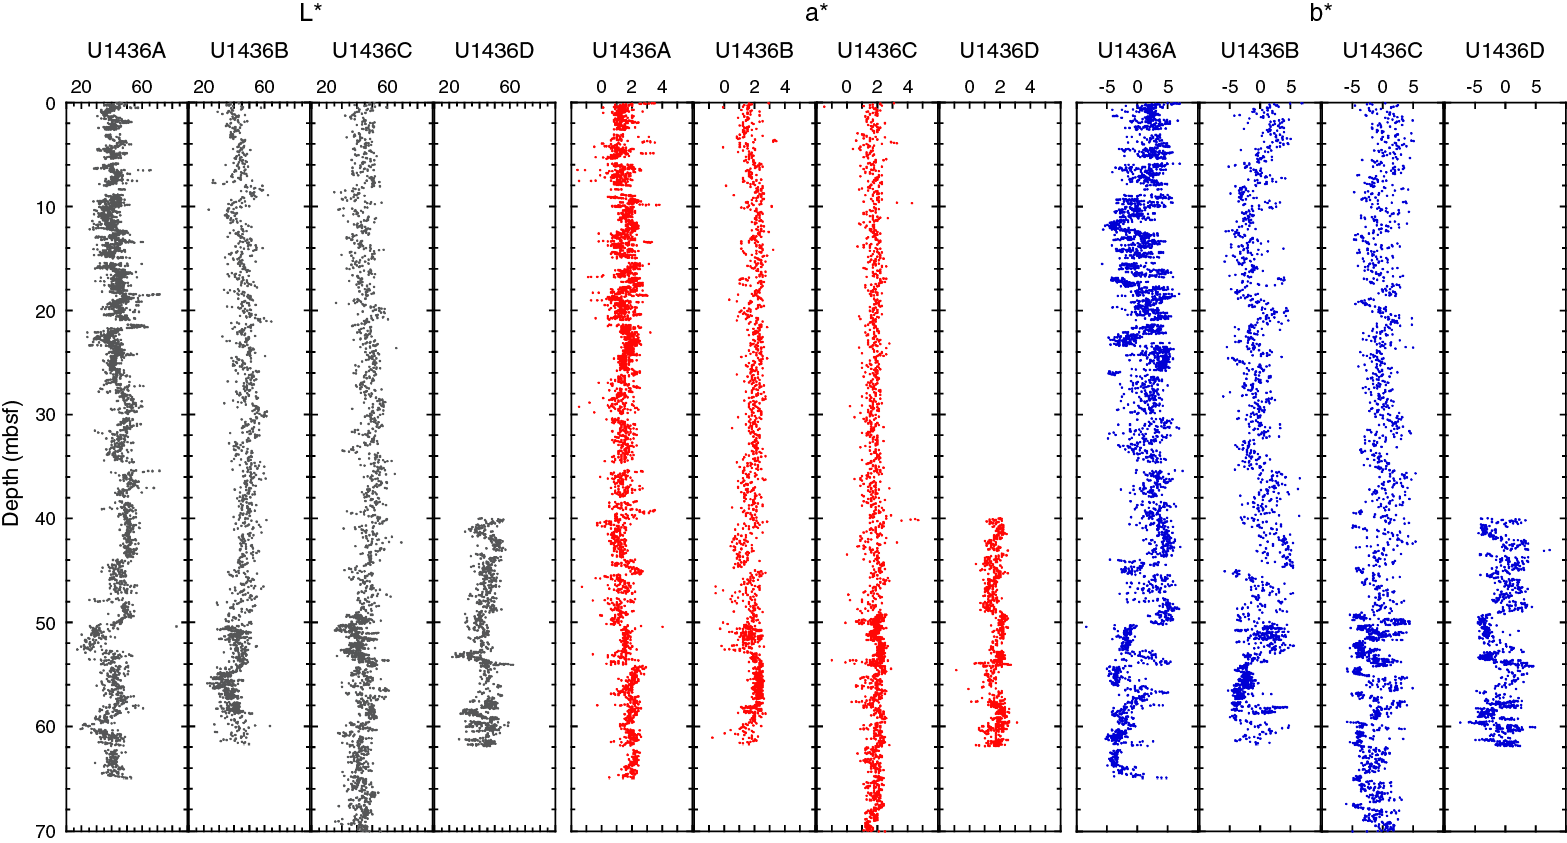
Figure F36. Color reflectance, Holes U1436A–U1436D.
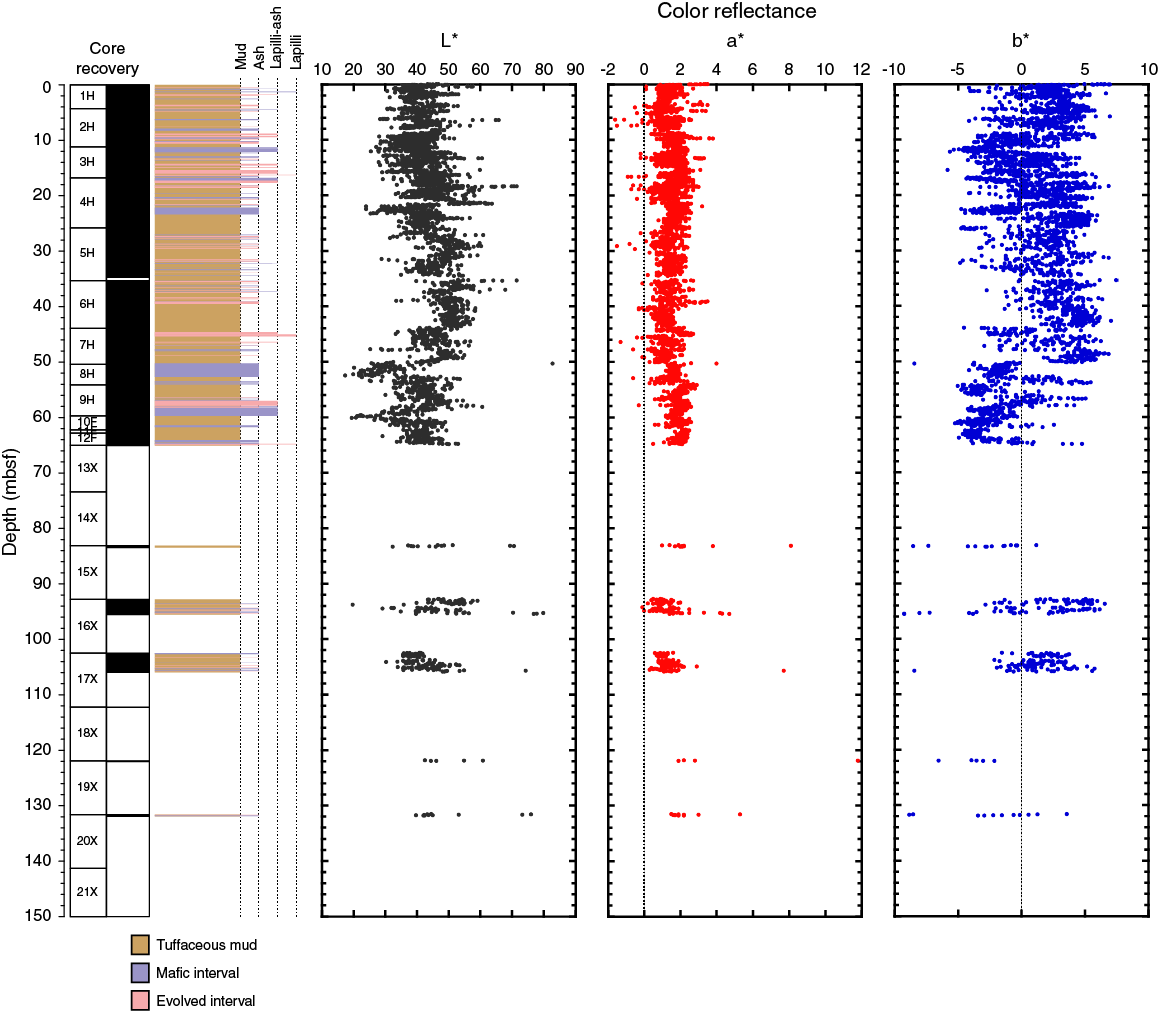
Figure F37. Color reflectance, Hole U1436A.
Physical properties integration and preliminary interpretations
Downhole physical properties interpretations
Physical properties measurements on cores from Holes U1436A–U1436C yielded similar downhole profiles for the uppermost 40 mbsf, indicating that the recovered stratigraphic successions were comparable. Deeper, differences in the MS, NGR, and color (L* and b*) values may be related to coring disturbance affecting significant parts of the recovered stratigraphy.
Lithologic integration with physical properties data, Hole U1436A
Assigning a lithology to all physical properties data points in Hole U1436A allowed investigation of the relationship between physical properties and lithofacies, here, evolved and mafic volcaniclastic intervals. The lithologic descriptions from Site U1436 (see Lithostratigraphy) include several textural classes of mafic and evolved volcaniclastics. For this investigation, the textural classes were grouped together for simplicity.
“Evolved volcaniclastics” includes
- Evolved ash,
- Matrix-supported monomictic evolved lapilli-ash,
- Matrix-supported monomictic evolved ash,
- Evolved lapilli-ash,
- Evolved lapilli,
- Evolved ash with glauconite, and
- Clast-supported monomictic evolved lapilli.
“Mafic volcaniclastics” includes
- Mafic ash,
- Matrix-supported monomictic mafic ash,
- Mafic lapilli-ash,
- Mafic ash with pumice,
- Mafic ash with foraminifers,
- Clast-supported monomictic mafic lapilli-ash, and
- Clast-supported monomictic mafic ash.
Physical properties that are based on discrete measurements (MAD, PWC, PWB, shear strength, and thermal conductivity) were not used in this correlation study, as there were too few data points from mafic or evolved ash layers because of sample bias toward tuffaceous mud.
Mafic and evolved volcaniclastics have MS, NGR, and density values that are largely overlapping but distinctive reflectance values (Table T3; Figures F38, F39). A large number of evolved volcaniclastics are, however, characterized by low MS values (<170 IU), high NGR values (>16.2 counts/s), and high L* values (>48.1). Evolved volcaniclastics also give a wider range of reflectance a* values (−1.5 to 4.7) than mafic volcaniclastics (0.3–3.2). Mafic volcaniclastic intervals are characterized by higher MS (commonly >200 IU), lower NGR values (<15.6 counts/s), high GRA bulk density (>1.8 g/cm3), and low reflectance L* (<29.2). Mafic volcaniclastics have a wider range of P-wave velocities (1408–1763 m/s) than evolved volcaniclastics (1489–1693 m/s).
Table T3. Physical properties value ranges, Hole U1436A. Download table in .csv format.
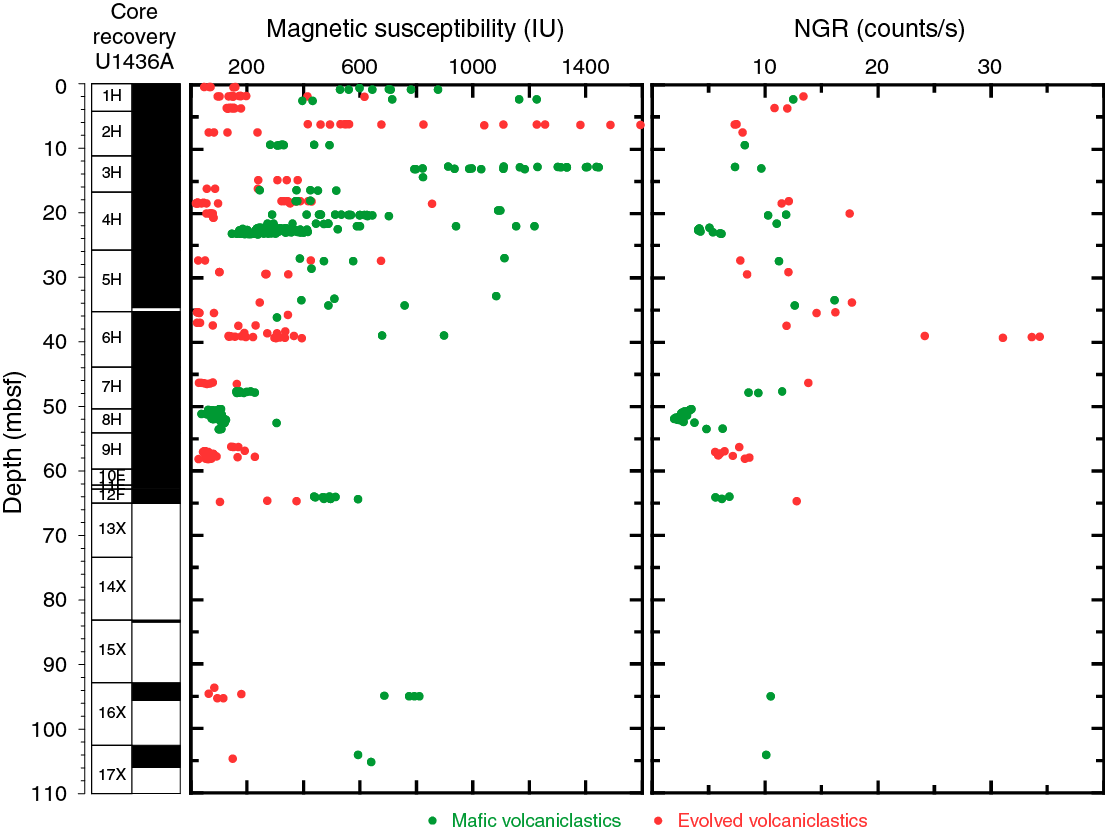
Figure F38. Magnetic susceptibility and NGR for volcaniclastic layers, Hole U1436A.
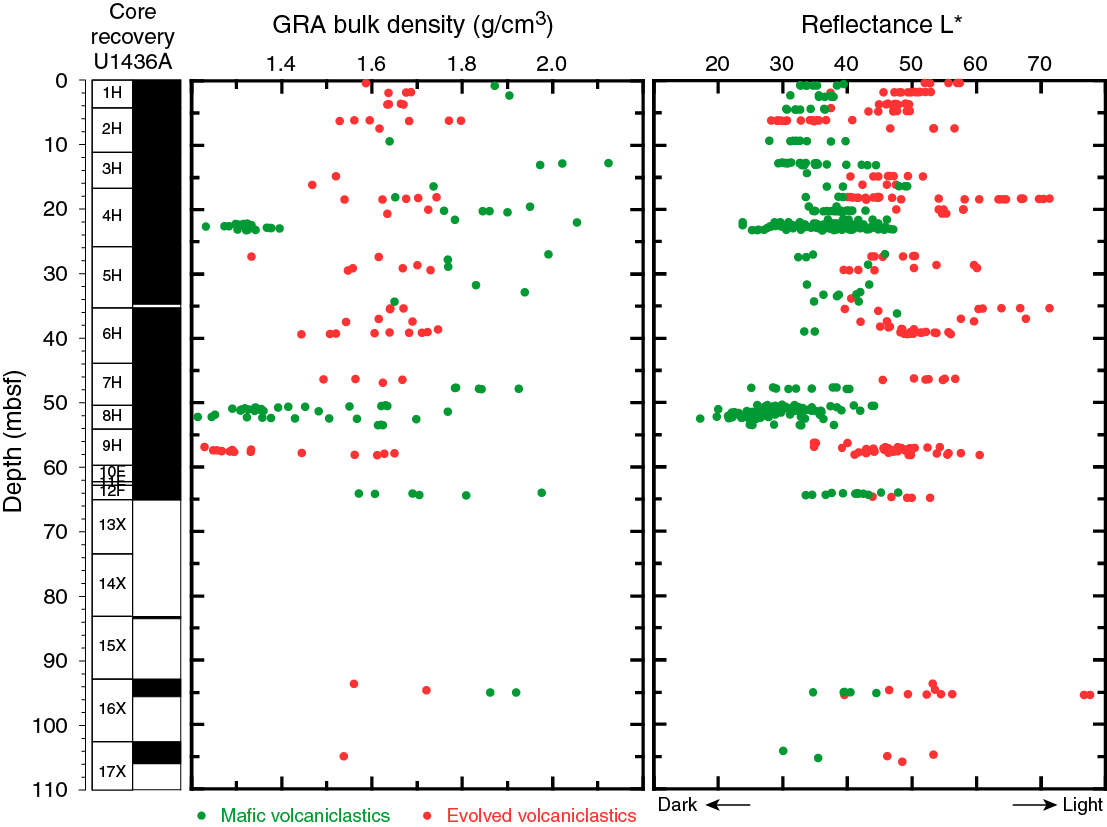
Figure F39. GRA bulk density and L* for volcaniclastic layers, Hole U1436A.
Dark glassy mafic ash layer at ~50–52 mbsf, Hole U1436A
The black glassy mafic ash layer at 50.4–52.66 mbsf in Hole U1436A (see Lithostratigraphy) shows distinctive changes in several physical properties when compared with the sediments above and below (Table T3; Figure F40). The black glassy mafic ash layer has low NGR values (~2 to ~3 counts/s), consistent with the shipboard chemical information that it is low-K basaltic andesite in composition. The NGR values show very little variation downhole through the layer. MS of this interval is low, varying from about 81 IU to about 123 IU, the lowest values of any mafic ash layer. This low MS likely reflects the glassy nature of the layers and the paucity of ferromagnetic minerals. The PWL values in the black glassy mafic ash layer are consistent (~1620 m/s) for the lower (~1 m) part of the layer, with more variability in the upper part (shallower than ~51.5 mbsf), possibly indicating variations in degree of core disturbance. Reflectance L* from these glassy mafic ash layers records the lowest values observed at Site U1436, reflecting the dark nature of the sediments. The GRA values are variable through the black glassy mafic ash layer, with a peak in bulk density at ~51.5 mbsf.
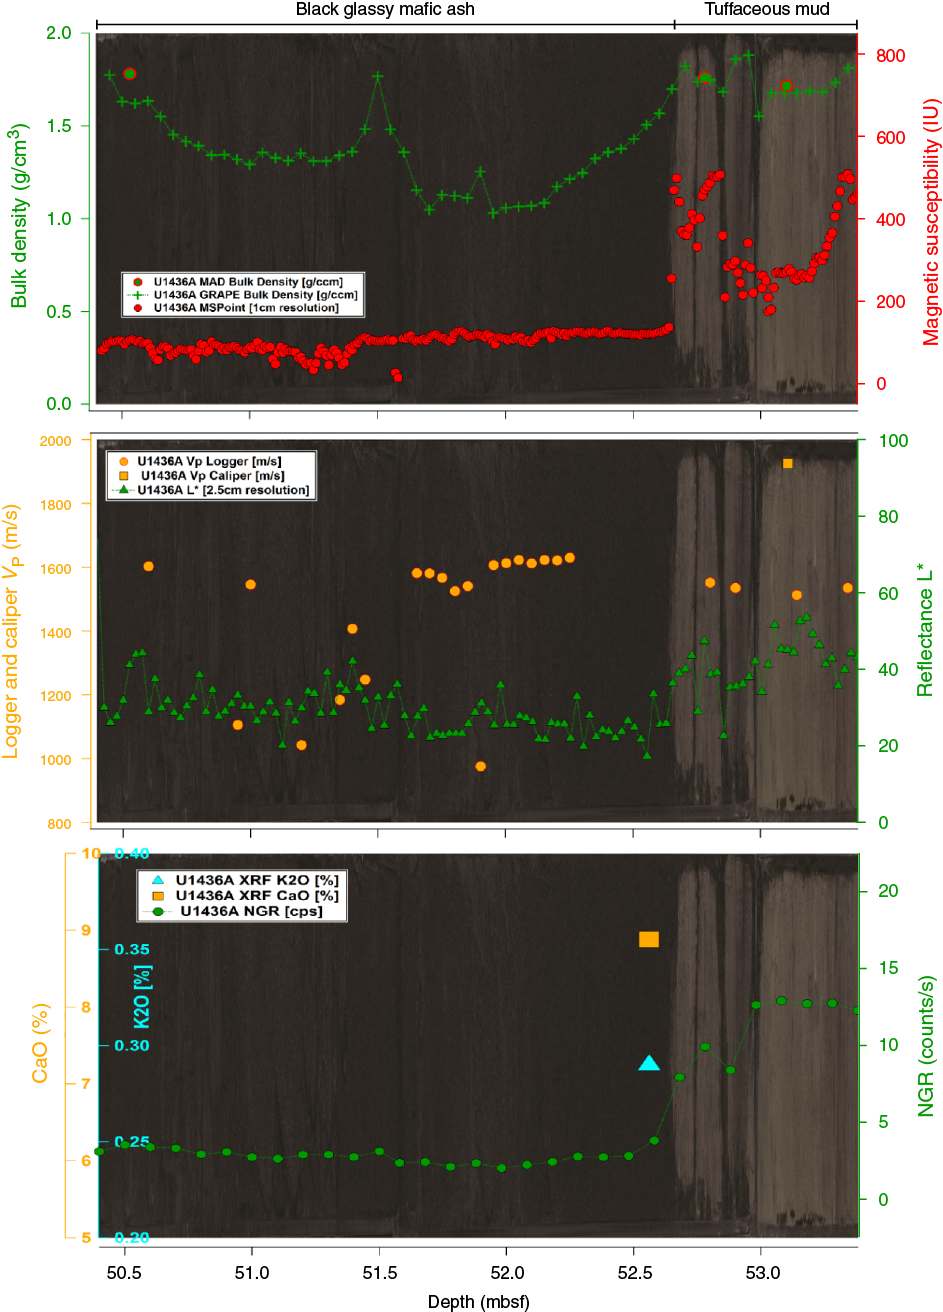
Figure F40. Black glassy mafic ash layer physical properties, Hole U1436A.
Paleomagnetism
Archive-half analysis on the superconducting rock magnetometer
Remanence
Paleomagnetic analysis in Hole U1436A comprised remanence measurements at 2.5 cm intervals before and after archive-half alternating field (AF) demagnetization at 10 mT steps up to 40 mT. Severe core disturbance resulted in complete destruction of the depositional remanence in many intervals, as illustrated by shaded areas in Figure F41. Discontinuous recovery compromised the recognition of magnetostratigraphy in the lower half of the hole. Nevertheless, intervals of continuous tuffaceous mud recovery yielded a good paleomagnetic record, with the drill string overprint largely removed. We did not measure remanence in Holes U1437B, U1437C, and U1437D, owing to time and laboratory constraints near the end of Expedition 350.

Figure F41. SRM inclination on archive halves.
Remanence measured before demagnetization (often referred to simply as natural remanent magnetization [NRM]) ranges in intensity from 5.6 to 7700 mA/m (mean = 600 mA/m), although it should be noted that these values reflect the contribution of both the true NRM and the drilling overprint. The highest NRM values (exceeding 3000 mA/m) correspond to a tuffaceous mud interval that incorporates three mafic ash layers in Section 350-U1436A-5H-2 (27.425–28.75 mbsf). Coarse-grained mafic ash layers display generally high NRM and susceptibility values, although the black glassy mafic ash layer in Core 8H displays low NRM (<100 mA/m), as does another mafic ash layer in Section 9H-4 (Figure F42; also see Physical properties). A number of evolved ash layers present low NRM values, along with low MS values (e.g., in Section 9H-3). These are general observations, and several exceptions exist. It has to be kept in mind that these two magnetic variables depend strongly on the magnetic mineralogy present, and the intensity of NRM, as measured on material recovered in cores, largely reflects the extent of acquisition of the drilling overprint.
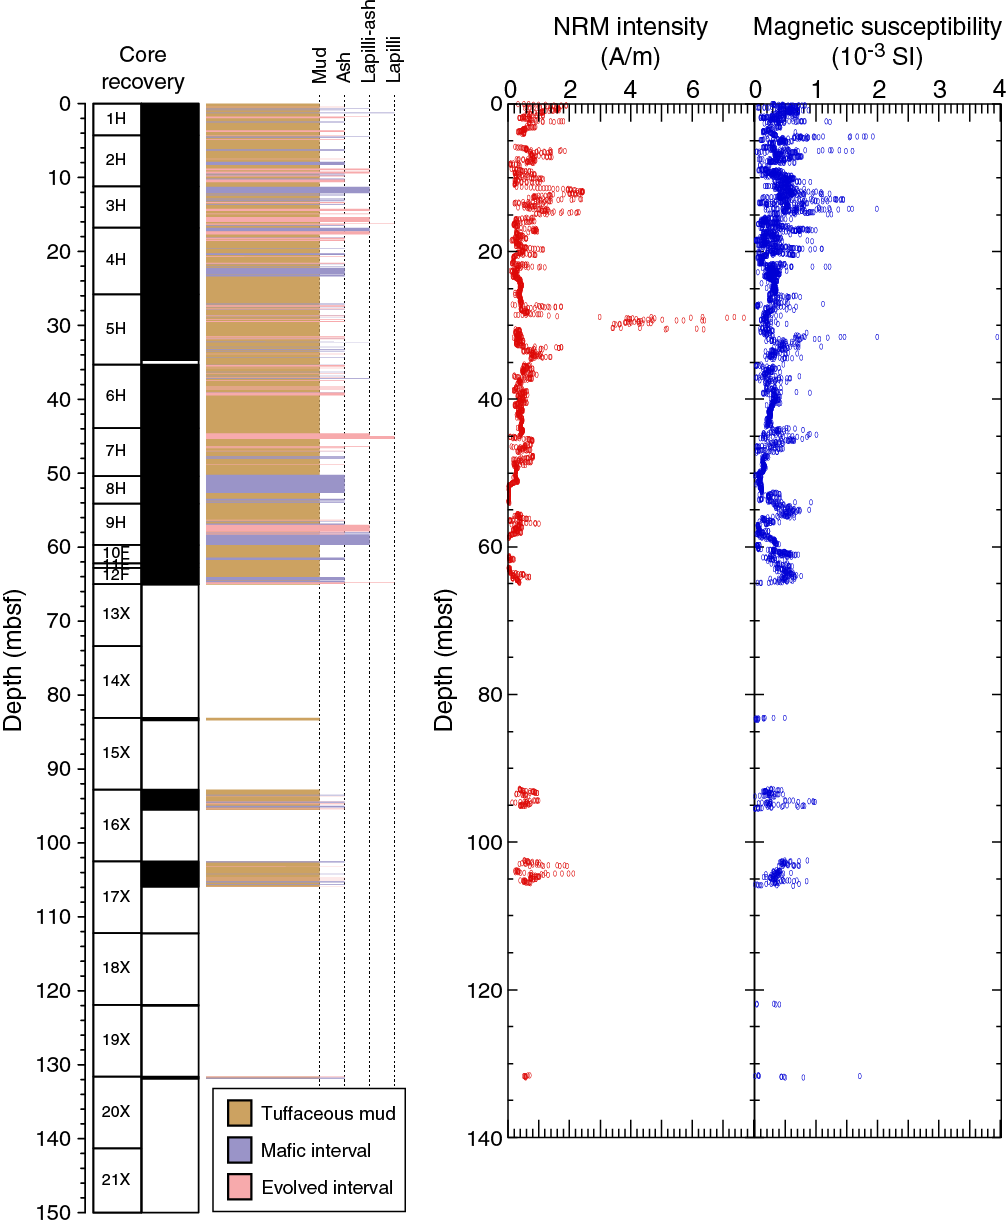
Figure F42. Lithology compared with SRM NRM.
Magnetic polarity from archive-half measurement
Magnetic polarity was interpreted from inclination data. Most of the relatively continuous APC recovery ending with Core 350-U1436A-12F displayed positive demagnetized inclination (normal polarity in the Northern Hemisphere). Fortunately, the base of normal Chron C1n (the Brunhes/Matuyama boundary at 0.781 Ma) was recorded in one of the last continuous tuffaceous mud intervals, at Section 9H-3, 25 cm (i.e., 56.80 mbsf) (Figure F43). The transition from reversed to normal polarity is sharp, spanning only about 10 cm of the core, and appears to correspond to the boundary between two beds, suggesting that at least part of the reversal occurred in the time interval between two successive depositional events.
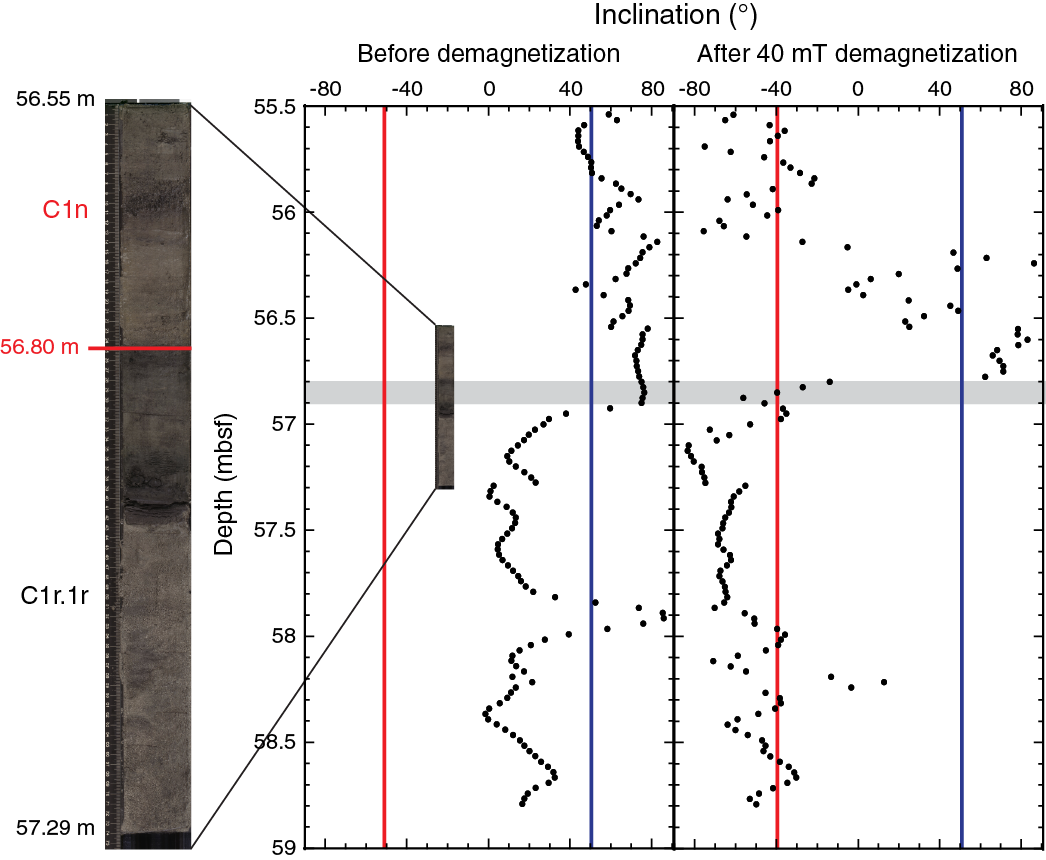
Figure F43. Inclination before and after demagnetization.
Discrete sample analysis
One discrete paleomagnetic cube was sampled per working-half section in undisturbed tuffaceous mud. Remanence on the cubes was measured on the Agico JR-6A spinner magnetometer before demagnetization and after AF demagnetization at 5 mT steps up to 20 mT. Less intense and magnetically softer overprinting of these discrete samples meant that the demagnetized inclination at 20 mT tightly clustered around the expected geocentric axial dipole (GAD) inclination of ±51° (Figure F44). Demagnetization plots showed that most discrete samples had approached a stable endpoint, or were demagnetizing linearly toward the origin, after 20 mT demagnetization (Figure F45). For this reason, we halted demagnetization and measurement of most discrete samples at this level, continuing to 25 mT only in samples near and below the base of Chron C1n, in order to improve the isolation of the reversed polarity remanence. Discrete samples in the discontinuous record below the hiatus in Core 350-U1436A-13X (see Age model) allowed us to recognize two additional datums, although their position is poorly constrained. The top of normal Chron C1r.1n (0.988 Ma) occurs between Samples 9H-4, 66–68 cm (which is reversed), and 10F-2, 64–66 cm (which is normal). The base of normal Chron C1r.1n (1.072 Ma) occurs between Samples 10F-2, 64–66 cm, and 16X-2, 53–55 cm (which is reversed).
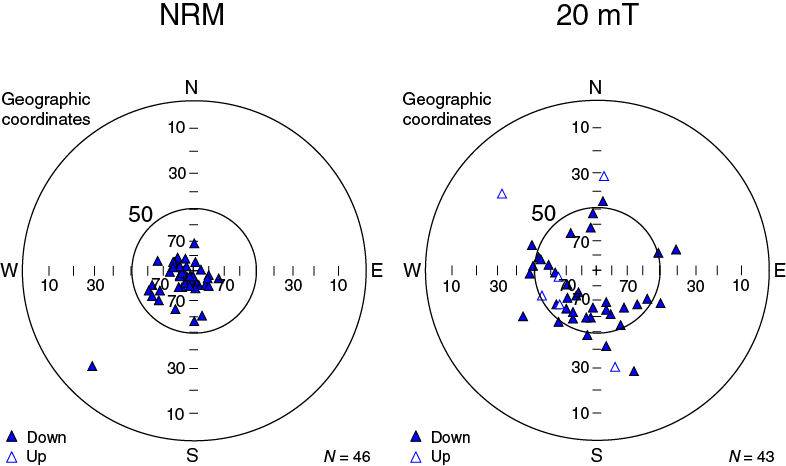
Figure F44. Stereographic plots of unoriented discrete sample directions.
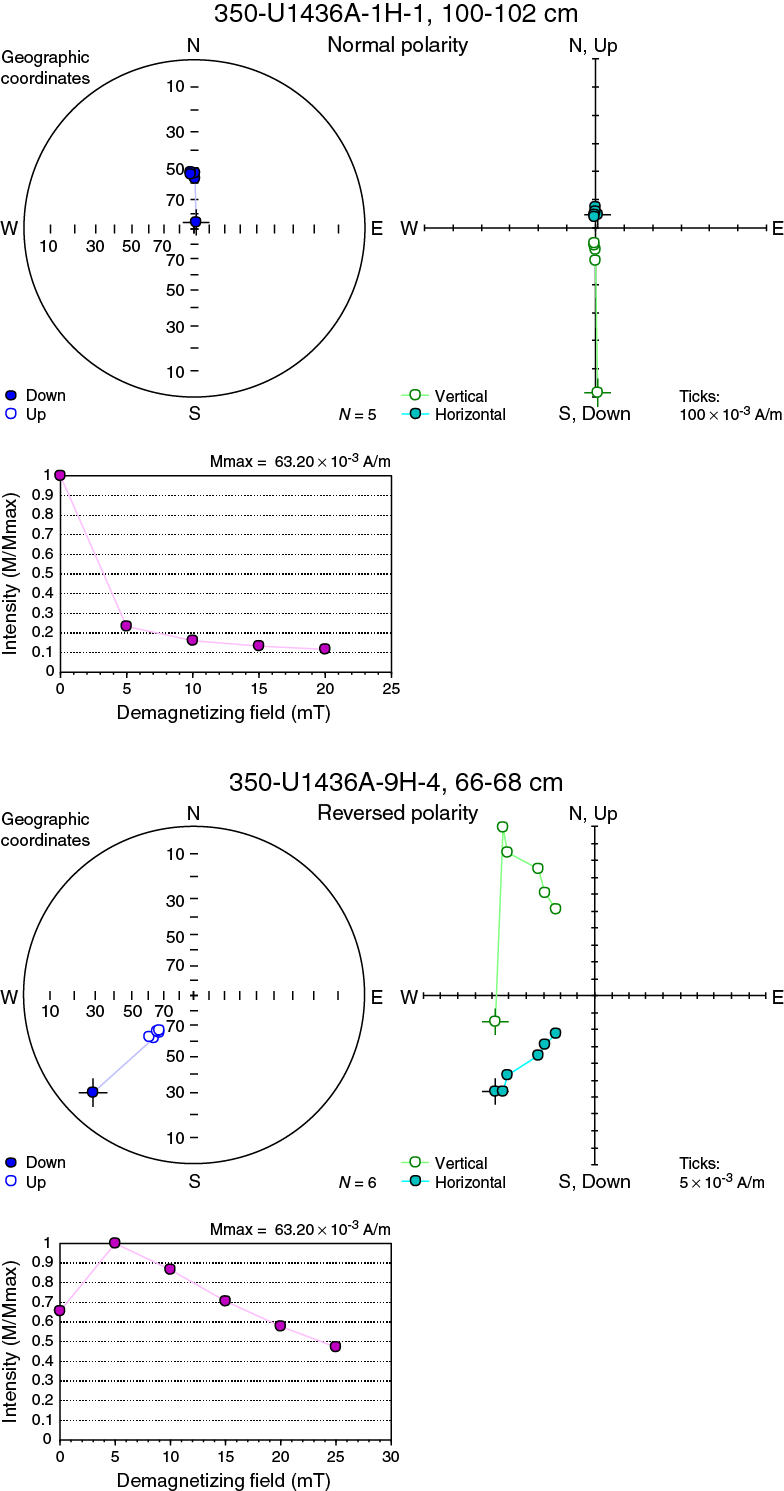
Figure F45. Stereographic projections.
Discrete samples, and a patchy record in the archive-half superconducting rock magnetometer (SRM) measurements, indicate that Core 350-U1436A-17X is all reversed polarity and thus probably still lies in the dominantly reversed polarity Matuyama interval (i.e., <2.581 Ma) (Figure F46). Core catcher Sample 20X-CC may also be reversed, but this is very unreliable.
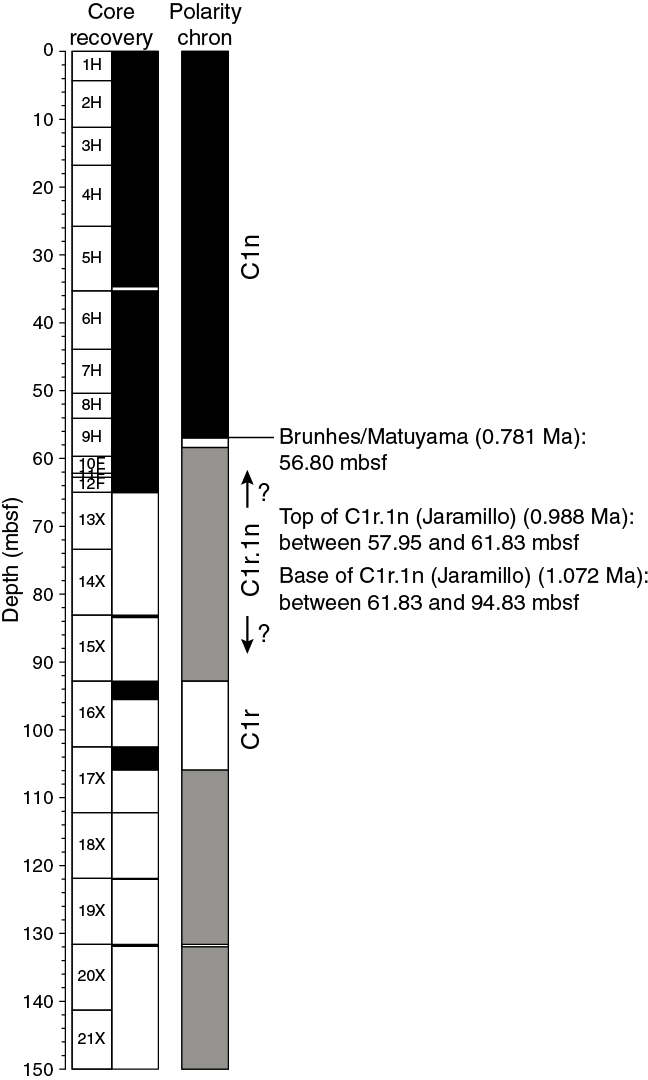
Figure F46. Magnetostratigraphy, Site U1436.
Magnetostratigraphy
The resulting magnetostratigraphy for Hole U1436A is shown in Figure F46. The well-defined position for the base of Chron C1n accords well with biostratigraphic datums and provides the most tightly constrained point in the age model (see Age model).
Implications for Site U1437
Discrete samples at Site U1436 proved a better and more reliably interpreted record of the characteristic remanent magnetization than the SRM analysis of the archive halves. This partly reflected the influence of core disturbance, which requires large proportions of the SRM remanence record to be filtered out, but it is also clear that demagnetization of the discrete samples effectively revealed magnetic polarity at a lower demagnetization level (typically 20 mT or less) than similar demagnetization of the archive halves (which were often still ambiguous at 40 mT). This presumably reflects a combination of the absence in the discrete samples of remobilized tuffaceous mud, which often coats the perimeter of cores, and the weaker degree of overprinting toward the center of cores, from where the discrete samples are taken (see Richter et al., 2007). Our experience at Site U1436 informed the approach to be taken to the analysis of the broadly similar hemipelagic interval in the upper interval at Site U1437.
Biostratigraphy
At Site U1436, a succession of Pleistocene and Pliocene sediments was recovered from Hole U1436A and Pleistocene sediments from Holes U1436B and U1436C. The biochronology was established using planktonic foraminifers and calcareous nannofossils. Both fossil groups were systematically examined in core catcher samples from Samples 350-U1436A-1H-CC through 20X-CC (4.3–131.72 mbsf), 350-U1436B-1H-CC through 14H-CC (4.9–61.7 mbsf), and 350-U1436C-1H-CC through 18F-CC (5.4–70.29 mbsf). Although abundance was variable, most samples yielded sufficient numbers of foraminifers and nannofossils for analysis. The biochronology agrees well between the two fossil groups and shows that the succession in Hole U1436A (the deepest hole) covers the last 2.7 My. A potential hiatus in the Pleistocene is inferred somewhere deeper than 66 mbsf. Deeper than 66 mbsf, foraminifer and nannofossil biozones are difficult to resolve because of the rarity of marker species and possible reworking of older fossils. The ages of the bioevents are mainly assigned with reference to Gradstein et al. (2012; and references therein). We use the designations “T” for top and “B” for bottom, which are synonymous with last appearance datum and first appearance datum, respectively. All datums recognized in Holes U1436A and U1436C along with their corresponding depths in the succession are shown in Tables T4 and T5. Range charts are also available in BIOSTRAT in Supplementary material. A biostratigraphic age-depth plot using these datums is shown in Age model (Figure F47).
Table T4. Planktonic foraminifer datums, ages, and depths, Site U1436. Download table in .csv format.
Table T5. Calcareous nannofossil datums, ages, and depths, Site U1436. Download table in .csv format.
Planktonic foraminifers
Planktonic foraminifers in the succession are generally abundant, although their concentration is reduced in some intervals rich in ash. Specimens are mostly well preserved with no visible etching of test surfaces and light to moderate test fragmentation, with the exception of Section 350-U1436A-5H-6 (34.6 mbsf), which showed evidence of severe dissolution. Semiquantitative relative abundance data for planktonic foraminifer species are shown in Table T6. Most assemblages were dominated by Globorotalia inflata, a common species in subpolar to subtropical areas, and globally associated with the planktonic foraminifer transition zone of Bé and Tolderlund (1971). Overall, species such as Pulleniatina obliquiloculata, Pulleniatina primalis, Globorotalia menardii, and G. inflata are less represented in the older part of the record in Hole U1436A (below Sample 13X-CC; deeper than 65.0 mbsf; older than ~1 Ma) in favor of an increased representation of species from the Globigerinoides and Globigerinita genera. This observation likely reflects surface paleoceanographic changes in the western subtropical Pacific over this interval.
Table T6. Distribution and abundance of planktonic foraminifers, Site U1436. Download table in .csv format.
The biochronology of this site was mainly established with reference to Hole U1436A. The boundary between Biozones Pt1a and Pt1b (0.61 Ma) was placed in Sample 350-U1436A-6H-CC (43.9 mbsf) based on T Globorotalia tosaensis. Other recognized Pleistocene datums included T and B Globigerinoides ruber (pink) (0.12 Ma and 0.4 Ma, respectively), B Globigerinella calida (0.22 Ma), B Globorotalia flexuosa (0.4 Ma), B Globorotalia hessi (0.75 Ma), T Globoturborotalita apertura (1.64 Ma), T Globorotalia pseudomiocenica (2.39 Ma), and T Globoturborotalita decoraperta (2.75 ± 0.03 Ma) (see Table T4 for a full list).
Core catcher samples from Holes U1436B and U1436C yielded datums consistent with those observed in Hole U1436A (Table T4).
Calcifying benthic foraminifers were also examined in Hole U1436A, with very few agglutinated forms. Benthic foraminifers were also generally well preserved but present in too few numbers (<1% of the total foraminifer assemblage) for a reliable quantitative assessment of species abundance within the assemblage. The most represented species in the succession were Bulimina aculeata, Melonis barleeanus, and Uvigerina hispidocostata. Deeper than Sample 350-U1436A-11F-CC (62.7 mbsf), species such as Laticarinina pauperata, Pleurostomella sp. A, and several uniserial species from the genera Stilostomella and Dentalina were also present. The Stilostomellidae are known to have become extinct during the lower to Middle Pleistocene “extinction event” (~0.6–1 Ma); their presence only deeper than Sample 11F-CC (62.7 mbsf) is therefore consistent with the planktonic foraminifer and calcareous nannofossil biostratigraphy presented here (see Table T7).
Table T7. Distribution and abundance of benthic foraminifers, Site U1436. Download table in .csv format.
Calcareous nannofossils
We examined the calcareous nannofossils in the same samples used for foraminiferal analysis and one extra sample (350-U1436A-17X-2W, 50 cm). Calcareous nannofossils were generally abundant and well preserved over the entire succession. Signs of possible reworking were limited to below the Brunhes/Matuyama boundary (see Paleomagnetism). A semiquantitative assessment of preservation and relative species abundance for Holes U1436A and U1436C is shown in Table T8.
Table T8. Distribution and abundance of calcareous nannofossils, Site U1436. Download table in .csv format.
Hole U1436A
All standard bioevents were recognizable in the Middle–Upper Pleistocene succession in Hole U1436A (Table T5). The succession between the top and 16.85 mbsf was assigned to Biozone CN15/NN21 based on the presence of Emiliania huxleyi and the absence of Pseudoemiliania lacunosa in Sample 350-U1436A-3H-CC (16.8 mbsf). The crossover (X) in dominance between Gephyrocapsa caribbeanica and E. huxleyi could be inferred within Sample 2H-CC (11.2 mbsf). However, because of the small size of E. huxleyi, positive identification should ideally be made using scanning electron microscopy. T P. lacunosa was recorded in Sample 5H-6W, 134–139 cm, thus placing the sequence between Samples 5H-6 and 9H-CC (34.6–59.7 mbsf) in Biozone CN14a/NN19. Between Samples 10F-CC and 13X-CC (62.1–65.05 mbsf) no bioevents characterizing the Pleistocene were recorded. The first identifiable bioevent below the hiatus was T Calcidiscus macintyrei (Sample 15X-CC [83.3 mbsf]), falling inside Biozone CN13b/NN19. Deeper than Sample 17X-CC (104.3 mbsf), all marker species were rare, and defining the Pleistocene/Pliocene boundary was therefore problematic. Only rare specimens of diagnostic discoasterids were present, together with some reworked specimens. Biozones CN12d/NN18, CN12c/NN17, and CN12b/NN16 were tentatively identified based on the last occurrences of Discoaster brouweri, Discoaster pentaradiatus, and Discoaster surculus, respectively.
Gephyrocapsa oceanica, G. caribbeanica, G. aperta, Gephyrocapsa small, and Helicosphaera carteri were the dominant species in the succession. Dictyococcites haqii was also abundant in the Upper Pleistocene–Pliocene sequence.
Hole U1436B
The succession in Hole U1436B to Sample 350-U1436B-14H-CC (62 mbsf) is nearly identical to that of Hole U1436A. The first three bioevents (X G. caribbeanica–E. huxleyi, B E. huxleyi, and T P. lacunosa) are all identifiable in Hole U1436B.
Hole U1436C
The 70 mbsf sequence in Hole U1436C records the same bioevents as Holes U1436A and U1436B. Because of the good recovery in Hole U1436C, an additional bioevent, top common (Tc) Reticulofenestra asanoi (T 0.91 Ma), was identified at 66 mbsf (Sample 350-U1436C-17F-CC [67.3 mbsf]). Thus, it was possible to better constrain the hiatus already identified in Hole U1436A in the interval 66–74 mbsf (from Sample 350-U1436C-17F-CC to 350-U1436A-14X-CC).
Age model
A 131.72 m succession of Pleistocene to Pliocene sediments was recovered over a cored interval of 150 m at Site U1436. Thirteen biostratigraphic datums and one magnetostratigraphic datum were selected to construct an age-depth model for this site and to estimate the linear sedimentation rates (LSRs) and mass accumulation rates (MARs) (Table T9; Figure F47).
Table T9. Site U1436 age control points and linear sedimentation rates. Download table in .csv format.
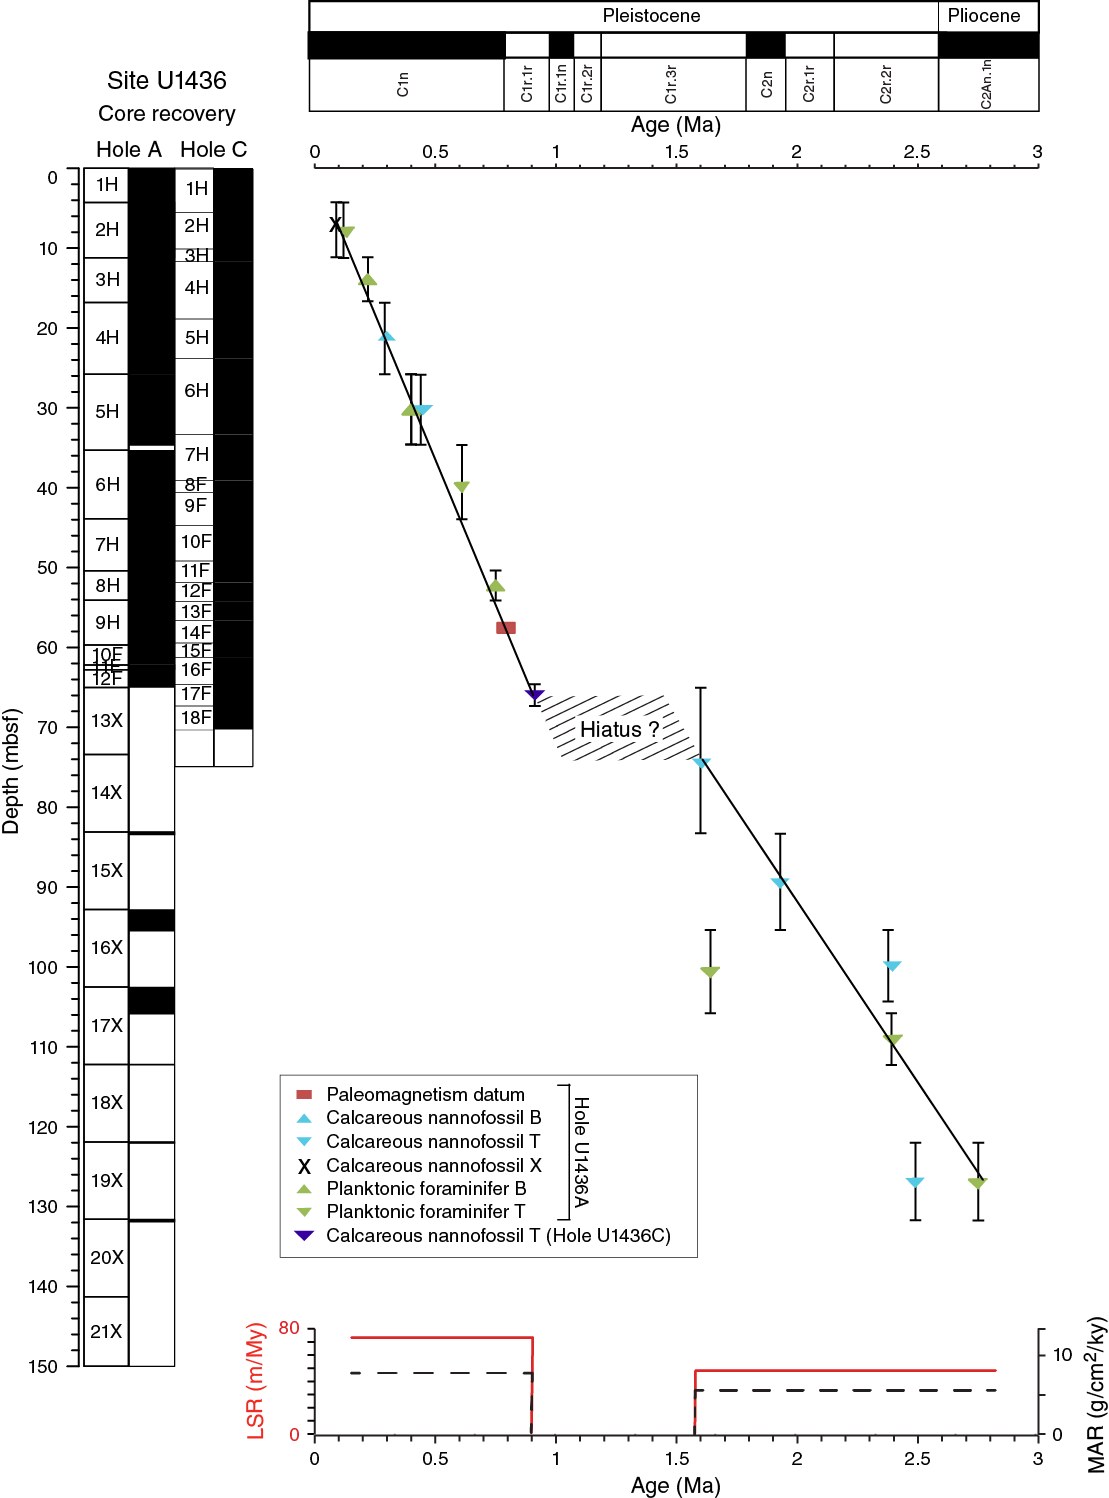
Figure F47. Core recovery.
Biostratigraphic and magnetic reversal data are in agreement for the Upper–Middle Pleistocene section, and the age model was constructed using all datum types. The biostratigraphic datums indicate a possible hiatus between 66 mbsf (Core 350-U1436C-17F) and 74 mbsf (Core 350-U1436A-14X). The upper Pliocene–lower Pleistocene part of the sequence shows some discrepancies between nannofossil and planktonic foraminiferal datums, probably due to reworking and the very low abundance of marker species. Additional magnetostratigraphic datums are not reliable in this older part of the succession because of poor recovery and therefore cannot improve age constraints.
The LSR from the top of Hole U1436A to 66 mbsf averages 71 m/My. The deepest age-indicative sample above the hiatus was at 66 mbsf. Below the hiatus, from the highest age-indicative sample (74 mbsf) to 127 mbsf, the LSR is 45 m/My. At nearby Site 792 (Leg 126), a hiatus was identified at 87 mbsf. A comparison of LSRs between Sites U1436 and 792 over the same interval shows broadly similar values (81–120 m/My at Site 792) in the Upper–Middle Pleistocene sequence. In the upper Pliocene to lower Pleistocene interval, however, Site U1436 shows a low LSR (45 m/My) compared to that of Site 792 (122 m/My). This difference could be due to an underestimation of the LSR below the hiatus at Site U1436 because the tie points are not well constrained due to the rarity of marker species (see Biostratigraphy).
MARs, calculated using dry bulk density, range between 5.34 and 9.92 g/cm2/ky for the upper interval (0–66 mbsf; n = 47 [number of measurements]), and between 5.30 and 6.20 g/cm2/ky for the lower interval (74–127 mbsf; n = 5). The average MAR varies from 7.97 g/cm2/ky in the Upper–Middle Pleistocene interval to 5.70 g/cm2/ky in the upper Pliocene–lower Pleistocene sequence. The higher MAR in the younger part of the succession can explain the high LSR, which could be related to greater volcanic input.
References
Bé, A.W.H., and Tolderlund, D.S., 1971. Distribution and ecology of living planktonic foraminifera in surface waters of the Atlantic and Indian Oceans. In Funnel, B.M., and Riedel, W.R. (Eds.), The Micropaleontology of Oceans: Cambridge, UK (Cambridge University Press), 105–149.
Bickle, M., Arculus, R., Barrett, P., DeConto, R., Camoin, G., Edwards, K., Fisher, F., Inagaki, F., Kodaira, S., Ohkouchi, N., Pälike, H., Ravelo, C., Saffer, D., and Teagle, D., 2011. Illuminating Earth's Past, Present and Future—The Science Plan for the International Ocean Discovery Program 2013–2023: Washington, DC (Integrated Ocean Drilling Program). http://www.iodp.org/Science-Plan-for-2013-2023/
Egeberg, P.K., 1992. Thermodynamic aspects of Leg 126 interstitial waters. In Taylor, B., Fujioka, K., et al., Proceedings of the Ocean Drilling Program, Scientific Results, 126: College Station, TX (Ocean Drilling Program), 519–529. http://dx.doi.org/10.2973/odp.proc.sr.126.153.1992
Expedition 344 Scientists, 2013. Costa Rica Seismogenesis Project, Program A Stage 2 (CRISP-A2): sampling and quantifying lithologic inputs and fluid inputs and outputs of the seismogenic zone. Integrated Ocean Drilling Program Preliminary Report, 344. http://dx.doi.org/10.2204/iodp.pr.344.2013
Fujioka, K., Matsuo, Y., Nishimura, A., Koyama, M., and Rodolfo, K.S., 1992. Tephras of the Izu-Bonin forearc (Sites 787, 792, and 793). In Taylor, B., Fujioka, K., et al., Proceedings of the Ocean Drilling Program, Scientific Results, 126: College Station, TX (Ocean Drilling Program), 47–74. http://dx.doi.org/10.2973/odp.proc.sr.126.117.1992
Gill, J.B., 1981. Orogenic Andesites and Plate Tectonics: Berlin (Springer-Verlag).
Gill, J.B., Hiscott, R.N., and Vidal, P., 1994. Turbidite geochemistry and evolution of the Izu-Bonin arc and continents. Lithos, 33(1–3):135–168. http://dx.doi.org/10.1016/0024-4937(94)90058-2
Gradstein, F.M., Ogg, J.G., Schmitz, M.D., and Ogg, G.M. (Eds.)., 2012. The Geological Time Scale 2012: Amsterdam (Elsevier).
Hochstaedter, A., Gill, J., Peters, R., Broughton, P., Holden, P., and Taylor, B., 2001. Across-arc geochemical trends in the Izu-Bonin arc: contributions from the subducting slab. Geochemistry, Geophysics, Geosystems, 2(7):1019. http://dx.doi.org/10.1029/2000GC000105
Hofmann, A.W., 1988. Chemical differentiation of the Earth: the relationship between mantle, continental crust, and oceanic crust. Earth and Planetary Science Letters, 90(3):297–314.
http://dx.doi.org/10.1016/0012-821X(88)90132-X
Honza, E., and Tamaki, K., 1985. The Bonin arc. In Nairn, A.E.M., Stehli, F.G., and Uyeda, S. (Eds.), The Ocean Basins and Margins (Vol. 7): The Pacific Ocean: New York (Plenum), 459–502.
Ishizuka, O., Taylor, R.N., Yuasa, M., and Ohara, Y., 2011. Making and breaking an island arc: a new perspective from the Oligocene Kyushu-Palau arc, Philippine Sea. Geochemistry, Geophysics, Geosystems, 12(5):Q05005. http://dx.doi.org/10.1029/2010GC003440
Ishizuka, O., Uto, K., and Yuasa, M., 2003. Volcanic history of the back-arc region of the Izu-Bonin (Ogasawara) arc. In Larter, R.D., and Leat, P.T. (Eds.), Tectonic and Magmatic Processes. Geological Society Special Publication, 219(1):187–205. http://dx.doi.org/10.1144/GSL.SP.2003.219.01.09
Jutzeler, M., White, J.D.L., Talling, P.J., McCanta, M., Morgan, S., Le Friant, A., and Ishizuka, O., 2014. Coring disturbances in IODP piston cores with implications for offshore record of volcanic events and the Missoula megafloods. Geochemistry, Geophysics, Geosystems, 15(9):3572–3590. http://dx.doi.org/10.1002/2014GC005447
Kodaira, S., Sato, T., Takahashi, N., Ito, A., Tamura, Y., Tatsumi, Y., and Kaneda, Y., 2007a. Seismological evidence for variable growth of crust along the Izu intraoceanic arc. Journal of Geophysical Research: Solid Earth, 112(B5):B05104. http://dx.doi.org/10.1029/2006JB004593
Kodaira, S., Sato, T., Takahashi, N., Miura, S., Tamura, Y., Tatsumi, Y., and Kaneda, Y., 2007b. New seismological constraints on growth of continental crust in the Izu-Bonin intra-oceanic arc. Geology, 35(11):1031–1034. http://dx.doi.org/10.1130/G23901A.1
Reagan, M.K., Hanan, B.B., Heizler, M.T., Hartman, B.S., and Hickey-Vargas, R., 2008. Petrogenesis of volcanic rocks from Saipan and Rota, Mariana Islands, and implications for the evolution of nascent island arcs. Journal of Petrology, 49(3):441–464. http://dx.doi.org/10.1093/petrology/egm087
Richter, C., Acton, G., Endris, C., and Radsted, M., 2007. Handbook for shipboard paleomagnetists. Ocean Drilling Program Technical Note, 34. http://dx.doi.org/10.2973/odp.tn.34.2007
Rudnick, R.L., and Gao, S., 2004. Composition of the continental crust. Treatise on Geochemistry, 3:1–64.
http://dx.doi.org/10.1016/B0-08-043751-6/03016-4
Shipboard Scientific Party, 1990. Site 792. In Taylor, B., Fujioka, K., et al., Proceedings of the Ocean Drilling Program, Initial Reports, 126: College Station, TX (Ocean Drilling Program), 221–314. http://dx.doi.org/10.2973/odp.proc.ir.126.109.1990
Shukuno, H., Tamura, Y., Tani, K., Chang, Q., Suzuki, T., and Fiske, R.S., 2006. Origin of silicic magmas and the compositional gap at Sumisu submarine caldera, Izu-Bonin arc, Japan. Journal of Volcanology and Geothermal Research, 156(3–4):187–216. http://dx.doi.org/10.1016/j.jvolgeores.2006.03.018
Smith, I.E.M., Worthington, T.J., Price, R.C., Stewart, R.B., and Maas, R., 2006. Petrogenesis of dacite in an oceanic subduction environment: Raoul Island, Kermadec arc. Journal of Volcanology and Geothermal Research, 156(3–4):252–265. http://dx.doi.org/10.1016/j.jvolgeores.2006.03.003
Smith, I.E.M., Worthington, T.J., Stewart, R.B., Price, R.C., and Gamble, J.A., 2003. Felsic volcanism in the Kermadec arc, SW Pacific: crustal recycling in an oceanic setting. In Larter, R.D., and Leat, P.T. (Eds.), Intra-Oceanic Subduction Systems: Tectonic and Magmatic Processes. Geological Society Special Publication, 219(1):99–118. http://dx.doi.org/10.1144/GSL.SP.2003.219.01.05
Stern, R.J., Fouch, M.J., and Klemperer, S., 2003. An overview of the Izu-Bonin-Mariana subduction factory. In Eiler, J. (Ed.), Inside the Subduction Factory. Geophysical Monograph, 138:175–222. http://dx.doi.org/10.1029/138GM10
Summerhayes, C.P., and Thorpe, S.A., 1996. Oceanography: An Illustrated Guide: Hoboken, NJ (John Wiley & Sons), 165–181.
Suyehiro, K., Takahashi, N., Ariie, Y., Yokoi, Y., Hino, R., Shinohara, M., Kanazawa, T., Hirata, N., Tokuyama, H., and Taira, A., 1996. Continental crust, crustal underplating, and low-Q upper mantle beneath an oceanic island arc. Science, 272(5260):390–392. http://dx.doi.org/10.1126/science.272.5260.390
Takada, A., Oshima, O., Aramaki, S., Ono, K., Yoshida, T., and Kajima, K., 1992. Geology of Aogashima Volcano, Izu Islands, Japan. Kazan, 37(5):233–250.
Takazawa, E., Frey, F.A., Shimizu, N., and Obata, M., 2000. Whole rock compositional variations in an upper mantle peridotite (Horoman, Hokkaido, Japan): are they consistent with a partial melting process? Geochimica et Cosmochimica Acta, 64(4):695–716. http://dx.doi.org/10.1016/S0016-7037(99)00346-4
Tamura, Y., Busby, C., and Blum, P., 2013. Izu-Bonin-Mariana Rear Arc: the missing half of the subduction factory. International Ocean Discovery Program Scientific Prospectus, 350. http://dx.doi.org/10.2204/iodp.sp.350.2013
Tamura, Y., Busby, C.J., Blum, P., Guèrin, G., Andrews, G.D.M., Barker, A.K., Berger, J.L.R., Bongiolo, E.M., Bordiga, M., DeBari, S.M., Gill, J.B., Hamelin, C., Jia, J., John, E.H., Jonas, A.-S., Jutzeler, M., Kars, M.A.C., Kita, Z.A., Konrad, K., Mahony, S.H., Martini, M., Miyazaki, T., Musgrave, R.J., Nascimento, D.B., Nichols, A.R.L., Ribeiro, J.M., Sato, T., Schindlbeck, J.C., Schmitt, A.K., Straub, S.M., Vautravers, M.J., and Yang, Y., 2015a. Expedition 350 methods. In Tamura, Y., Busby, C.J., Blum, P., and the Expedition 350 Scientists, Proceedings of the International Ocean Discovery Program, Expedition 350: Izu-Bonin-Mariana Rear Arc: College Station, TX (International Ocean Discovery Program). http://dx.doi.org/10.14379/iodp.proc.350.102.2015
Tamura, Y., Busby, C.J., Blum, P., Guèrin, G., Andrews, G.D.M., Barker, A.K., Berger, J.L.R., Bongiolo, E.M., Bordiga, M., DeBari, S.M., Gill, J.B., Hamelin, C., Jia, J., John, E.H., Jonas, A.-S., Jutzeler, M., Kars, M.A.C., Kita, Z.A., Konrad, K., Mahony, S.H., Martini, M., Miyazaki, T., Musgrave, R.J., Nascimento, D.B., Nichols, A.R.L., Ribeiro, J.M., Sato, T., Schindlbeck, J.C., Schmitt, A.K., Straub, S.M., Vautravers, M.J., and Yang, Y., 2015b. Site U1437. In Tamura, Y., Busby, C.J., Blum, P., and the Expedition 350 Scientists, Proceedings of the International Ocean Discovery Program, Expedition 350: Izu-Bonin-Mariana Rear Arc: College Station, TX (International Ocean Discovery Program). http://dx.doi.org/10.14379/iodp.proc.350.104.2015
Tamura, Y., Gill, J.B., Tollstrup, D., Kawabata, H., Shukuno, H., Chang, Q., Miyazaki, T., Takahashi, T., Hirahara, Y., Kodaira, S., Ishizuka, O., Suzuki, T., Kido, Y., Fiske, R.S., and Tatsumi, Y., 2009. Silicic magmas in the Izu-Bonin oceanic arc and implications for crustal evolution. Journal of Petrology, 50(4):685–723. http://dx.doi.org/10.1093/petrology/egp017
Tamura, Y., Ishizuka, O., Aoike, K., Kawate, S., Kawabata, H., Chang, Q., Saito, S., Tatsumi, Y., Arima, M., Takahashi, M., Kanamaru, T., Kodaira, S., and Fiske, R.S., 2010. Missing Oligocene crust of the Izu-Bonin arc: consumed or rejuvenated during collision? Journal of Petrology, 51(4):823–846. http://dx.doi.org/10.1093/petrology/egq002
Tamura, Y., Ishizuka, O., Stern, R.J., Nichols, A.R.L., Kawabata, H., Hirahara, Y., Chang, Q., Miyazaki, T., Kimura, J.-I., Embley, R.W., and Tatsumi, Y., 2014. Mission immiscible: distinct subduction components generate two primary magmas at Pagan Volcano, Mariana arc. Journal of Petrology, 55(1):63–101. http://dx.doi.org/10.1093/petrology/egt061
Tamura, Y., Tani, K., Chang, Q., Shukuno, H., Kawabata, H., Ishizuka, O., and Fiske, R.S., 2007. Wet and dry basalt magma evolution at Torishima Volcano, Izu-Bonin arc, Japan: the possible role of phengite in the downgoing slab. Journal of Petrology, 48(10):1999–2031. http://dx.doi.org/10.1093/petrology/egm048
Tamura, Y., Tani, K., Ishizuka, O., Chang, Q., Shukuno, H., and Fiske, R.S., 2005. Are arc basalts dry, wet, or both? Evidence from the Sumisu Caldera Volcano, Izu-Bonin arc, Japan. Journal of Petrology, 46(9):1769–1803. http://dx.doi.org/10.1093/petrology/egi033
Tamura, Y., and Tatsumi, Y., 2002. Remelting of an andesitic crust as a possible origin for rhyolitic magma in oceanic arcs: an example from the Izu-Bonin arc. Journal of Petrology, 43(6):1029–1047. http://dx.doi.org/10.1093/petrology/43.6.1029
Tatsumi, Y., Shukuno, H., Tani, K., Takahashi, N., Kodaira, S., and Kogiso, T., 2008. Structure and growth of the Izu-Bonin-Mariana arc crust, 2. Role of crust-mantle transformation and the transparent Moho in arc crust evolution. Journal of Geophysical Research: Solid Earth, 113(B2):B02203. http://dx.doi.org/10.1029/2007JB005121
Tatsumi, Y., and Stern, R.J., 2006. Manufacturing continental crust in the subduction factory. Oceanography, 19(4):104–112. http://dx.doi.org/10.5670/oceanog.2006.09
Taylor, B., 1992. Rifting and the volcanic-tectonic evolution of the Izu-Bonin-Mariana arc. In Taylor, B., Fujioka, K., et al., Proceedings of the Ocean Drilling Program, Scientific Results, 126: College Station, TX (Ocean Drilling Program), 627–651. http://dx.doi.org/10.2973/odp.proc.sr.126.163.1992
Taylor, B., Fujioka, K., et al., 1990. Proceedings of the Ocean Drilling Program, Initial Reports, 126: College Station, TX (Ocean Drilling Program). http://dx.doi.org/10.2973/odp.proc.ir.126.1990
Taylor, R.N., Marlow, M.S., Johnson, L.E., Taylor, B., Bloomer, S.H., and Mitchell, J.G., 1995. Intrusive volcanic rocks in western Pacific forearcs. In Taylor, B., and Natland, J. (Eds.), Active Margins and Marginal Basins of the Western Pacific. Geophysical Monograph., 88:41–43. http://dx.doi.org/10.1029/GM088p0031
Taylor, R.N., and Nesbitt, R.W., 1998. Isotopic characteristics of subduction fluids in an intra-oceanic setting, Izu-Bonin arc, Japan. Earth and Planetary Science Letters, 164(1–2):79–98. http://dx.doi.org/10.1016/S0012-821X(98)00182-4
Taylor, S.R., 1967. The origin and growth of continents. Tectonophysics, 4(1):17–34. http://dx.doi.org/10.1016/0040-1951(67)90056-X
Wright, I.C., Worthington, T.J., and Gamble, J.A., 2006. New multibeam mapping and geochemistry of the 30°–35° S sector, and overview, of southern Kermadec arc volcanism. Journal of Volcanology and Geothermal Research, 149(3–4):263–296. http://dx.doi.org/10.1016/j.jvolgeores.2005.03.021
Yamazaki, T., and Yuasa, M., 1998. Possible Miocene rifting of the Izu–Ogasawara (Bonin) arc deduced from magnetic anomalies. Island Arc, 7(3):374–382. http://dx.doi.org/10.1111/j.1440-1738.1998.00196.x
Yuasa, M., and Kano, K., 2003. Submarine silicic calderas on the northern Shichito-Iwojima Ridge, Izu-Ogasawara (Bonin) arc, western Pacific. In White, J.D.L., Smellie, J.L., and Clague, D.A. (Eds.), Explosive Subaqueous Volcanism. Geophysical Monograph, 140:231–243. http://dx.doi.org/10.1029/140GM15
1 Tamura, Y., Busby, C.J., Blum, P., Guèrin, G., Andrews, G.D.M., Barker, A.K., Berger, J.L.R., Bongiolo, E.M., Bordiga, M., DeBari, S.M., Gill, J.B., Hamelin, C., Jia, J., John, E.H., Jonas, A.-S., Jutzeler, M., Kars, M.A.C., Kita, Z.A., Konrad, K., Mahony, S.H., Martini, M., Miyazaki, T., Musgrave, R.J., Nascimento, D.B., Nichols, A.R.L., Ribeiro, J.M., Sato, T., Schindlbeck, J.C., Schmitt, A.K., Straub, S.M., Vautravers, M.J., and Yang, Y., 2015. Site U1436. In Tamura, Y., Busby, C.J., Blum, P., and the Expedition 350 Scientists, Proceedings of the International Ocean Discovery Program, Expedition 350: Izu-Bonin-Mariana Rear Arc: College Station, TX (International Ocean Discovery Program). http://dx.doi.org/10.14379/iodp.proc.350.103.2015
2Expedition 350 Scientists’ addresses.
Figure F1. A. Tectonic setting of the Izu-Bonin-Mariana (IBM) arc (modified from Taylor, 1992; Tamura and Tatsumi, 2002). The IBM arc trench system forms the convergent margin between the Pacific and Philippine Sea plates. Double lines indicate spreading centers active in the Mariana Trough and inactive (relic) in the Shikoku and Parece Vela Basins. The Izu arc, Bonin arc, West Mariana Ridge, and Mariana arc are outlined by the 3 km bathymetric contour, and other basins and ridges are outlined by the 4 km contour. Box shows area of B. B. Map of the 16 Quaternary volcanoes on the Izu arc front (modified from Tamura et al., 2009), showing positions of Expedition 350 sites (Site U1436 in the fore arc and Site U1437 in the rear arc); ODP sites are also shown. Dotted line along arc front indicates locations of 103 ocean-bottom seismometers deployed at ~5 km intervals (Kodaira et al., 2007a, 2007b); for profile see Figure F3 in the Site U1437 chapter (Tamura et al., 2015b).
Figure F2.Location of Site U1436 (IBM-4GT) and ODP Sites 792, 786, and 787. Site U1436 lies 60 km east of Aogashima, an arc-front mafic volcano that forms a small inhabited island; east of that is the East (Higashi) Aogashima submarine caldera, which also appears on the west end of the line of section shown in Figure F4.
Figure F3. Izu arc seismic stratigraphy. P-wave velocity after Suyehiro et al. (1996). Expedition 350 drilled two sites: Site U1436 in the fore arc and Site U1437 in the rear arc. Site U1436 is a geotechnical hole for Site IBM-4 (see Figure F2) and lies 1.5 km from Site 792. Other ODP sites are projected onto the line of section (black bars). Site U1436 is located 25 km north of the seismic line shown here. BON = boninite, FAB = fore-arc basalt.
Figure F4. A. Time-migrated MCS section IBM4-EW5 along the east–west profile through proposed Site IBM-4 (M. Yamashita, pers. comm., 2014). In order to better image the intracrustal structure and to precisely define the upper/middle crust boundary beneath Site IBM-4, seismic experiments were conducted in 2008 using the Japan Agency for Marine-Earth Science and Technology R/V Kairei (KR08-09) to deploy a wide-angle ocean-bottom seismometer array with 1 km intervals. Seismic velocity (VP) of 5 and 6 km/s are inferred to represent upper crust volcanic rocks and middle crust intermediate pluton, respectively. B. Lithostratigraphic Units I–VI described from Site 792 by Taylor, Fujioka, et al. (1990) and inferred intracrustal structure deeper than 886 mbsf.
Figure F5. Bathymetric features of the eastern Philippine Sea, including the IBM arc system, from Tamura et al. (2010), showing positions of Expedition 350 sites (Site U1436 in fore arc and Site U1437 in rear arc). Black dashed lines = wide-angle seismic profiles: the two approximately north–south seismic profiles (along the present-day arc front and rear arc ~150 km west of the arc front) are presented in the Site U1437 chapter (Tamura et al., 2015b). The lines of circles = three conspicuous north–south rows of long-wavelength magnetic anomalies, attributed to loci of Eocene–Oligocene magmatic centers by Yamazaki and Yuasa (1998). Site U1436 lies on the eastern row of anomalies, which coincides with a fore-arc high (also referred to as the Shin-Kurose Ridge, see text).
Figure F6. Major element compositions of representative subarc mantle (45.6 wt% SiO2 and 38.6 wt% MgO; Takazawa et al., 2000), primary (basalt) arc magma in the Mariana arc, which is in equilibrium with the subarc mantle (48.2 wt% SiO2 and 16.4 wt% MgO; Tamura et al., 2014), and average continental crust, which is andesitic in composition (60.6 wt% SiO2 and 4.7 wt% MgO; Rudnick and Gao, 2004).
Figure F7. Primitive mantle–normalized trace element patterns of average continental crust (Rudnick and Gao, 2004) and two basalt samples from the Pagan Volcano and Mariana arc, interpreted as primary magma compositions (Tamura et al., 2014).
Figure F8. Volume-weighted histograms of rock types from (A) the Quaternary Izu arc (30.5°–35.0°N) (Tamura and Tatsumi, 2002) and (B) the Kermadec arc (30.0°~36.5°S) (Wright et al., 2006), suggesting bimodal volcanism in the oceanic arcs. Basalt and basaltic andesite (<57 wt% SiO2) are clearly the predominant eruptive products but dacite and/or rhyolite also form a major mode.
Figure F9. Sr, Nd, and Pb isotopes along the Izu arc front from Oshima to southwest Torishima volcanoes, divided into basalt- and rhyolite-dominated volcanoes (modified from Tamura et al., 2007, 2009, and data sources cited therein, including Taylor and Nesbitt, 1998; Ishizuka et al., 2003; Tamura et al., 2005, 2007). Volcano locations shown on Figure F1B. For comparison, lava from active rifts (behind arc front) and from rear-arc volcanoes are shown.
Figure F10. From Tamura et al., 2009. A. Along-arc crustal structure (dotted line; thickness of middle crust with VP = 6.0–6.8 km/s at depths between 5 and 20 km) and average SiO2 of volcanic rocks (black squares) sampled and dredged from the 16 Izu arc Quaternary volcanoes (Figure F1B). The basalt-dominant island volcanoes produce small volumes of rhyolites referred to as R1 by Tamura et al. (2009). Rhyolite-dominant submarine volcanoes erupt mostly rhyolite that is compositionally distinct from R1, referred to as R2 by Tamura et al. (2009). B. Schematic crustal structure of the Izu arc front from Hachijo to Sumisu volcanoes showing alternating basalt-dominant island volcanoes and rhyolite-dominant submarine volcanoes, which have thick and thin middle crust and erupt R1 and R2 rhyolite, respectively.
Figure F11. Composite core scan (350-U1436A-3H). Inset is a blow-up of 3H-2, 2–86 cm, and a graphic log highlights important features.
Figure F12. Summary lithostratigraphic log, Hole U1436A.
Figure F13. Downhole evolution in the relative proportions of the three main lithofacies in Hole U1436A. Relative abundances are the normalized total thickness of each lithofacies per core. Values are not plotted where recovery is too low or where core disturbance is too severe.
Figure F14. Hole U1436A lithofacies. Top: tuffaceous mud (17X-3A, 11–24 cm [105.21–105.34 mbsf]). Bottom: isolated pumice in tuffaceous mud (4H-1A, 103–108 cm [17.85–17.87 mbsf]).
Figure F15. Hole U1436A lithofacies. Top: mafic ash intercalated with tuffaceous mud (16X-2A, 79–83 cm [95.09–95.13 mbsf]). Bottom: normally graded mafic ash transitioning to tuffaceous mud (3H-2A, 39–50 cm [13.09–13.20 mbsf]).
Figure F16. Hole U1436A lithofacies. Top: scoria clast (1H-1, 126–127 cm; TS01 [1.26–1.27 mbsf]). Bottom: normally graded mafic lapilli-ash with scoria clasts (6H-2A, 34–44 cm [37.14–37.24 mbsf]).
Figure F17. Correlation between all Site U1436 holes from 46.15 mbsf and deeper. Tie lines link evolved ash layers, which form good markers because they are undisturbed due to their thinness, with tuffaceous mud above and below.
Figure F18. Hole U1436A lithofacies. Top: range of mafic ash shard morphologies in black glassy mafic ash (8H-2, 97–99 cm; TS03 [52.55–52.57 mbsf]). Bottom: allochthonous black glassy mafic ash intercalated with tuffaceous mud (8H-3A). The mafic ash layer is the result of mid-core flow-in core disturbance.
Figure F19. Nongraded, nonstratified layer of black glassy mafic ash, Hole U1436D (7F-2A, 0–90 cm [52.82–53.72 mbsf]) bounded by tuffaceous mud at top and bottom. The layer is weakly disturbed by core extension.
Figure F20. Normally graded evolved ash intercalated with tuffaceous mud lithofacies, Hole U1436A (4H-2A, 10–29 cm [18.40–18.59 mbsf]).
Figure F21. Hole U1436A lithofacies. Evolved lapilli-ash with pumice intercalated with tuffaceous mud (1H-2A, 21–29 cm [1.73–1.76 mbsf]). Evolved lapilli-ash with pumice and scoria lapilli (3H-3A, 6–35 cm [14.09–14.35 mbsf]).
Figure F22. Correlation between lithostratigraphy in the upper 3 m of Holes U1436A–U1436C, showing perfect correlation of units. Stratigraphy is much more complicated in the rest of the holes, as shown in Figure F17.
Figure F24. Pore water salinity, chloride (titration), chloride (IC), and bromide, Hole U1436A (circles). Squares = Hole 792A data, dashed lines = abundances for standard seawater (IAPSO) (Summerhayes and Thorpe, 1996).
Figure F23. Headspace methane concentrations, Hole U1436A, reported in ppmv of 1 cm3 of air. Methane is plotted at 0 when below detection.
Figure F25. Pore water alkalinity, pH, ammonium, sulfate, and phosphate, Hole U1436A (circles). Squares = Hole 792A data, dashed lines = IAPSO seawater compositions (Summerhayes and Thorpe, 1996).
Figure F26. Pore water geochemical depth profiles, Hole U1436A (circles). IC results for Na, Ca, and Mg and ICP-AES results for B, Ba, Fe, Li, Mn, Si, and Sr. Squares = Hole 792A data, dashed lines = IAPSO seawater compositions (seawater Si 99 µM is below scale; Summerhayes and Thorpe, 1996).
Figure F27. Major element compositions for ash and lapilli samples measured by ICP-AES, Hole U1436A. The bulk samples of black glassy mafic ash are 8H-1, 92–93 cm (51.3 mbsf), 8H-2, 97–99 cm (52.6 mbsf), and 8H-3, 55–56 cm (53.5 mbsf), and a single elevated K2O pumice composite (7H-2, 20–75 cm [45 mbsf]) is plotted. Oxides are plotted against SiO2 (Harker diagrams). Data sources referenced in Tamura et al. (2013). Dashed line separates low-K from medium-K field (after Gill, 1981). (Continued on next page.)
Figure F28. Trace element abundances for ash and lapilli samples measured by ICP-AES and volatile (LOI) abundances for volcaniclastics measured by gravimetry, Hole U1436A. Tuffaceous mud (4H-6, 60–62 cm [24.9 mbsf]) is plotted for comparison. Top: Sr vs. SiO2 (normalized to 100 wt%). Bottom: LOI vs. SiO2 (not normalized). See Figure F27 for additional data sources.
Figure F30. GRA bulk density and P-wave velocity profiles, Holes U1436A–U1436D.
Figure F31. Bulk density, porosity, and P-wave velocity with simplified lithology column, Hole U1436A. GRA bulk density values <1.2 g/cm3 are not displayed because those values are related to cracks, voids, or slurry and are not realistic for sediment cores.
Figure F33. Magnetic susceptibility and NGR profiles, Holes U1436A–U1436D.
Figure F32. Shear strength measurements with simplified lithology column, Hole U1436A.
Figure F34. Magnetic susceptibility and NGR data with simplified lithology column, Hole U1436A.
Figure F35. Thermal conductivity data with simplified lithology column, Hole U1436A.
Figure F36. Color reflectance profiles, Holes U1436A–U1436D. L* (luminosity), a* (redness), and b* (yellowness).
Figure F37. Color reflectance with simplified lithology column, Hole U1436A. L* (luminosity), a* (redness), and b* (yellowness).
Figure F38. Magnetic susceptibility and NGR for evolved and mafic volcaniclastic layers, Hole U1436A.
Figure F39. GRA bulk density and reflectance L* for evolved and mafic volcaniclastic layers, Hole U1436A.
Figure F40. Magnetic susceptibility, GRA bulk density, NGR, CaO and K2O from XRF, P-wave velocity, and reflectance L* for the black glassy mafic ash layer at ~50–52 mbsf, Hole U1436A.
Figure F41. SRM inclination on archive halves before and after 40 mT AF demagnetization. Normal (blue) and reversed (red) GAD inclinations (±51°) for the site latitude. Movement away from steep positive (>+80°) after demagnetization indicates removal of the drilling overprint. Although some negative inclinations deeper than 56.80 mbsf (the Brunhes/Matuyama boundary) appear to be reversed, much of the scatter in inclination is related to severe core disturbance (shaded areas). Last column indicates magnetic polarity determined after 20 mT demagnetization on discrete samples: solid = normal, open = reversed, gray = indeterminate polarity.
Figure F42. Lithology compared with SRM NRM before demagnetization and SHMSL point magnetic susceptibility.
Figure F43. Inclination before and after demagnetization (Core 350-U1436A-9H). Normal (blue) and reversed (red) GAD inclinations. The upper two sections (to 56.55 mbsf) were heavily disturbed, and their inclination record is unreliable. Section 9H-3 (enlarged at left) comprises undisturbed tuffaceous mud, and a magnetic polarity reversal (indicated by gray band) corresponding to the Brunhes/Matuyama (C1n/C1r.1r) boundary at 56.80 mbsf is preserved.
Figure F44. Stereographic plots of unoriented discrete sample directions before and after 20 mT AF demagnetization. Inner ring = GAD inclination (~50°). Undermagnetized NRM is characterized by steep positive (down) inclinations. After demagnetization both normal (down) and reversed (up) polarities cluster around the GAD inclination.
Figure F45. Stereographic projections, vector demagnetization (Zijderveld) plots, and intensity vs. demagnetization plots for typical normal and reversed discrete samples.
Figure F46. Magnetostratigraphy, Site U1436. Black = normal, white = reversed, gray = undetermined polarity.
Figure F47. Core recovery, shipboard biostratigraphic and magnetostratigraphic (Gradstein et al., 2012) datums and our constructed age-depth model, and LSRs and MARs calculated from age model. T = top, B = bottom, X = crossover.
- F1. Tectonic setting of IBM arc.
- F2. Location of Site U1436.
- F3. Izu arc seismic stratigraphy.
- F4. Time-migrated MCS section IBM4-EW5.
- F5. Bathymetric features of the eastern Philippine Sea.
- F6. Major element compositions.
- F7. Primitive mantle–normalized trace element patterns.
- F8. Volume-weighted histograms of rock types.
- F9. Sr, Nd, and Pb isotopes along the Izu arc front.
- F10. Along-arc crustal structure.
- F11. Composite core scan (350-U1436A-3H).
- F12. Summary lithostratigraphic log, Hole U1436A.
- F13. Downhole evolution in proportions of lithofacies, Hole U1436A.
- F14. Tuffaceous mud, Hole U1436A.
- F15. Mafic ash, Hole U1436A.
- F16. Scoria clast, Hole U1436A.
- F17. Correlation between all Site U1436 holes.
- F18. Black glassy mafic ash, Hole U1436A.
- F19. Nongraded, nonstratified layer of black glassy mafic ash, Hole U1436D.
- F20. Normally graded evolved ash, Hole U1436A.
- F21. Evolved lapilli-ash, Hole U1436A.
- F22. Lithostratigraphy correlation, upper 3 m of Holes U1436A–U1436C.
- F23. Headspace methane concentrations, Hole U1436A.
- F24. Salinity, chloride, and bromide, Hole U1436A.
- F25. Alkalinity, pH, ammonium, sulfate, and phosphate, Hole U1436A.
- F26. Geochemical depth profiles, Hole U1436A.
- F27. Major element compositions for ash and lapilli, Hole U1436A.
- F28. Trace element abundances for ash and lapilli, Hole U1436A.
- F29. Compositions for ash and lapilli, Hole U1436A.
- F30. GRA bulk density and P-wave velocity profiles, Holes U1436A–U1436D.
- F31. Bulk density, porosity, and P-wave velocity, Hole U1436A.
- F32. Shear strength, Hole U1436A.
- F33. Magnetic susceptibility and NGR profiles, Holes U1436A–U1436D.
- F34. Magnetic susceptibility and NGR, Hole U1436A.
- F35. Thermal conductivity, Hole U1436A.
- F36. Color reflectance, Holes U1436A–U1436D.
- F37. Color reflectance, Hole U1436A.
- F38. Magnetic susceptibility and NGR for volcaniclastic layers, Hole U1436A.
- F39. GRA bulk density and L* for volcaniclastic layers, Hole U1436A.
- F40. Black glassy mafic ash layer physical properties, Hole U1436A.
- F41. SRM inclination on archive halves.
- F42. Lithology compared with SRM NRM.
- F43. Inclination before and after demagnetization.
- F44. Stereographic plots of unoriented discrete sample directions.
- F45. Stereographic projections.
- F46. Magnetostratigraphy, Site U1436.
- F47. Core recovery.
- Table T1. Coring summary, Site U1436.
- Table T2. Summary statistics for physical properties measurements, Holes U1436A–U1436D.
- Table T3. Physical properties value ranges for mafic volcaniclastics, evolved volcaniclastics, or both, Hole U1436A.
- Table T4. Planktonic foraminifer datums, ages, and depths, Site U1436.
- Table T5. Calcareous nannofossil datums, ages, and depths, Site U1436.
- Table T6. Distribution and relative abundance of planktonic foraminifer species, Site U1436.
- Table T7. Distribution and relative abundance of benthic foraminifer species, Site U1436.
- Table T8. Distribution and relative abundance of calcareous nannofossils, Site U1436.
- Table T9. Site U1436 age control points and linear sedimentation rates.