Reagan, M.K., Pearce, J.A., Petronotis, K., and the Expedition 352 Scientists, 2015
Proceedings of the International Ocean Discovery Program Volume 352
publications.iodp.org

doi:10.14379/iodp.proc.352.105.2015
Site U14411
M.K. Reagan, J.A. Pearce, K. Petronotis, R. Almeev, A.A. Avery, C. Carvallo, T. Chapman, G.L. Christeson, E.C. Ferré, M. Godard, D.E. Heaton, M. Kirchenbaur, W. Kurz, S. Kutterolf, H.Y. Li, Y. Li, K. Michibayashi, S. Morgan, W.R. Nelson, J. Prytulak, M. Python, A.H.F. Robertson, J.G. Ryan, W.W. Sager, T. Sakuyama, J.W. Shervais, K. Shimizu, and S.A. Whattam2
Keywords: International Ocean Discovery Program, IODP, JOIDES Resolution, Expedition 352, Site U1441, Izu-Bonin-Mariana fore arc, subduction initiation, mantle melting, ophiolites, basalt, volcanic rocks, drill core
MS 352-105: Published 29 September 2015
Background and objectives
The Izu-Bonin-Mariana (IBM) fore arc is believed to have formed during the period of seafloor spreading that accompanied the rapid rollback and sinking of the newly subducting Pacific plate immediately following subduction initiation at 51–52 Ma (Ishizuka et al., 2011). The deepest and oldest volcanic rock appears to be fore-arc basalt (FAB), a distinctive type of volcanic rock recovered during dredging and submersible sampling of the IBM fore arc (Reagan et al., 2010). Drilling at Site U1440 also intersected this rock type.
The initial reconstruction of the IBM volcanic stratigraphy based on diving and dredging provided evidence that FAB is overlain by the initial products of arc volcanism, specifically, lavas with compositions that are transitional between FAB and boninite, overlain by boninite lavas themselves, and finally by members of the tholeiitic and calc-alkaline series typical of “normal” island arcs. However, this stratigraphy was considered speculative because it was pieced together from samples collected at sites that were a considerable distance apart. Coring at Sites U1439 and U1440 ended in doleritic dike rocks with compositions resembling the overlying lavas, suggesting an alternative crustal architecture, namely that boninites erupted west of FAB crust.
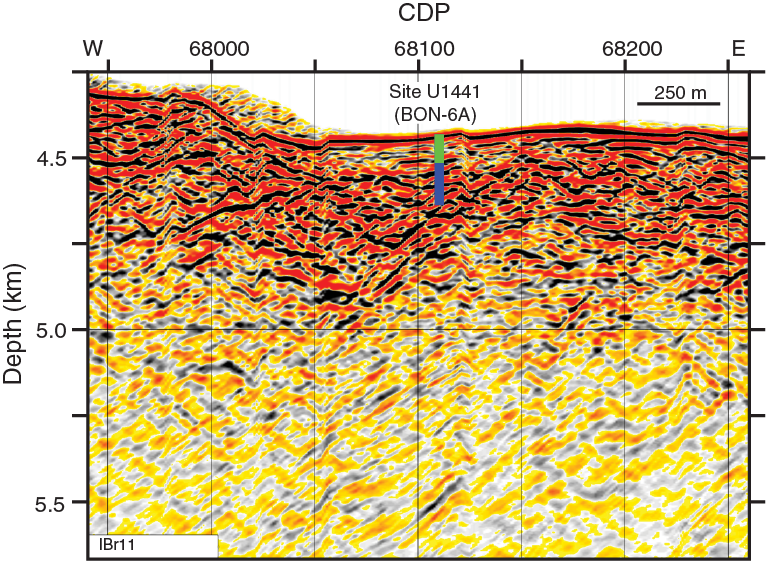
Site U1441 was chosen for drilling because it was the most promising location of the remaining approved sites for further refining the sequence from FAB to boninite, as well as for providing further understanding of the pattern of eruption of these lava types (Figures F1, F2). This site was also chosen to determine whether the compositions of IBM fore-arc lavas are entirely gradational between FAB and boninite or whether a compositional gap exists between these two end-members. Finding lavas with transitional compositions at Site U1441 would provide the opportunity to determine the relative ages of these lavas compared to boninite and FAB. In any case, drilling at this site would enhance our understanding of the fore-arc crustal architecture and the timescale of its construction. Ultimately, the data from all sites will allow us to better constrain the dynamics of subduction and concomitant mantle flow that led to the development of the Izu-Bonin-Mariana arc.

The specific objectives for Site U1441 fit into the four overall expedition objectives as follows:
- Obtain a high-fidelity record of magmatic evolution during subduction initiation by coring volcanic rocks down to underlying intrusive rocks, including radiometric and biostratigraphic ages.
Coring of the volcanic succession at Site U1441 was targeted to provide lavas with compositions and ages between FAB and boninite.
- Use the results of Objective 1 to test the hypothesis that fore-arc basalt lies beneath boninites and to understand chemical gradients within these units and across their transitions.
We expected FAB to be present at the base of the Bonin fore-arc volcanic succession and a sequence of boninitic and arc-like lavas to be present at the top, but results at Sites U1439 and U1440 reveal that the lava types may be offset more horizontally than vertically. Clearly, the nature of the transitions from one magma type to the next needs to be better understood to enable us to more fully document how mantle and subducted sources and processes changed with time as subduction progressed. Site U1441 was targeted to recover rocks between the earlier drill sites to better constrain the stratigraphic record of the transition from FAB (Site U1440) to boninite (Site U1439).
- Use drilling results to understand how mantle melting processes evolve during and after subduction initiation.
Determining how lava compositions and their locations of eruption change with time after subduction initiation in the IBM system addresses this objective. FAB compositions indicate that adiabatic decompression is the most important process at the very beginning of subduction initiation, and boninites indicate that flux melting of more depleted mantle was important shortly thereafter. Information obtained from the Site U1441 cores may allow construction of more realistic models for the transition in time and space from decompression-dominated to fluid flux-dominated mantle mantling.
- Test the hypothesis that the fore-arc lithosphere created during subduction initiation is the birthplace of suprasubduction zone ophiolites.
Drilling at Site U1441 was targeted to provide a crucial middle section of the volcanic chemostratigraphy of the Bonin fore arc, enhancing our ability to compare the IBM fore arc with suprasubduction zone ophiolites, such as Pindos in Greece, Mirdita in Albania, Semail in Oman, and Troodos in Cyprus.
Operations
Transit to Site U1441
The R/V JOIDES Resolution completed the 6.2 nmi transit from Site U1439 in dynamic positioning mode while the drill string was being lowered to the seafloor. The vessel arrived at Site U1441 (proposed Site BON-6A) at 1512 h on 11 September 2014 (all times are ship local time, which is UTC + 9 h), and a seafloor positioning beacon was deployed.
Hole U1441A
A rotary core barrel (RCB) bottom-hole assembly (BHA; see Introduction in the Expedition 352 methods chapter [Reagan et al., 2015]) was assembled with a C-4 bit. Hole U1441A was spudded at 2245 h on 11 September 2014 (28°25.6379′N, 142°43.5390′E; 4447 m water depth). The RCB coring system with nonmagnetic core barrels was deployed 22 times (Cores 352-U1441A-1R through 22R), and the hole was advanced to 205.7 mbsf (Table T1). Cores 11R and 12R had no recovery as a result of a plugged bit. Hole U1441A was terminated as a result of poor core recovery and the rubbly nature of the formation and high risk of getting stuck. A total of 22 RCB cores were taken over a 205.7 m interval and recovered 50.7 m (25%). The total time spent in Hole U1441A was 75.75 h. The acoustic beacon was recovered at 0914 h on 14 September, and the vessel started the slow transit to Site U1442 in dynamic positioning mode while continuing to pull the drill string to the surface.
Table T1. Coring summary, Site U1441. Download table in .csv format. View PDF table.
Sedimentology
Pelagic and volcaniclastic sediments were recovered from the seafloor to 83.00 mbsf, beneath which igneous rock was recovered (see Petrology). Owing to the paucity of calcareous microfossils, the sediment beneath Section 352-U1441A-3R-1, 30 cm, remains poorly dated (see Biostratigraphy). However, the widespread presence of siliceous microfossils in the lower part of the sedimentary succession suggests that the biostratigraphy may be improved after the expedition utilizing radiolarians. The overall core recovery by rotary drilling was 48%.
The sedimentary succession (Figure F3) is divided into five lithologically distinct units, the uppermost of which is further divided into two subunits (Table T2). The volcanic rocks beneath are classified as Unit 1 (see Petrology).
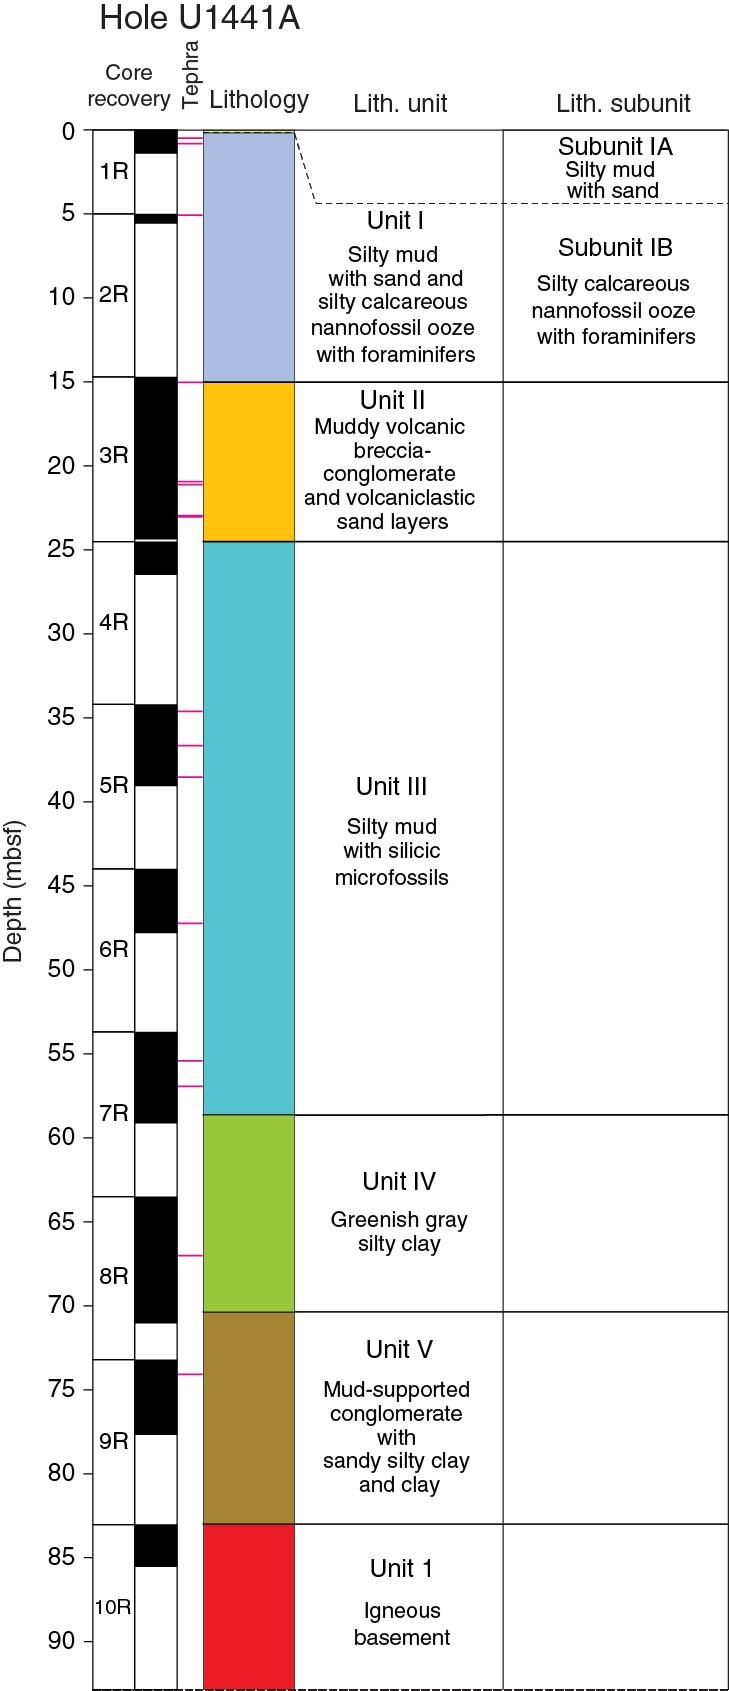
Table T2. Lithologic unit and subunit summary, Site U1441. Download table in .csv format.
The main criteria for the recognition of the lithologic units and subunits are a combination of primary lithology, grain size, color, and diagenesis. Within the overall succession, 16 ash or tuff layers were observed. However, the original number of tuff layers must be considerably greater in view of the limited recovery.
Unit I is divided into two subunits. Subunit IA is recognized by the occurrence of brownish mud with medium to coarse sand. Subunit IB is a relatively nannofossil-rich interval of silty calcareous ooze with nannofossils and sparse planktonic foraminifers.
Unit II is recognized on the basis of a downward change to more clastic-rich sediment composed of muddy volcanic breccia/conglomerate and volcaniclastic sand layers.
Unit III is characterized by a return to finer grained silty mud with relatively abundant radiolarians.
Unit IV is distinguished by a distinct downward change to greenish, relatively fine-grained sediment that is dominated by greenish gray silty clay.
Unit V is a much coarser grained mud-supported conglomerate with sandy and silty clay and also clay.
Unit descriptions
The five lithologic units for the sediment recovered from Hole U1441A are described below (Figure F3). Overall, the sedimentary succession is 83 m thick, with igneous rock beneath (see Petrology).
The succession in Hole U1441A includes discrete layers of volcanic ash, of which 10 are mafic and 6 are felsic in composition (Figures F3, F4). The ash layers were deposited by a combination of gravity fall-out, gravity flow, and/or bottom reworking. The relative abundances of transparent glass and brown glass, and the textures and vesicles of the pyroclasts, vary between the different ash layers. However, rotary drilling is likely to have sampled only a small number of the volcaniclastic layers that were originally deposited.
Unit I
- Interval: 352-U1441A-1R-1, 0 cm, through 3R-1, 30 cm
- Thickness: 14.85 m
- Depth: 0–15.02 mbsf
- Age: early Pleistocene–Holocene
- Lithology: silty mud with sand and silty calcareous nannofossil ooze with foraminifers
Subunit IA: Holocene (0–0.17 mbsf)
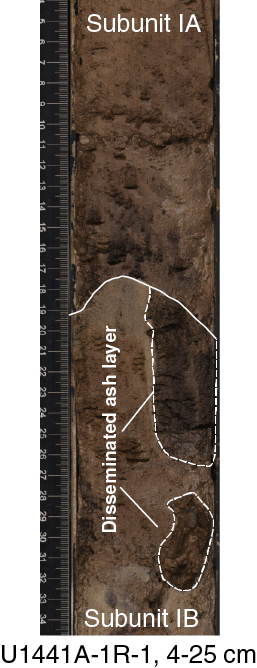
Although very thin (17 cm), Subunit IA can be recognized because it is different in facies from the sediment below (Figure F4). The interval consists entirely of brownish mud with medium- to coarse-grained sand. Calcium carbonate was recorded as 1.5 wt% in Sample 352-U1441A-1R-1A, 7–8 cm (see Sediment and rock geochemistry). Smear slides show that this sediment is mostly silt with common sand and clay-sized material. Transparent volcanic glass is a common component, together with rare brownish glass and traces of volcanically derived lithic grains. Other mineral grains include plagioclase, pyroxene, muscovite, and quartz, in decreasing order of abundance. X-ray diffraction (XRD) revealed common quartz and plagioclase, together with minor amounts of calcite, illite, and chlorite (Table T3). Trace amounts of opaque organic matter and metal oxides are also present in smear slides. The sediment is markedly siliceous, with common radiolarians, diatoms, and siliceous sponge spicules. The siliceous microfossils are excellently preserved; however, planktonic foraminifers appear to be absent.
Table T3. XRD analyses of background muddy sediment, Hole U1441A. Download table in .csv format.
Subunit IB: early Pleistocene (0.17–15.02 mbsf)
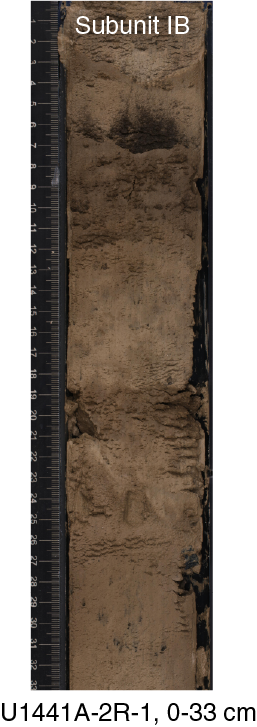
Subunit IB is characterized by very pale brown silty mud with discrete, nearly black ash layers (Figure F5). The sediment is mottled owing to slight bioturbation. White specks were identified as planktonic foraminifers. Smear slides indicate that the sediment is of mixed volcanogenic, calcareous, and siliceous origin. The volcanogenic component is mainly transparent volcanic glass with additional trace to rare amounts of brown glass, plagioclase, pyroxene, and volcanic lithic grains. In several intervals, brown glass exceeds transparent glass. Plagioclase is locally common (e.g., Sample 352-U1441A-3R-1A, 115–116 cm). Quartz is restricted to trace amounts.
The sediment is markedly calcareous, with common calcareous nannofossils and rare to trace amounts of planktonic foraminifers. Early diagenesis is indicated by the presence of trace amounts of secondary zeolite and authigenic carbonate.
The ash layers were probably several centimeters thick prior to drilling disturbance. Two of the ash layers contain predominantly brown glass shards (intervals 1R-1, 19–50 cm; and 2R-1, 6–7 cm). Two additional ash layers (intervals 1R-1, 53–82 cm; and 3R-1, 30–32 cm) are composed of dominantly transparent glass shards. These intervals exhibit slightly more intact internal structures, including normal grading and sharp boundaries at the base of each. Overall, the glass shards of both brownish and transparent type dominantly exhibit dense blocky and cuspate shapes and also common to abundant round vesicles. There are also rare pumiceous clasts with tubular and elongate vesicles.
Unit II
- Interval: 352-U1441A-3R-1, 30 cm, through 3R-CC, 18 cm
- Thickness: 9.48 m
- Depth: 15.02–24.50 mbsf
- Age: Pliocene
- Lithology: muddy volcanic breccia/conglomerate with pumice and volcaniclastic sand layers
Unit II is characterized by the appearance of reddish brown muddy, matrix-supported breccia/conglomerate (Figure F6). Calcium carbonate was recorded as 0.6 wt% in Sample 352-U1441A-3R-4A, 1–2 cm (see Sediment and rock geochemistry). This unit includes angular to rounded volcanic clasts of mostly millimeter size set in a clay-rich matrix. In addition, centimeter-sized, rounded to subangular pumice clasts are randomly distributed throughout the unit. Three discrete ash layers and one fine-grained lapilli layer are intercalated with the background sediment. In smear slides, the matrix of the breccia/conglomerate is sandy and silty with abundant volcaniclastic material in the form of abundant brown volcanic glass, common transparent glass, common lithic grains, common plagioclase, and trace amounts of ferromagnesian minerals. Microfossils are rare to absent. XRD revealed common quartz and plagioclase, together with minor calcite, illite, and chlorite (Table T3).

In the upper part of Unit II (15.02–20.70 mbsf), three volcaniclastic sand layers rich in brownish glass are intercalated with the muddy volcanic breccia/conglomerate. In the lower part of the unit, four tephra layers, apparently of primary air-fall origin, occur within a short interval (20.87–22.99 mbsf). Two of these ash layers (intervals 3R-5, 40–43 cm; and 3R-6, 74–76 cm) mainly consist of brownish blocky to cuspate glass shards that are dense or show rounded vesicle textures. Pumiceous clasts with elongate to tubular vesicles; volcanic lithics (probably tachylitic glass) also rarely occur. One dark gray ash layer (interval 3R-6, 76–79 cm) and the fine lapilli layer (interval 3R-5, 17–24 cm) both contain predominantly dense, transparent glass shards with abundant to dominant blocky and cuspate glass shards. Mineral assemblages are dominated by common plagioclase followed by rare to very rare pyroxene and traces of quartz, in decreasing order of abundance.
Unit III
- Interval: 352-U1441A-4R-1, 0 cm, through 7R-4, 44 cm
- Thickness: 34.14 m
- Depth: 24.50–58.64 mbsf
- Age: late Miocene
- Lithology: silty mud with silicic microfossils
Unit III, recovered in Cores 352-U1441A-4R through 7R, is characterized by a decrease in both grain size and abundance of pumice clasts (especially in Core 7R). In general, the unit is weakly calcareous silty mud with diatoms, radiolarians, and sponge spicules and scattered centimeter-sized pumice clasts (Figure F7). Colors range from olive-gray to pinkish gray. Calcium carbonate values were recorded as ranging from 0.3 to 4.5 wt% in four samples (see Sediment and rock geochemistry). Three very dark brown ash layers are present in intervals 5R-1, 35–40 cm; 5R-2, 85–94 cm; and 5R-4, 28–30 cm. These ash layers are typically smeared out as a result of drilling disturbance. Different parts of probably the same several centimeter–thick, graded ash layers were identified tens of centimeters apart. An additional thin, graded brown ash layer is present in interval 7R-3, 20–22 cm, whereas a several centimeter–thick, whitish, more lithified tuff layer is present in interval 7R-2, 18–22 cm.
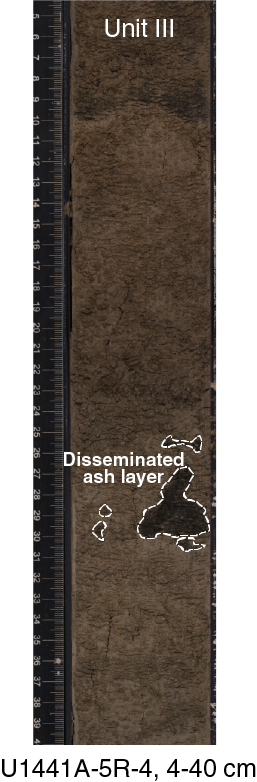
Smear slides confirm that the dominant sediment type of Unit III is siliceous clay with common well-preserved radiolarians and rare siliceous sponge spicules (e.g., Samples 5R-4, 29–30 cm; 6R-1, 39–40 cm; 5R-1, 2–3 cm; and 6R-3, 21–22 cm). Volcanic glass, of both brown and transparent type, is present in variable but subordinate amounts. In specific intervals (e.g., 4R-2, 51–52 cm), sediment is only weakly calcareous, whereas in others (e.g., Section 5R-1) nannofossils are abundant, explaining the relatively high calcium carbonate levels (e.g., Sample 5R-2, 27–28 cm). Siliceous microfossils are common within the calcareous sediment. Volcanic glass varies from rare (e.g., Sample 5R-1, 2–3 cm) to abundant (Sample 5R-4, 38–39 cm) within the calcareous sediment. Glass-rich samples invariably contain plagioclase, which is locally abundant (interval 5R-2, 92–103 cm). Zeolite is sporadically observed.
XRD revealed quartz and plagioclase together with minor muscovite and chlorite and, rarely, calcite (Table T3).
Five thin, centimeter-thick, mineral-rich ash layers are present throughout Unit III. These are dominated by brown glass with common feldspar and trace amounts of pyroxene. Dense, blocky, and cuspate glass shards are the main pyroclasts and often include round to elliptical vesicles. Pumiceous clasts, which are rich in tabular and elongate vesicles, are rare to very rare in abundance. The tuff layer in interval 7R-2, 18–22 cm, is exclusively composed of transparent pyroclasts. These pyroclasts are predominantly dense, cuspate glass shards with only rare amounts of plagioclase and traces amounts of pyroxene and quartz. Pumiceous pyroclasts, where present, contain round vesicles. In addition, tubular and elongate vesicles are very rare to absent. Iron oxides, volcanic lithic grains, or tachylitic pyroclasts are present in small very rare amounts in the ash samples. Some of the ash layers contain rare siliceous biota (radiolarians, sponge spicules, and diatoms) and trace amounts of calcareous nannofossils.
Unit IV
- Interval: 352-U1441A-7R-4, 44 cm, through 8R-5, 88 cm
- Thickness: 11.74 m
- Depth: 58.64–70.38 mbsf
- Age: late Oligocene–early Miocene
- Lithology: silty clay
The top of Unit IV is characterized by an abrupt change to a greenish color, together with a slight decrease in the average grain size such that silty clay predominates (Figure F8). Calcium carbonate was measured as 0.5 wt% in one sample (352-U1441A-8R-3, 68–69 cm). Pumice fragments in Section 7R-4 are absent but reappear in Core 8R, where they are up to 2 cm in size. A thin, fine-grained ash layer is present in interval 8R-2, 48–50 cm. Within Section 8R-3, downhole to the base of this core, the color changes subtly to slightly more grayish. Bioturbation and core disturbance are weakly developed.
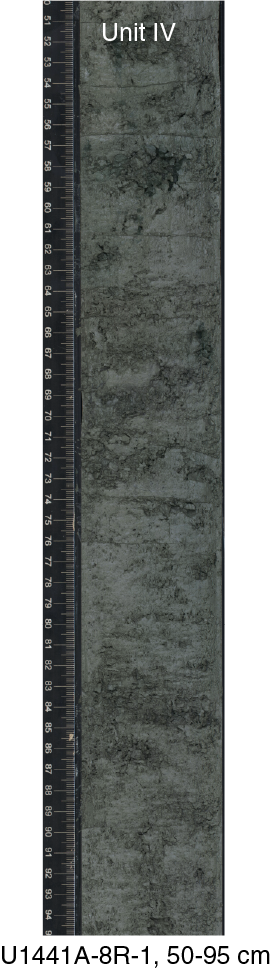
In smear slides, clay dominates, together with common silt-sized volcanic glass, both as transparent and brown varieties. Radiolarians and sponge spicules are common, whereas calcareous nannofossils are effectively absent. Silt-sized, mostly transparent volcanic glass is common, together with plagioclase, whereas brown glass is less abundant. XRD indicates the presence of quartz and plagioclase in the background sediment, together with subordinate muscovite and chlorite (Table T3).
Unit V
- Interval: 352-U1441A-8R-5, 88 cm, through 9R-CC, 113 cm
- Thickness: 12.62 m
- Depth: 70.38–83.00 mbsf
- Age: late Oligocene
- Lithology: mud-supported conglomerate with sandy silty clay and clay
Lithologic Unit V is mostly pale brown silty gravel (fine conglomerate) that is poorly sorted and dispersed throughout silty clay (Figure F9). The sediment is consolidated but unlithified. Moderate bioturbation is observed. The sediment does not react to dilute HCl, indicating that it is virtually noncalcareous. Calcium carbonate was measured as 1.2 wt% in one sample (352-U1441A-9R-3, 24–25 cm). Pale pumice grains are scattered throughout much of the unit. In the lower part of Core 8R, the sediment becomes finer grained and more clay and silt rich, but the color remains unchanged.

Pale-colored, nonvesicular pumice is common in the middle part of Section 8R-3. The lowermost dark interval of this section and the core catcher beneath include pumice clasts. There is also a subrounded pebble of altered, fine-grained volcanic material (hyaloclastite?), which is coated with black manganese oxide (several millimeters thick).
In Core 9R, the color changes to pinkish. However, texturally and compositionally, the sediment remains gravel. In addition, an angular clast of altered, fine-grained mafic extrusive rock is present in Section 9R-CC.
In smear slides, the fine-grained sediment is silty clay with accessory transparent glass and plagioclase, together with trace amounts of radiolarians. More commonly, the sediment is mostly silty with relatively abundant brown volcanic glass and plagioclase (Sample 9R-3, 73–74 cm). In places the silt is rich in volcanic lithic grains, together with glass fragments. XRD indicates quartz and plagioclase within the background sediment, together with subordinate muscovite and chlorite (Table T3). An additional sample from within several centimeters of the igneous basement revealed quartz and plagioclase, together with muscovite, montmorillonite, and a zeolite.
A disseminated ash layer is present in interval 9R-1, 87–90 cm, which is predominantly brownish glass plus some volcanic and sedimentary lithic fragments. The pyroclasts present are mainly dense and blocky, with some round vesicles, whereas others have a tachylitic texture. Plagioclase is again the dominant mineral, accompanied by common zeolite, rare palagonite, and trace amounts of pyroxene. This ash layer also contains sparse radiolarians and sponge spicules.
Biostratigraphy
The microfossil contents of core catcher samples from Hole U1441A were examined and described for preliminary biostratigraphic constraints. Biostratigraphy was based solely on calcareous nannofossils.
Calcareous nannofossils are present in 3 of the 10 core catcher samples examined. Samples 352-U1441A-1R-CC and 2R-CC are nannofossil oozes, whereas siliceous fossils dominate Sample 5R-CC, with the calcareous nannofossil assemblage consisting almost entirely of discoasters. Preservation is moderate to good in each sample.
Sample 1R-CC contains nannofossils of approximately Late Pleistocene age and may be placed in Subzone CN14a (0.44–1.04 Ma) based on the occurrence of Pseudoemiliania lacunosa and Gephyrocapsa oceanica and the absence of Emiliania huxleyi (Table T4).
Table T4. Calcareous nannofossils, Hole U1441A. Download table in .csv format.
Sample 2R-CC contains nannofossils of approximately early Pleistocene age and may be placed at the Zone NN19/NN18 boundary (~1.93 Ma) based on the first (downhole) occurrence of Discoaster brouweri.
Sample 5R-CC contains nannofossils that are approximately late Miocene in age and may be placed in Zone NN11 (5.59–8.29 Ma) based on the occurrences of Discoaster quinqueramus and Discoaster berggrenii together. The occurrence of these species together suggests that the top of this range is actually older than that stated, as D. berggrenii has its first (downhole) occurrence at an older age than the top of Zone NN11, which is coincident with the first (downhole) occurrence of D. quinqueramus.
Figure F10 shows a comparison of sedimentary units with calcareous nannofossil biozonations providing approximate ages for each unit.

Fluid geochemistry
Ten samples were collected in Hole U1441A for headspace hydrocarbon gas analysis as part of the standard shipboard safety monitoring procedure: 1 sample per core was collected from Cores 352-U1441A-1R through 10R. Headspace gas was collected and analyzed following the protocol described in Fluid geochemistry in the Expedition 352 methods chapter (Reagan et al., 2015).
The concentrations of methane, ethane, and propane in the 10 headspace gas samples are reported in Table T5. Methane concentrations range from 1.08 to 1.29 ppmv in Hole U1441A. These values are substantially lower than those at Sites U1439 (2.49–12.44 ppmv in Hole U1439A) and U1440 (1.85–5.84 ppmv in Hole U1440A). The relatively low and uniform methane concentrations measured in Hole U1441A may be attributed to a dearth of organic matter in general. Similar to Holes U1439A and U1440A, no ethane or propane was detected in Hole U1441A.
Table T5. Headspace gas concentrations (methane, ethane, and propane), Hole U1441A. Download table in .csv format.
Petrology
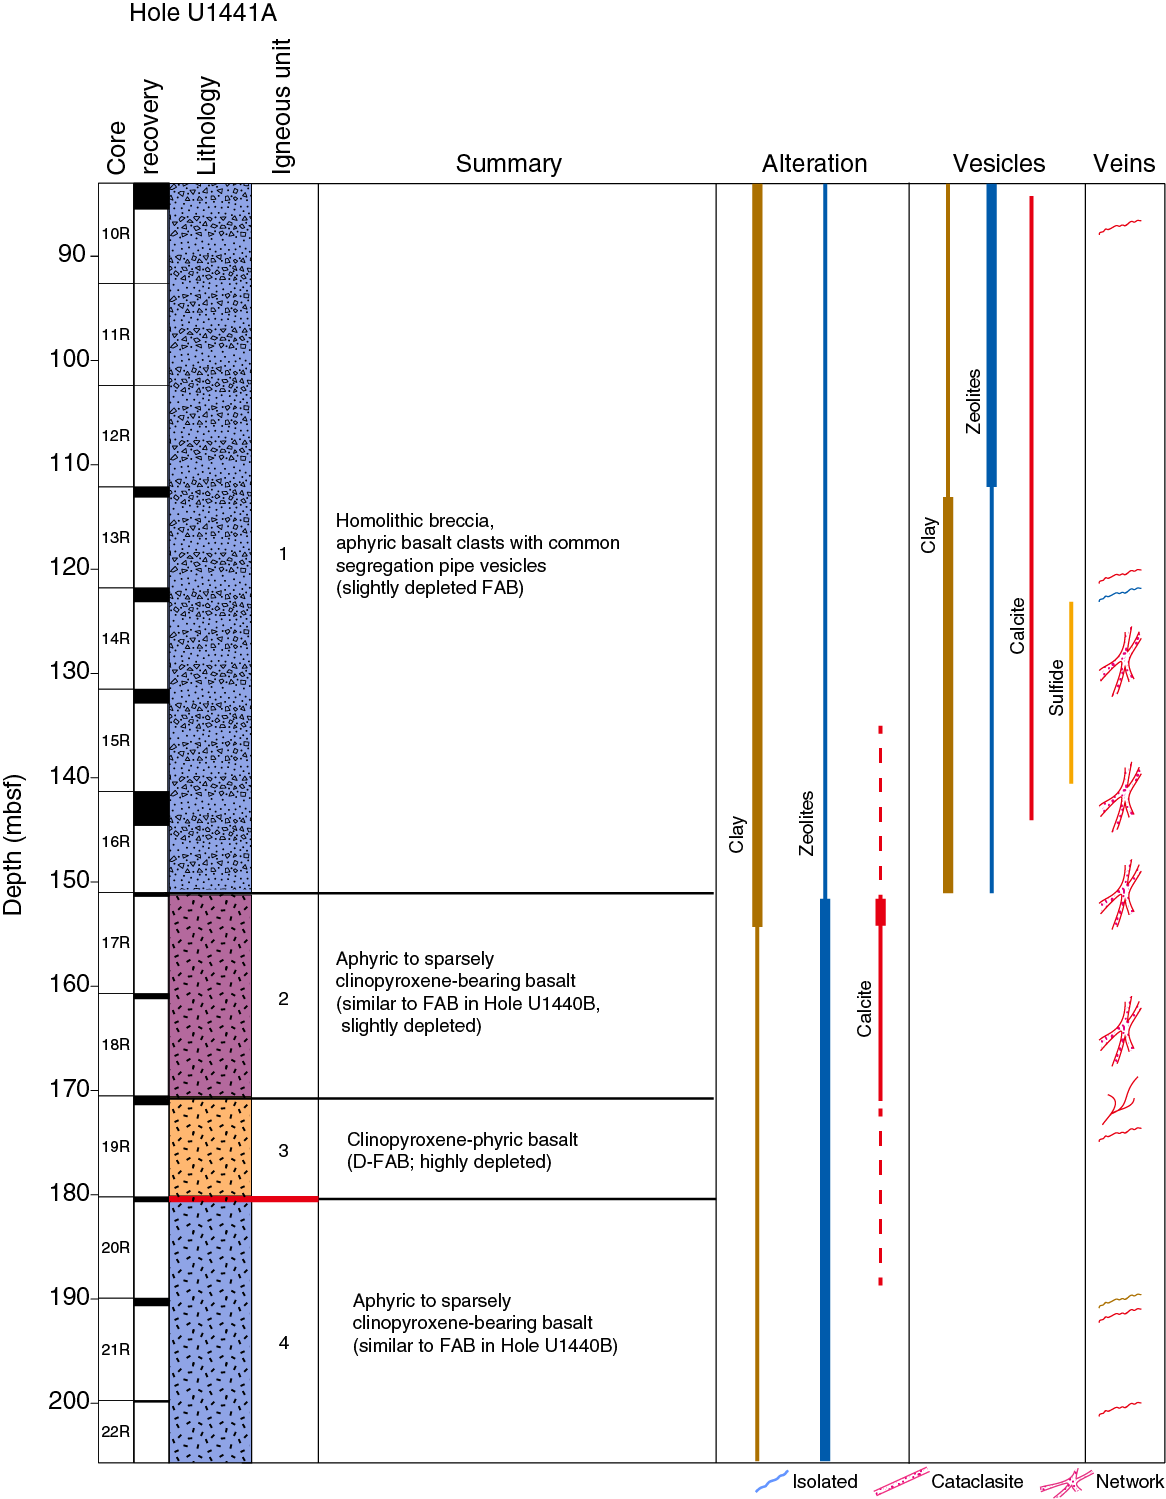
One hole was drilled at Site U1441. Core 352-U1441A-10R through 21R penetrated 116.7 m into basement and recovered 10.8 m of core. Four units are recognized (Figure F11).
Petrologic and geochemical classification
All of the igneous rocks at Site U1441 are FAB similar to those cored at Site U1440. They are dominated by modal plagioclase and clinopyroxene in the groundmass, and most are aphyric. Microphenocrysts of plagioclase are rare, except in Unit 3, which also contains 2%–3% phenocrysts of clinopyroxene and olivine. Three varieties of igneous rocks are noted chemically. The basalts of Units 1 and 2 are FAB with low TiO2, Zr, and Ti/Zr compared to those from Site U1440. The underlying basalts of Unit 4 are FAB and very close in chemical composition to those at Site U1440. In contrast, the lavas of Unit 3 are predominantly basalts containing the most depleted concentrations of incompatible trace elements ever found, interpreted here as depleted FAB (D-FAB). With the exception of Unit 3, TiO2, Zr, and Cr all show subtle increases downhole (Figure F12). Figure F13 depicts macroscopic textures of note, and Figure F14 documents microscopic textures. Alteration features are highlighted in Figures F15 and F16.
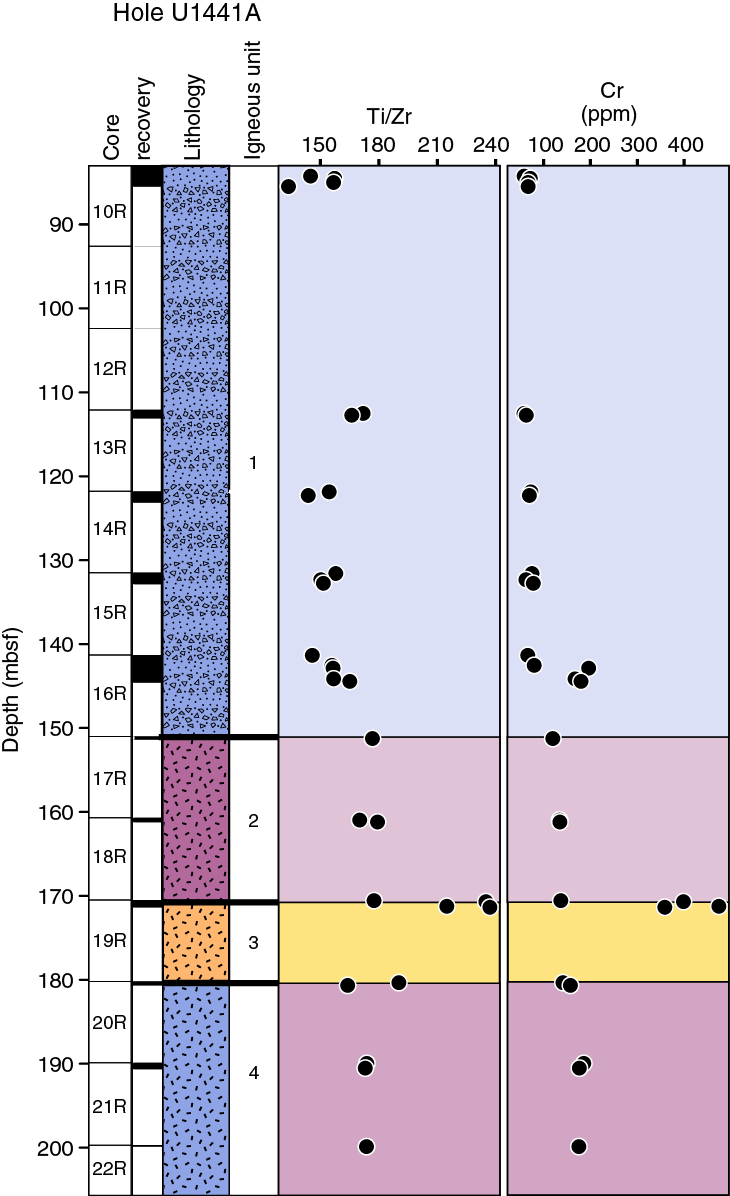
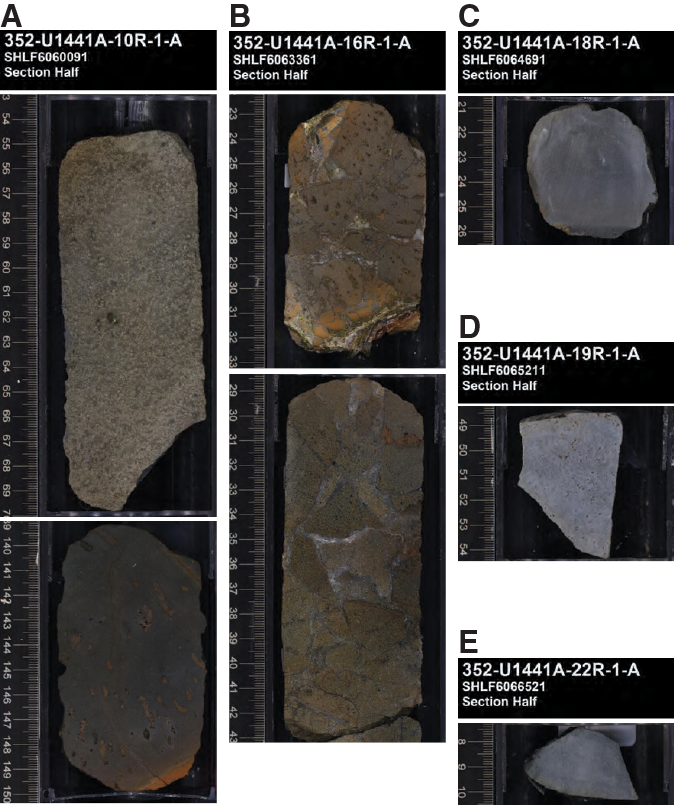
Figure F13. Macroscopic features. A. Massive, diktytaxitic, and fine grained (upper); microcrystalline with splayed pipe vesicles (lower). B. Homolithic breccia with subrounded to subangular basaltic clasts cemented by sandy matrix. C. Aphyric microcrystalline basalt with glassy chilled margin. D. Augite phenocrysts in aphanitic groundmass. E. Light gray aphyric basalt.
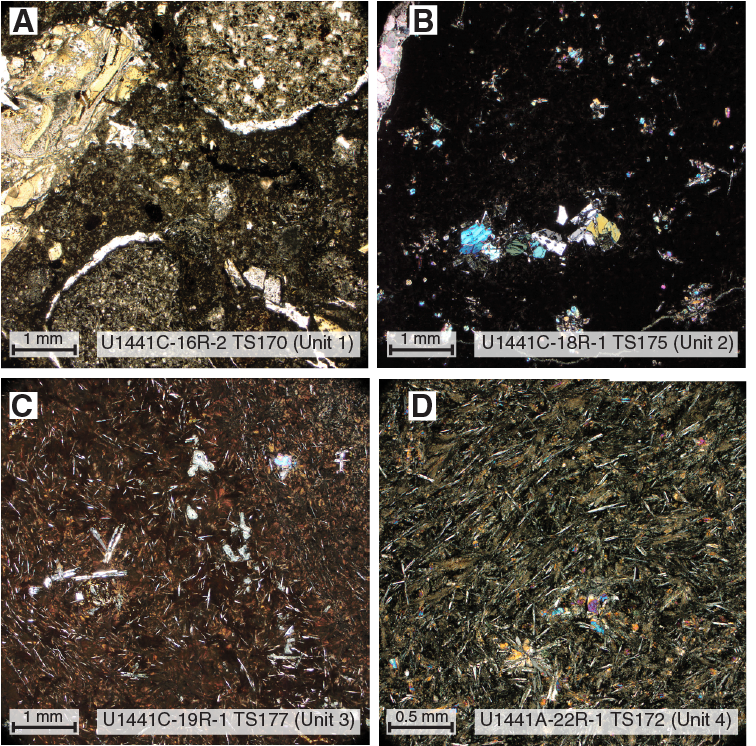
Figure F14. Microscopic features. A. Homolithic breccia with hypohyaline clasts in volcanic sandy matrix with crystal fragments. B. Augite phenocrysts in glassy matrix. C. Vitrophyric basalt with partial layering: trachytic plagioclase microlites and coarser plagioclase phyric-rich, randomly orientated domains. D. Intersertal to intergranular trachytic basalt.
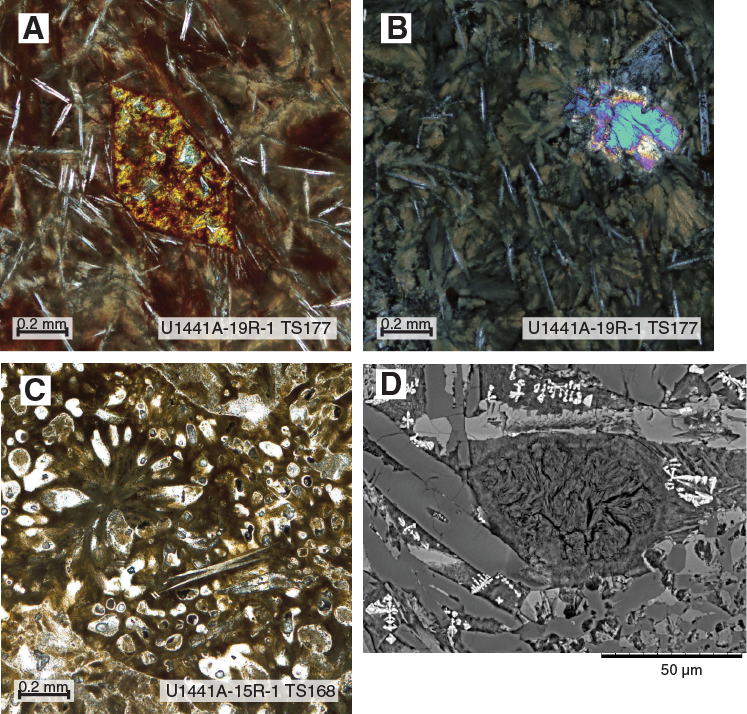
Figure F15. Alteration features. A. Olivine completely altered to smectite and calcite. B. Groundmass completely altered to zeolite fiber and tiny iron oxides. C. Groundmass altered to zeolite with numerous clay-filled vesicles. D. Zeolite filled vesicle with quenched oxide in relatively fresh groundmass.

Igneous rock lithostratigraphy
Unit 1
- Interval (top): 352-U1441A-10R-1, 0 cm
- Depth: 83.0–151.0 mbsf
- Thickness: 68.00 m thick (8.20 m recovered)
- Rock type: aphyric basalt
- Deposit: homolithic breccia
Unit 1 is a homolithic breccia deposit composed of angular to subrounded volcanic clasts in a matrix of coarse volcanic sand (Figures F13A, F13B, F14A). All of the lava clasts appear to be from the same flow or source. The largest clasts (≤12–15 cm in size parallel to core barrel) are found near the top of the deposit. These clasts are coarser grained than the volcanic clasts found deeper in the deposit and can be distinguished by diktytaxitic textures and rare pipe vesicles.
Fine-grained to aphanitic volcanic clasts dominate deeper in the section. These clasts commonly retain portions of their chilled or glassy margins, demonstrating that they were derived from a pillow lava flow (Figure F13B). They are also characterized by segregation-pipe vesicles up to 4 cm long and 3–4 mm wide (Figure F13A, lower panel). The segregation vesicles are filled with a frothy glass that also rims the inside of the host vesicle. They are interpreted to form by continued outgassing of the late-stage intratelluric melt from the crystalline portion of the rock.
Pipe vesicles may splay over a few degrees in their orientation within an individual fragment but in general give an indication of the “up” direction. In Hole U1441A cores, pipe vesicle orientations within individual clasts are subparallel, but their orientations vary widely between pieces, indicating that these are clasts and not pieces from an intact lava flow (Figure F13A). This is consistent with the recovery of well-cemented breccia in Cores 14R through 16R, which contains clasts of volcanic rock characterized by common pipe vesicles.
Volcanic blocks in Unit 1 are characterized by low TiO2 (0.65–0.70 wt%) and Cr (<100 ppm) and by Ti/Zr (150–170) ratios typical of Site U1440 FAB.
Unit 2
- Interval (top): 352-U1441A-17R-1, 0 cm
- Depth: 151.00–170.60 mbsf
- Thickness: 19.6 m thick (0.86 m recovered)
- Rock type: aphyric to sparsely clinopyroxene-phyric basalt
- Deposit: basaltic pillow lava flow
Unit 2 comprises a light gray, aphyric to sparsely clinopyroxene-bearing basalt with up to 1% augite microphenocrysts in an aphanitic groundmass (cryptocrystalline to microcrystalline) (Figure F14B). One piece (Section 18R-1 [Piece 6]) has a chilled margin and coating of unaltered glass, suggesting that this unit may be pillow lava (Figure F13C). Unit 2 is characterized by compositions similar to those of basalts at Site U1440, but slightly more depleted, with ~0.8 wt% TiO2, ~130 ppm Cr, and Ti/Zr ratios of ~150–170.
Unit 3
- Interval (top): 352-U1441A-19R-1, 7.0 cm
- Depth: 170.60–180.25 mbsf
- Thickness: 9.68 m (0.7 m recovered)
- Rock type: clinopyroxene-plagioclase-phyric basalt (D-FAB)
- Deposit: basalt lava flow
Unit 3 (Section 19R-1 [Pieces 2–18]) consists of light gray aphanitic basalt with 2%–3% clinopyroxene + rare altered olivine and plagioclase phenocrysts that are 1–2 mm in size (Figures F13D, F14C). Rare chromite microphenocrysts also are present. Unit 3 is the most depleted basalt composition recovered during this expedition and is characterized by low TiO2 (~0.4 wt%) and extremely low Zr (~11–12 ppm), high Cr (350–480 ppm), and Ti/Zr ratios of ~220–240. The lowermost piece of Unit 3 does not have D-FAB chemistry and instead more closely resembles Units 2 and 4. However, it overlies a single lozenge-shaped semiconsolidated rock 12 cm in length that is interpreted to represent a semiductile to semibrittle shear zone (see Structural geology). It should be noted that recovery is very low (4% in Core 20R), and thus the vertical extent of the shear zone is unknown and, given the nature of the recovered piece, much of it may have been washed away during drilling.
Unit 4
- Interval (top): 352-U1441A-20R-1, 5 cm
- Depth: 182.25–205.70 mbsf
- Thickness: 25.45 m (1.19 m recovered)
- Rock type: aphyric to sparsely clinopyroxene-bearing basalt
- Deposit: basaltic massive lava flow
Unit 4 is a light gray, aphyric to sparsely microphenocrystic basalt with up to 1% augite microphenocrysts in a plagioclase-dominated groundmass (Figure F13E). The groundmass is generally intersertal to intergranular, though it can be locally trachytic (Figure F14D). Unit 4 is characterized by compositions very similar to basalts at Site U1440, with ~1.0 wt%, TiO2, ~150 ppm Cr, and Ti/Zr ratios of ~160–190.
Alteration
Alteration in Hole U1441A ranges from moderate to highly altered and tends to decrease downhole. The secondary assemblage consists of smectite group clays and zeolites (phillipsite, merlinoite, chabazite, and analcime), with minor calcite (Figures F14, F15). Clay minerals are dominant in the top half of the hole and downhole to Core 352-U1441A-16R. In the lower half of the hole, zeolite becomes the most abundant alteration mineral in the groundmass (Figure F15C) as an alteration product of plagioclase, whereas altered clinopyroxene and rare olivine consists mostly of clays (Figure F15A). A calcite overprint, replacing zeolite and clays in addition to primary igneous minerals, appears in a short interval covering most of Core 17R. The observed alteration assemblage matches vesicle-filling minerals. These include clays and zeolites with minor sulfides including pyrite and chalcocite. There is also a calcite overprint from the top of the hole to Core 17R (Figures F14, F15C). Below that, the size and abundance of vesicles strongly decreases.
Veins and halos
In Hole U1441A, veins are abundant from Core 14R through 18R. In this interval, a relatively dense network of calcite veins is present (Figure F16A). Outside of this interval, isolated zeolite and clay, or calcite, veins are sporadically present. Calcite crystallized late within the veins and may replace zeolite or clay to a certain degree. However, reopening of cracks with injection of calcite next to clay and zeolite in the center of the veins is more commonly observed (Figure F16C). Euhedral zeolite (analcime) included within large calcite grains is frequent in veins and vesicles of the vein-rich interval (Cores 14R through 18R; Figure F16C).
Discussion
The basalts at Site U1441 are texturally and chemically similar to FAB recovered during previous diving expeditions in the region (e.g., Reagan et al., 2010). They are largely aphyric with rare phenocrysts of clinopyroxene. One unit contains rare olivine and plagioclase phenocrysts in addition to clinopyroxene. Not surprisingly, this is the unit with the highest CaO content (Unit 3). Chemically, all of the rocks recovered here are similar to FAB, although they represent a wide range in composition. One unit (Unit 4) is very close to Site U1440 FAB in composition. Two other units (Units 1 and 2) are also FAB, but have lower concentrations of incompatible elements. Finally, Unit 3 contains the most depleted FAB found, having low TiO2 (0.4 wt%), similar to boninites, but extremely depleted in Zr, resulting in ultra-high Ti/Zr ratios. We termed these samples D-FAB to highlight their distinctive compositions.
Sediment and rock geochemistry
Eight sediment samples were collected from Hole U1441A (one per core from Cores 352-U1441A-1R through 9R; no samples were available from Core 2R). These sediment samples were analyzed for carbonate contents following the protocol described in Sediment and rock geochemistry in the Expedition 352 methods chapter (Reagan et al., 2015). The percentage of inorganic carbon and carbonate contents of the sediment are reported in Table T6.
Table T6. Inorganic carbon and carbonate contents of sediment, Hole U1441A. Download table in .csv format.
Seven samples collected in Sections 352-U1441A-10R-1 through 22R-1 were selected as representative of the different lithologic units recovered from Hole U1441A (see Petrology). All samples were taken next to thin sections (see Petrology for thin section petrographic description). The seven igneous rocks were analyzed for major and trace element concentrations by ICP-AES and for H2O and CO2 contents for any samples with LOI > 2%. An aliquot of the oxidized powders used for ICP-AES analyses were subsequently used for X-ray fluorescence analyses, which were carried out with a Niton handheld portable XRF (pXRF). The analytical procedures, precision, and accuracy of these methods are described in detail in Sediment and rock geochemistry in the Expedition 352 methods chapter (Reagan et al., 2015). The chemical compositions of igneous rocks are reported in Tables T7 and T8.
Table T7. ICP-AES major, trace, and volatile element contents of igneous rocks, Hole U1441A. Download table in .csv format.
Table T8. pXRF major and trace element contents of igneous samples, Hole U1441A. Download table in .csv format.
The pXRF instrument was used as a tool for the chemostratigraphic analysis of the igneous rocks cored in Hole U1441A. The rock surfaces of 31 archive-half pieces were analyzed for Ti, Ca, K, Rb, Sr, Zn, Cu, Cr, and Zr. The results are reported in PXRF in Supplementary material and discussed in Petrology.
Sediments
Sediments from Site U1441 have inorganic carbon contents ranging from 0.033 to 0.54 wt%, which mainly reflect variable, but relatively low, carbonate contents. Carbonate contents range from 0.28 to 4.5 wt% (Table T6).
Igneous rocks
The igneous rocks recovered from Hole U1441A comprise mainly volcanic breccias in the upper part of the hole to ~150 mbsf (Unit 1; see Petrology), with some large clasts in Core 352-U1441A-10R that were sampled for geochemical analyses. In the lower part of the hole (downhole to ~200 mbsf), clinopyroxene-phyric volcanic rocks were recovered (Units 2–4; see Petrology). No samples were selected for bulk rock analyses in the lower part of Unit 1 (from Core 10R to 17R) because of low recovery and small-scale petrographic heterogeneities of the recovered rocks.
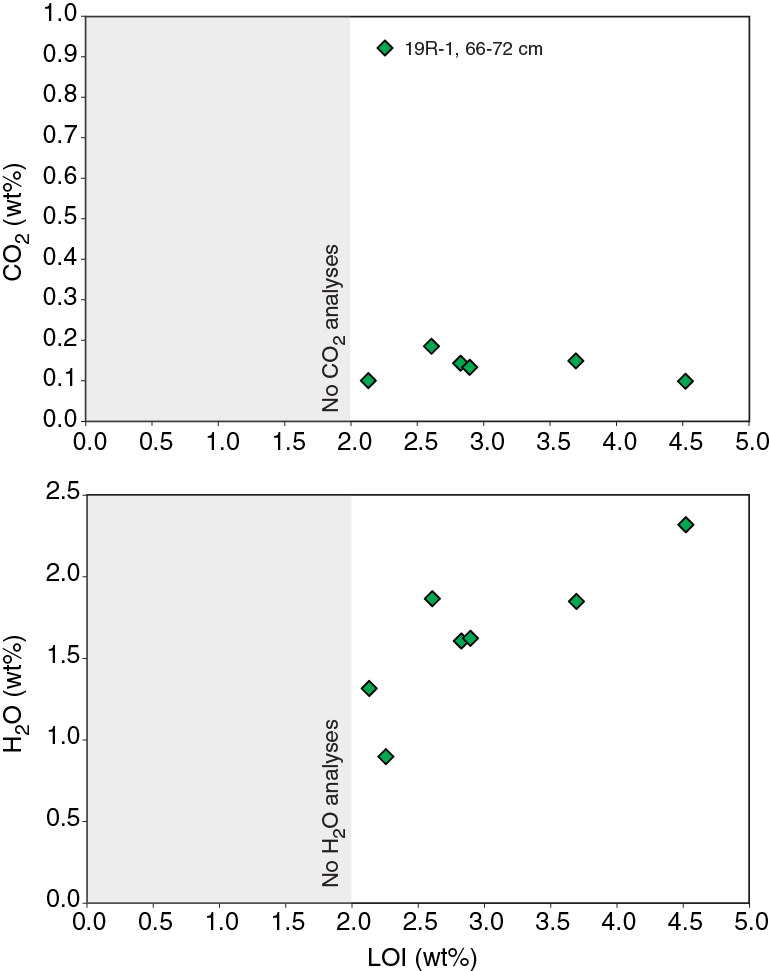
The highest LOI values (3.7–4.5 wt%) in Hole U1441A volcanic rocks are in the large clasts recovered in Core 10R at the top of Unit 1. In the lower Units 2–4, LOI ranges from 2.1–2.9 wt%. Hole U1441A volcanic rocks have low H2O contents (0.9–2.3 wt%) that correlate well with LOI (Figure F17). They have overall low CO2 contents (<0.18 wt%), with the exception of Sample 19R-1, 66–72 cm, which was from Unit 3, where carbonate alteration was identified (see Alteration), and has 0.90 wt% CO2.
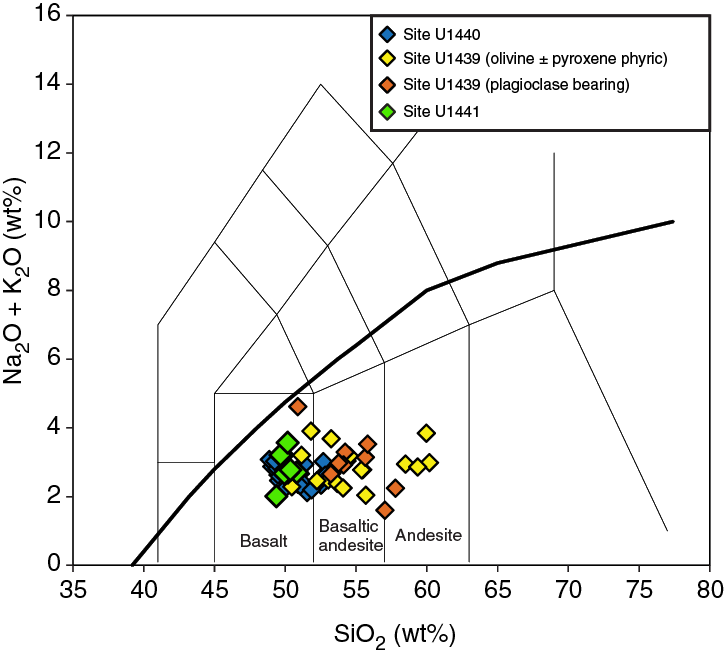
The igneous rocks recovered from Hole U1441A are all basalts according to the total alkali-silica classification (Le Bas et al., 1986; Figure F18) and have low total alkali contents (Na2O + K2O = 2.0–3.6 wt%) with a very narrow range in SiO2 (49.4–50.8 wt%; Figures F18, F19). Overall, the major element composition of Site U1441 basalts is relatively homogeneous, with 6.4–8.4 wt% MgO, 10.7–11.6 wt% CaO, and 10.8–12 wt% Fe2O3. Site U1441 basalts mainly plot in the compositional field of MORB and are very similar in composition to both Site U1440 basalts and to Izu-Bonin fore-arc basalts previously recovered by diving (Reagan et al., 2010; Ishizuka et al., 2011) (Figures F19, F20). Sample 352-U1441A-19R-1, 66–72 cm, recovered in Unit 3, is distinguished by a more primitive composition, with higher MgO (9.0 wt%) and lower Fe2O3 (9.8 wt%) contents and therefore higher Mg# (cationic Mg/[Mg + Fe] = 65 compared to 54–59) as compared to other basalts recovered from Hole U1441A.
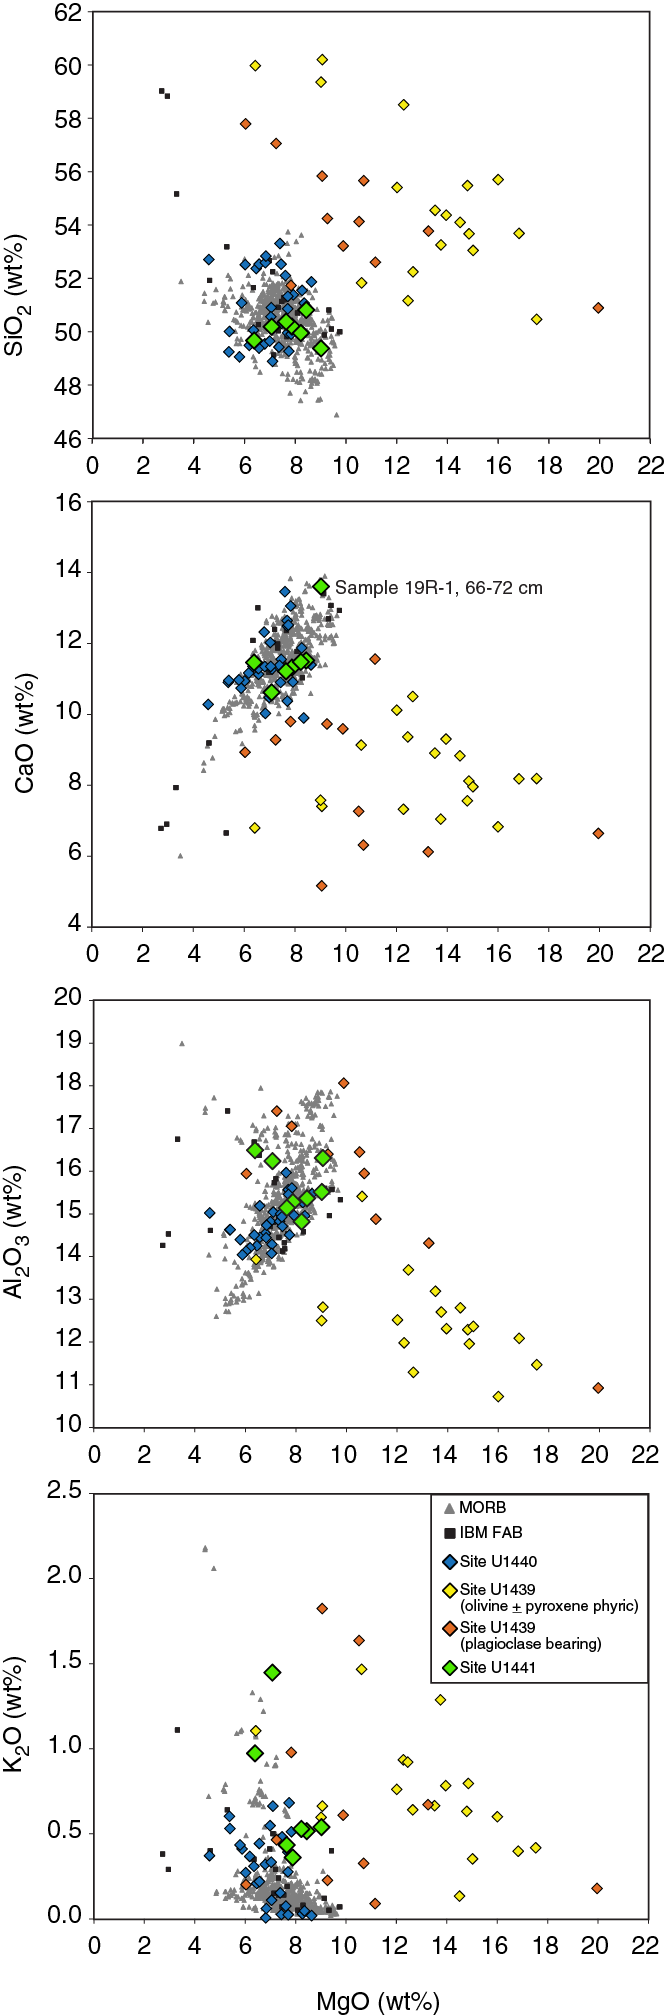

The trace element abundances of Site U1441 basalts also overlap those of IBM fore-arc basalts (Figures F20, F21). They have relatively low Ni (10–100 ppm) and Cr (50–210 ppm) contents, except for Sample 19R-1, 66–72 cm, which has higher Cr and Ni (639 and 156 ppm, respectively). They are depleted in many incompatible elements, especially Zr (11–37 ppm) and Sr (28–71 ppm), but also TiO2 (0.5–1.05 wt%) and Y (16–30 ppm), with Sample 19R-1, 66–72 cm, marking the most depleted end-member of the FAB series recovered at Sites U1440 and U1441. These compositions suggest that they were formed by high degrees of partial melting and/or from a depleted mantle source. Sample 19R-1, 66–72 cm, overlaps the boninitic series recovered at Site U1439 in terms of TiO2, V, and Y contents and appears intermediate between FAB and boninite (Ti/V = 10; Figure F21). However, the FAB series recovered at Sites U1440 and U1441 and, in particular, Sample 19R-1, 66–72 cm, have significantly lower Zr (as low as 11 ppm) and higher CaO (as high as 13.7 wt%) than boninites from Site U1439 with similar TiO2 concentrations. This indicates (1) a different melting process, (2) a more refractory mantle source, and (3) a different subduction component for the boninitic magma series compared to the FAB magma series sampled during Expedition 352.

Structural geology
Sedimentary structures
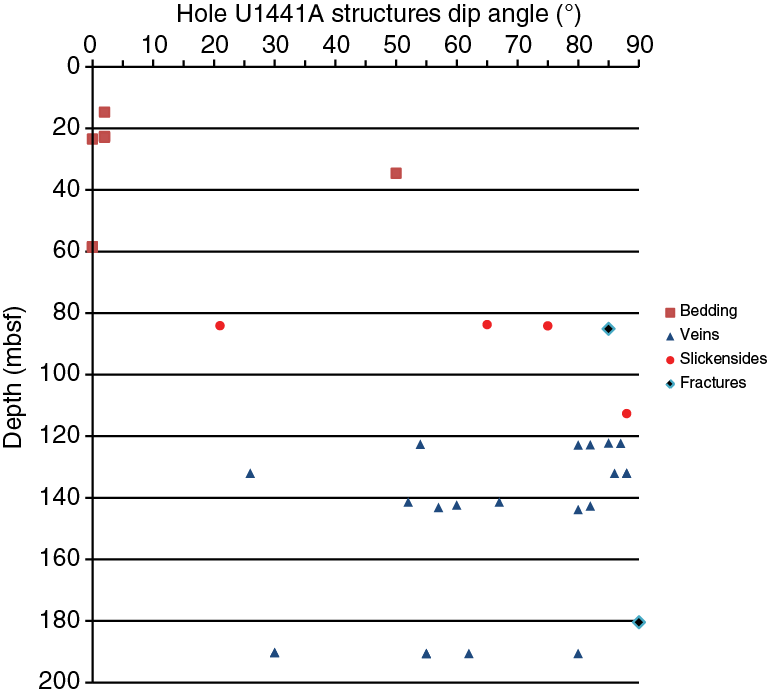
Variations in lithologic composition, color, and/or grain size mark the bedding planes in the sedimentary units of Hole U1441A. The best markers of bedding are a few dark pyroclastic beds and thin sandy beds that are a few millimeters to centimeters in thickness and conformable with the local bedding planes. Six bedding planes were measured in Hole U1441A between ~15 and 59 mbsf in intervals where drilling-induced deformation was relatively moderate. The bedding planes are generally subhorizontal; dip angles do not exceed 10° (Figure F22).
Magmatic structures
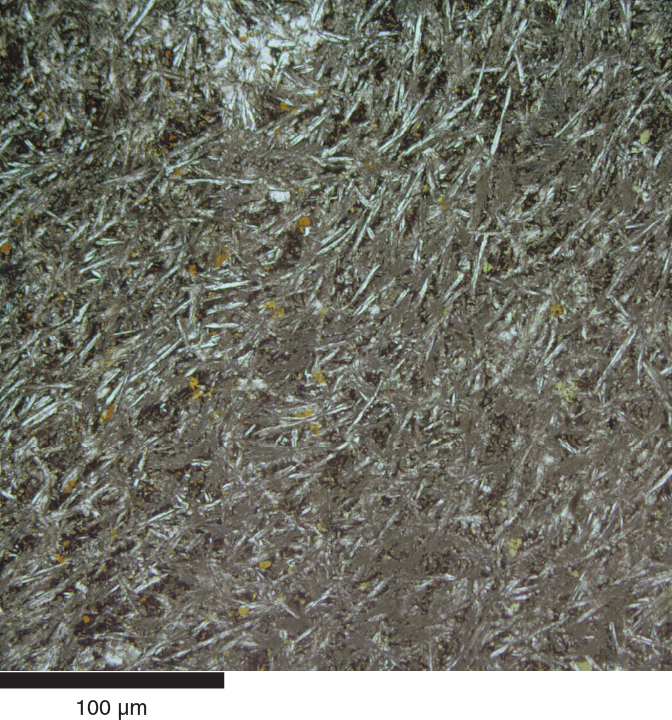
In general, the magmatic macroscopic fabric of the igneous rocks of Hole U1441A is isotropic. Basalts usually have spherical vesicles although, between 84.44 and 122.87 mbsf, vesicles are elongate and display shape-preferred orientation (SPO). Viscous-plastic fabrics related to magmatic flow are rare and limited to millimeter- to centimeter-wide domains, defined primarily at the microscopic scale. These domains are relatively common in the lower parts of Hole U1441A (e.g., in Samples 352-U1441A-19R-1; TS177, and 22R-1; TS172). The foliation is mainly defined by the SPO of acicular feldspar grains that are embedded within a glassy or microcrystalline matrix (Figure F23; Sample 22R-1W, 8–11 cm; TS172).
Tectonic structures
Extensional fractures without mineral fillings are subvertical and were observed at 85.15 and 180.45 mbsf (Figure F22). Alteration seams rim some of these fractures. Neither slickensides nor slickenlines were observed along these fractures.
Subvertical to inclined, whitish, crystalline millimeter-thick veins are abundant between 122.22 and 141.43 mbsf and between 190.2 and 190.6 mbsf. In the lower interval, the veins form steeply inclined conjugate sets at an angle of ~35° (Figure F24; interval 352-U1441A-21R-1W, 57–72 cm). The virtual plane bisecting the acute angle between the two sets is subvertical. The vein-filling material consists of magnesian calcite and/or zeolite and/or chlorite. The mineralogical composition of the vein material was determined by petrographic examination of thin sections.

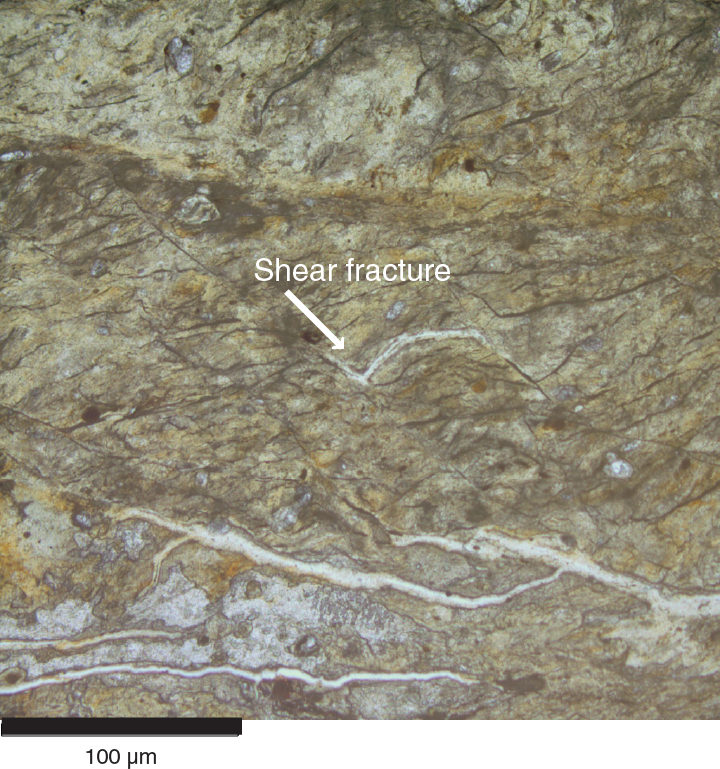
Slickensides are abundant between 84 and 88.25 mbsf and dip steeply to subvertically (Figure F22). The general sense of shear is left-lateral strike-slip to oblique reverse-slip including a left-lateral component. One subhorizontal slickenside shows a normal sense of shear. In the lowermost sections of Hole U1441A (interval 20R-1, 15–27 cm), a semiductile to brittle, low-angle shear zone was observed within highly altered domains. The shear zone was recovered as a single piece of lozenge shape, without preserved contact to the wall rock. Its position within the lithostratigraphic sequence cannot be defined exactly due to the poor core recovery. The recovered basalt pieces below and above do not show any indication of comparable alteration or deformation. Within the shear zone, shear bands form subparallel sets, indicating top-down sense of shear. These shear bands are crosscut by subparallel sets of inclined shear fractures, which are also characterized by normal displacement (Figure F25; Sample 20R-1, 22–24 cm; TS179).
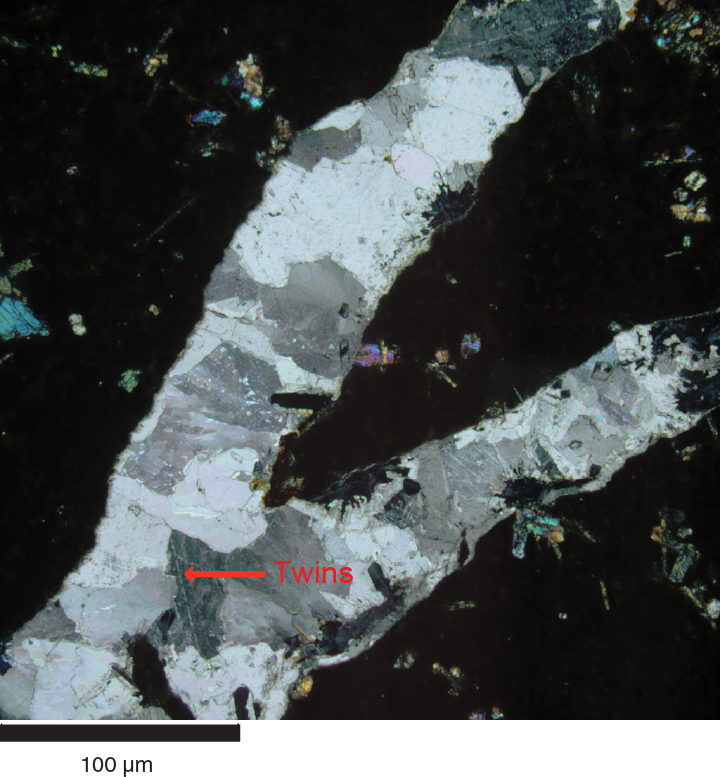
Within the veins, calcite usually shows a homogeneous grain size distribution. Calcite tends to form coarse grains of 0.1–0.3 mm diameter that are moderately twinned (Figure F26; Sample 18R-1, 5–8 cm; TS175). Single coarse grains usually show slight undulose extinction. The shape of the calcite grain boundaries is highly variable and irregular. Only a few calcite grains are affected by subgrain development.
Physical properties
Physical properties of the cores recovered at Site U1441 were characterized through a set of measurements on core sections and discrete samples (see details in Physical properties in the Expedition 352 methods chapter [Reagan et al., 2015]). Gamma ray attenuation (GRA) density, magnetic susceptibility (Magnetic Susceptibility Logger [MSL]), and P-wave velocity (P-wave Logger [PWL]) were obtained on the sediment cores using the Whole-Round Multisensor Logger (WRMSL), whereas only GRA density and magnetic susceptibility were obtained on the hard rock cores. Natural gamma radiation (NGR) was measured on the Natural Gamma Radiation Logger (NGRL) for whole-round core sections. Point magnetic susceptibility (MSP) and reflectance spectroscopy and colorimetry (RSC) data were acquired using the Section Half Multisensor Logger (SHMSL). Thermal conductivity (TCON) was obtained on whole-round sediment sections and discrete hard rock samples. Moisture and density (MAD) were obtained from both sediment and hard rock discrete samples, and P-wave velocities and magnetic susceptibility data were obtained from discrete hard rock samples. All raw data were uploaded to the Laboratory Information Management Systems (LIMS) database and subsequently filtered to remove the spurious points that correspond to empty intervals in the liner or broken pieces.
Sediment samples
P-wave velocities
No usable P-wave velocities were obtained in Unit I. P-wave velocities are 1500–1520 m/s from 15 to 69 mbsf (lithologic Units II–IV; Figure F27), with the exception of peaks of 1580 m/s at 22–24 mbsf (Unit II) and 1540 m/s at 56–58 mbsf (Unit III). The peaks in P-wave velocities in Units II and III correspond to tephra layers. P-wave velocities increase from 1510 to 1580 m/s at the base of Unit IV (69–70 mbsf) and have higher values of 1560–1600 m/s in Unit V (70–78 mbsf).
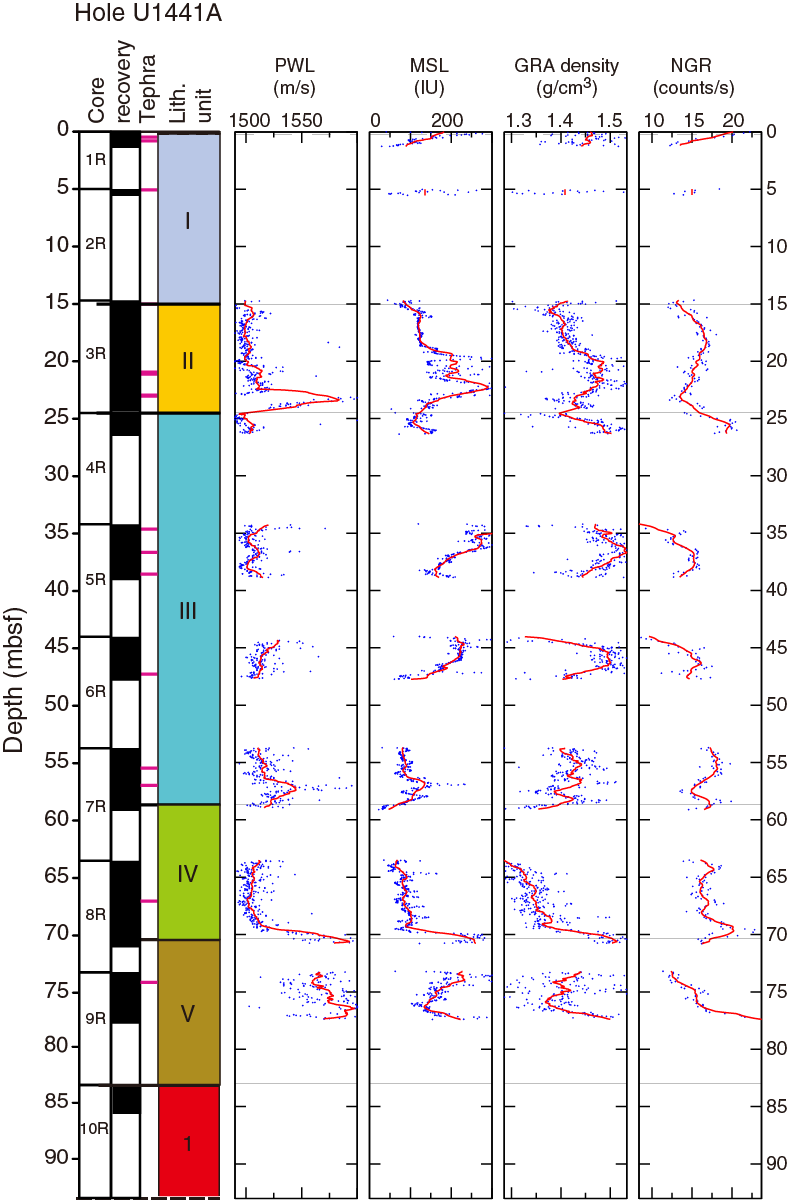
Magnetic susceptibility
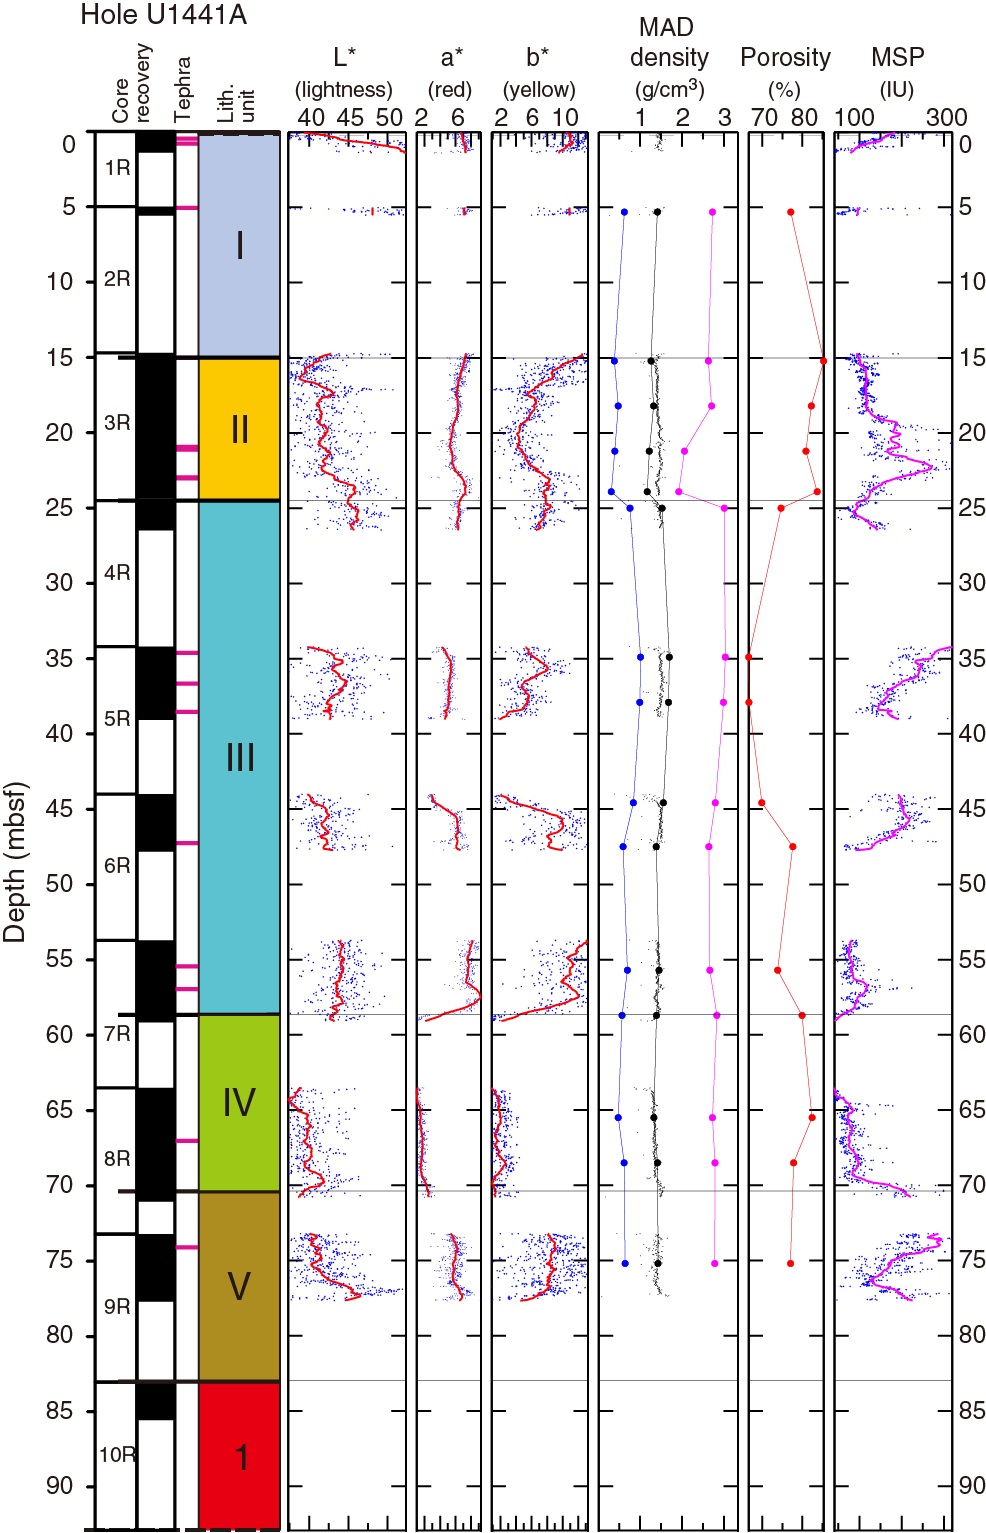
Magnetic susceptibility values are 80–160 IU from the seafloor to 19 mbsf (Unit I and upper Unit II) and 23–26 mbsf (lower Unit II and upper Unit III) but increase abruptly to 160–280 IU from 19 to 23 mbsf (middle Unit II). Magnetic susceptibility values decrease to 110 IU from 34 to 48 mbsf (Unit III) and are relatively constant at 60–130 IU from 48 to 69 mbsf (Units III and IV). Magnetic susceptibility values increase to 260 IU from 69 to 78 mbsf (base of Unit IV and Unit V). In general, MSP values (Figure F28) has a similar trend to the whole-core magnetic susceptibility values.
GRA density
Bulk GRA density is 1.35–1.55 g/cm3 from 0 to 45 mbsf (from Unit I to the middle of Unit III). GRA density values decrease to 1.40–1.45 g/cm3 from 53 to 58 mbsf (bottom of Unit III to middle of Unit IV) and increase from 1.30 to 1.35 g/cm3 between 64 and 69 mbsf (lower Unit IV). GRA density is 1.35–1.50 g/cm3 at 69–77 mbsf (bottom of Unit IV and Unit V).
Natural gamma radiation
NGR values are 13–20 counts/s at 0–26 mbsf (from Unit I to upper Unit III). NGR values are ~15 counts/s at 34–48 mbsf (middle unit III), and ~17 counts/s at 48–70 mbsf (lower Unit III and Unit IV). NGR values increase from 13 to 23 counts/s at 73–77 mbsf (Unit V).
Reflectance spectroscopy and colorimetry
Reflectance parameter L* (Figure F28) increases from 40 to 52 in upper Unit I (0–1.5 mbsf). L* values are 39–46 in Units II and III (15–58 mbsf) and decrease to 38–42 at 63–76 mbsf (Unit IV and upper Unit V). L* values increase to 42 in lowermost Unit V (76–78 mbsf). Reflectance parameter a* is 4–9 in Units I–III (0–58 mbsf) and Unit V (70–78 mbsf) and decreases to 1 in Unit IV (58–70 mbsf). Reflectance parameter b* displays a similar pattern with values of 2–12 in Units I–III (0–58 mbsf) and Unit V (70–78 mbsf) and 1 in Unit IV (58–70 mbsf).
Moisture and density
Average dry, bulk, and grain densities (Figure F28) are 0.6, 1.4, and 2.7 g/cm3, respectively, in Units I–V (5–75 mbsf). All densities have a similar pattern, with values decreasing in lower Unit II (by 0.2 g/cm3 for dry and bulk density and 0.8 g/cm3 for grain density) and increasing in upper Unit III (values 0.1–0.4 g/cm3 higher than the average values for all density types). Calculated porosity is 75%–85% at 5–25 mbsf (Unit I to uppermost Unit III) and 48–75 mbsf (lower Unit III to Unit IV) and decreases to 67%–70% at 35–45 mbsf (middle of Unit III).
Basement samples
Magnetic susceptibility (MSL, MSP, and discrete cubes)
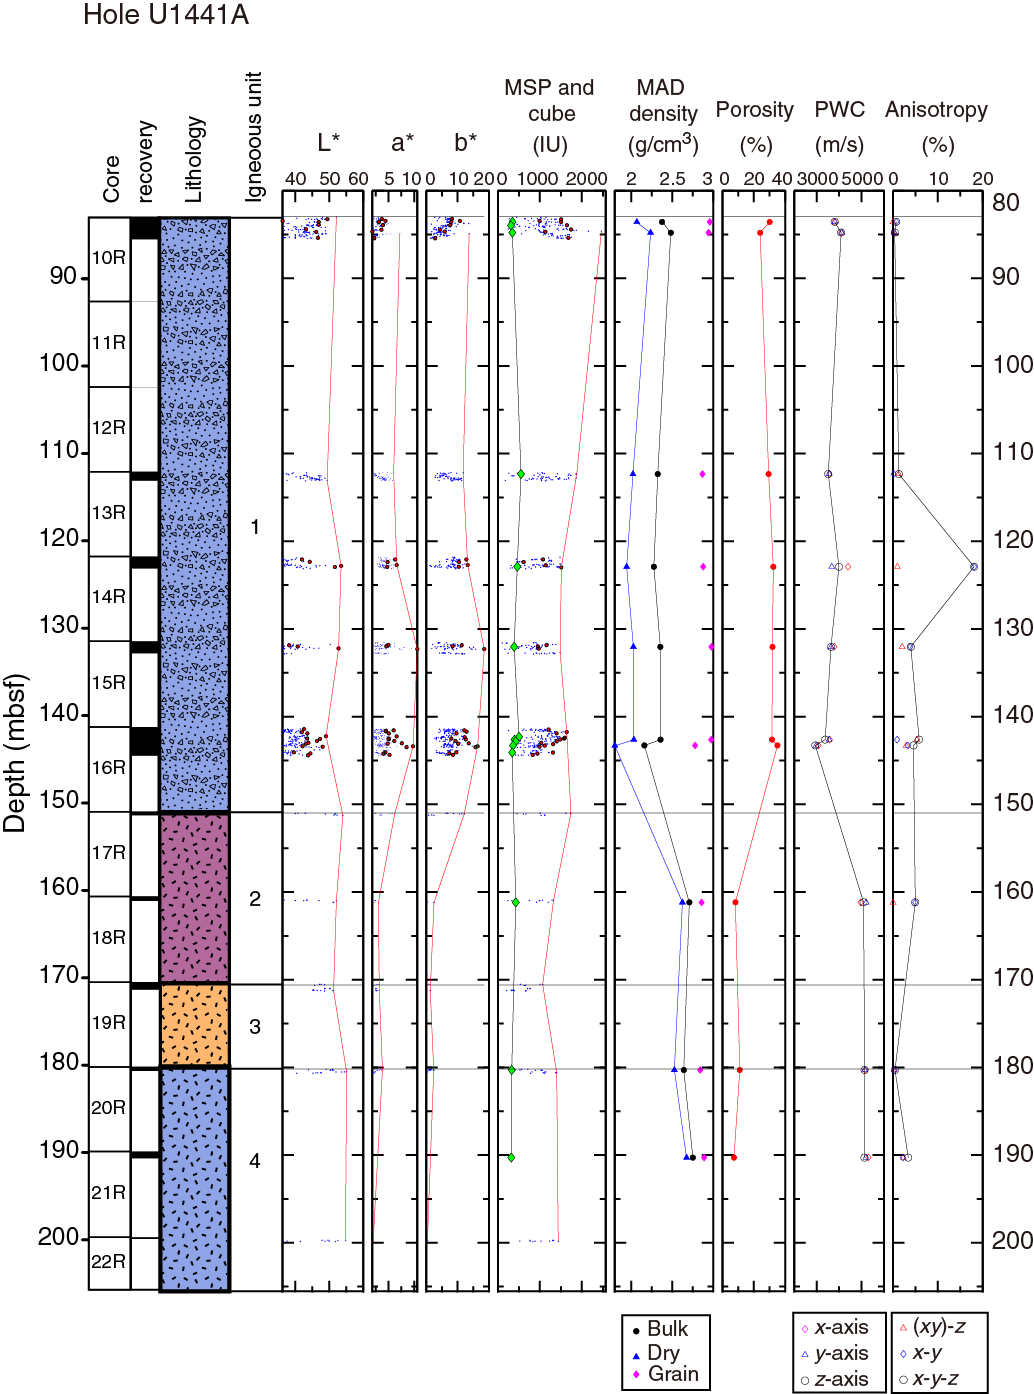
Magnetic susceptibility was measured on whole-round basement cores, with maximum magnetic susceptibility values found at the center of each intact core piece (red circles in Figure F29). There is a clear change in the magnetic susceptibility below ~145 mbsf (lowest part of igneous Unit 1). Magnetic susceptibility values are 400–1000 IU at 82–145 mbsf (Unit 1) and decrease to 200–600 IU at 150–200 mbsf (Units 2–4). This magnetic susceptibility change can also be observed in the MSP measurements (Figure F30), which were carried out on split core sections, although the change in the MSP values is not as clear as the MSL values. MSP values are 1000–2000 IU at 82–140 mbsf (Units 1) decreasing to 500–1500 IU at 149–199 mbsf (Units 2–4). Discrete cube magnetic susceptibility values are variable between 300 and 550 IU at 83–190 mbsf (Units 1–4).
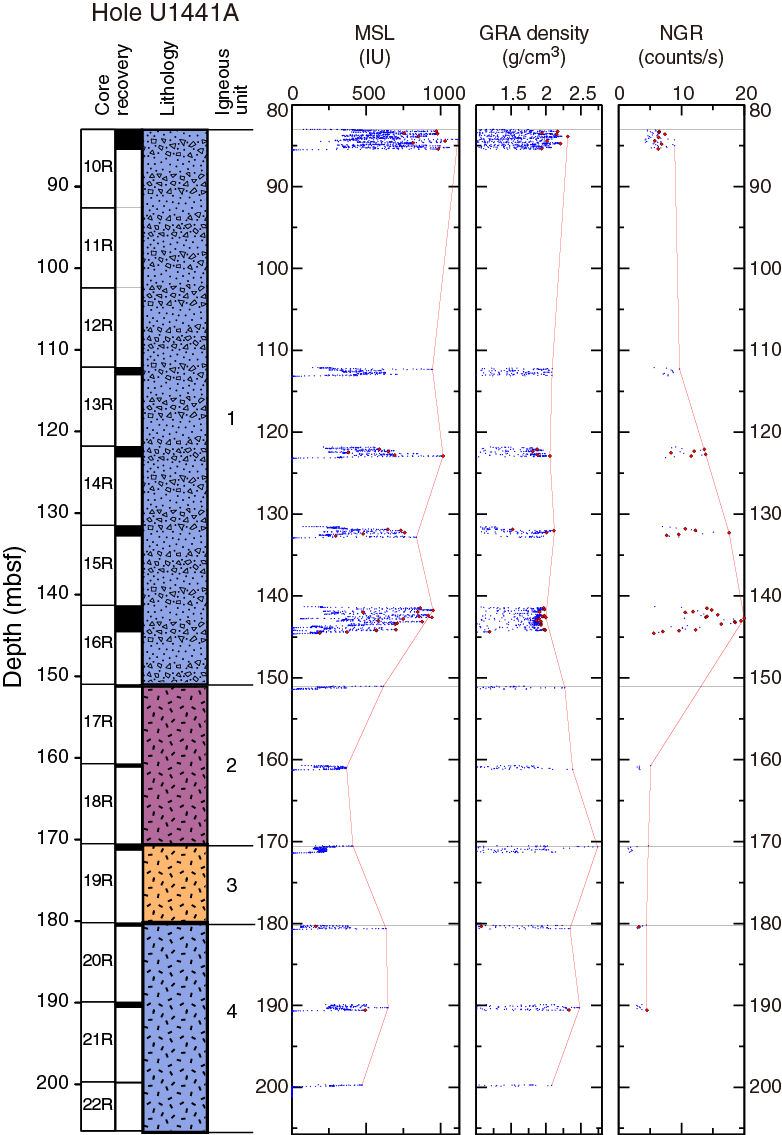
GRA density
Similar to the magnetic susceptibility values, GRA density values reach a maximum at the center of each intact core piece (red circles in Figure F29). Maximum GRA density varies from 2.0 to 2.7 g/cm3 with a peak at 170 mbsf in Unit 3.
Natural gamma radiation
NGR measurements are 5–10 counts/s at 80–110 mbsf (upper Unit 1) and gradually increase with depth from 9–13 to 9–20 counts/s at 120–145 mbsf (lower Unit 1). NGR values decrease to 3–4 counts/s at 160–190 mbsf (Units 2–4).
Reflectance spectroscopy and colorimetry
Maximum values of reflectance parameter L* increase slightly from 50 to 55 with depth from 83 to 200 mbsf. Maximum values of reflectance parameters a* and b* increase slightly from 13 to 18 in basement Unit 1 (80–152 mbsf) and decrease to ~0 in Units 2–4 (152–200 mbsf).
Moisture and density
Dry density, bulk density, grain density, and porosity were calculated after the measurements of mass and volume on dry and wet rock cubes taken from the working-half sections (see details in Physical properties in the Expedition 352 methods chapter [Reagan et al., 2015]). The calculated dry, bulk, and grain densities average 2.0, 2.4, and 2.9 g/cm3, respectively (Figure F30). Bulk and dry densities are 2.4 and 2.0 g/cm3, respectively, at 83–143 mbsf in Unit 1 and increase to 2.6 and 2.7 g/cm3 at 160–190 mbsf in Units 2–4. Grain density is 2.8–2.9 g/cm3 at 83–190 mbsf (Units 1–4). Porosities are 23%–32% at 83–143 mbsf (Unit 1) and decrease to <10% at 160–190 mbsf (Units 2–4).
P-wave velocities
P-wave velocities measured on discrete samples (Figure F30) vary between 3000 and 4000 m/s in Unit 1 (83–152 mbsf) and increase to 5000 m/s at 160–190 mbsf (Units 2–4). Seismic anisotropies are 0%–5%, with the exception of 18% at 123 mbsf in Unit 1.
Thermal conductivity
The thermal conductivity of the sedimentary cores was measured (usually once per core in the middle part of the third section) using a needle sensor. Most of the measurements (which consisted of three replicate analyses in the same spot) were unreliable, and only a few measurements were successful, although all raw data are available in the database. Thermal conductivity ranges from 0.78 to 0.95 W/(m·K) with an average value of ~0.86 W/(m·K) (Figure F31). Thermal conductivity on igneous rocks often required five replicate analyses and delivered reliable results. An average thermal conductivity value of 1.18 W/(m·K) was measured for discrete samples at 83–144 mbsf. Values are 1.1–1.3 W/(m·K), with a minimum value of 1.1 W/(m·K) observed at 132 mbsf.

Paleomagnetism
Sediment
Paleomagnetic measurements were made with the pass-through cryogenic magnetometer on sediment Cores 352-U1441A-3R through 9R. Cores 1R and 2R were not measured because they were highly disturbed and appeared to have high fluid content (and low competence). Measurements were made at 5 cm intervals, and five sets of measurements were made with different alternating field (AF) demagnetization levels (0, 15, 20, 25, and 30 mT). No discrete samples were measured because the sediment magnetization is likely to have been weak and easily affected by the anhysteretic remanent magnetization (ARM) observed on most of the samples treated with the D-Tech AF demagnetizer.
Magnetic polarity was interpreted from the inclination of the 30 mT AF step (Figure F32), which should have the drill string overprint removed. Inclinations are remarkably consistent within cores, which shows that RCB coring did not disturb the sediment sufficiently to completely scramble the paleomagnetic signal. Nevertheless, the recorded inclinations are rather high, mostly having absolute values >60°. These inclinations are unexpected because the geocentric axial dipole inclination for the site (i.e., the current average field direction) is 47.6°. The cause of this inclination steepening is unclear.

These cores display alternate intervals with positive and negative inclinations, implying a magnetic stratigraphy. However, it is difficult to interpret the pattern because it is not continuous and not distinctive. More than half of the polarity record appears to be missing owing to nonrecovery (Figure F32). In addition, biostratigraphic datums (see Biostratigraphy) indicate that Core 5R is late Miocene in age, about the age of Chron 4 on the geomagnetic polarity timescale (Gradstein et al., 2012). This observation implies that there should be ~15 normal polarity zones and an equal number of reversed polarity zones between this core and the surface, but the cores above show only one normal polarity zone within a reversed polarity zone (Figure F32). Similarly, the late Miocene is a time of rapid magnetic reversals, so many alternating polarity zones should be observed in Cores 5R through 9R. Again, only a few polarity alternations are recorded. These observations indicate that the polarity record in Hole U1441A cores is fragmentary and probably riddled with sedimentary gaps.
Igneous rock
Archive-half measurements
Oriented pieces larger than ~15 cm from the archive-half core sections were measured in the cryogenic magnetometer but, because of low recovery, there were few such pieces. AF demagnetization was used to remove overprint magnetizations, using eight steps of 5, 10, 15, 20, 25, 30, 40, and 50 mT. Each piece was measured using the cryogenic magnetometer discrete sample routine. This is a nonstandard measurement for the cryogenic magnetometer because the pieces are irregular in shape, which is not ideal for accurately measuring the magnetization since the magnetometer software assumes continuous core. If the magnetic field edge-effects at the ends of the pieces come within the sensor coils, the resulting magnetization direction may be incorrectly estimated. In addition, the sample volumes are much larger than the 8 cm3 that is typical for discrete samples. For this reason, the magnetization intensities in the LIMS database are incorrect and the directions must be treated with caution. Nevertheless, these measurements provide an alternate method of evaluating the magnetic properties of the rock cores.
Only four pieces were large enough to be measured by this method: two from Core 10R and two from Core 16R. The median destructive fields (MDF) for these samples are between 8 and 13 mT, which is typical for oceanic igneous rock containing titanomagnetite. Three samples yielded sufficiently reliable data that they could be used for principal component analysis (PCA; Kirschvink, 1980), but the quality of the AF demagnetizations is poor. These measurements yield scattered inclination values between –44° and 23°.
Discrete samples
Discrete samples were taken as 8 cm3 cubes at a rate of approximately one discrete sample per section, except in sections in which there were no core pieces long enough to be considered oriented. Because the archive-half AF demagnetizations yield poor quality results, thermal demagnetization was preferred, although a few samples were treated with AF demagnetization. In total, four samples were treated with AF demagnetization and nine with thermal demagnetization. The small number of samples analyzed was a consequence of low recovery. The Hole U1441A cores contain few oriented pieces.
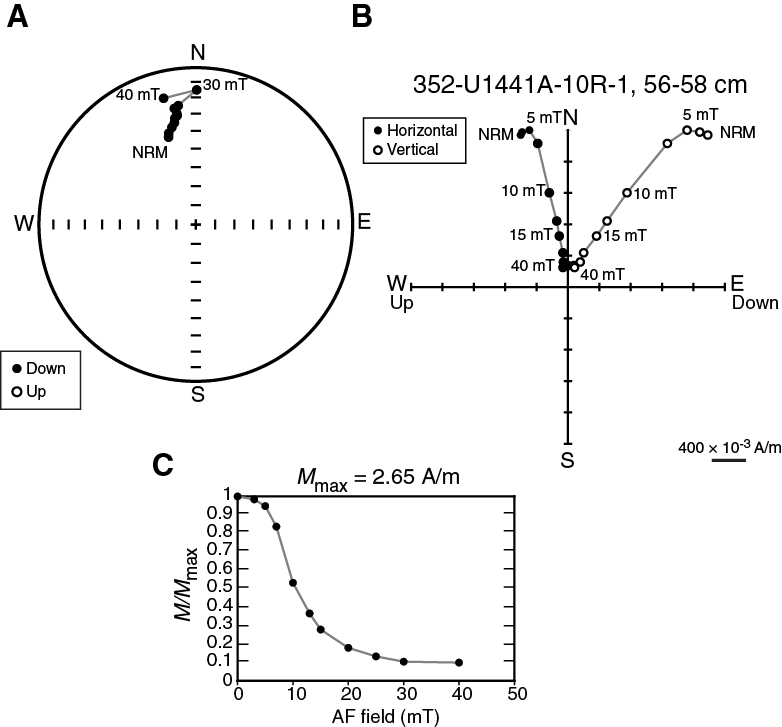
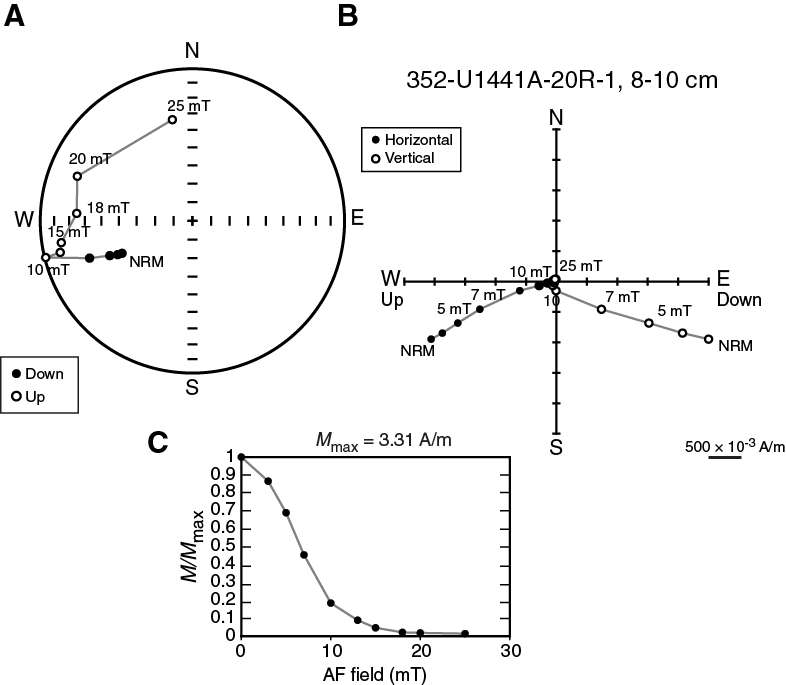
Only three AF-demagnetized samples produced results consistent enough to be analyzed with PCA. Demagnetization spectra are characterized by an initial plateau and MDFs between 6.6 and 10.6 mT, values that indicate that the magnetization carriers are fine grains. Higher coercivity samples displayed relatively stable directions at AF steps of 10–25 mT (Figure F33), but low-coercivity samples often displayed little directional consistency (Figure F34).
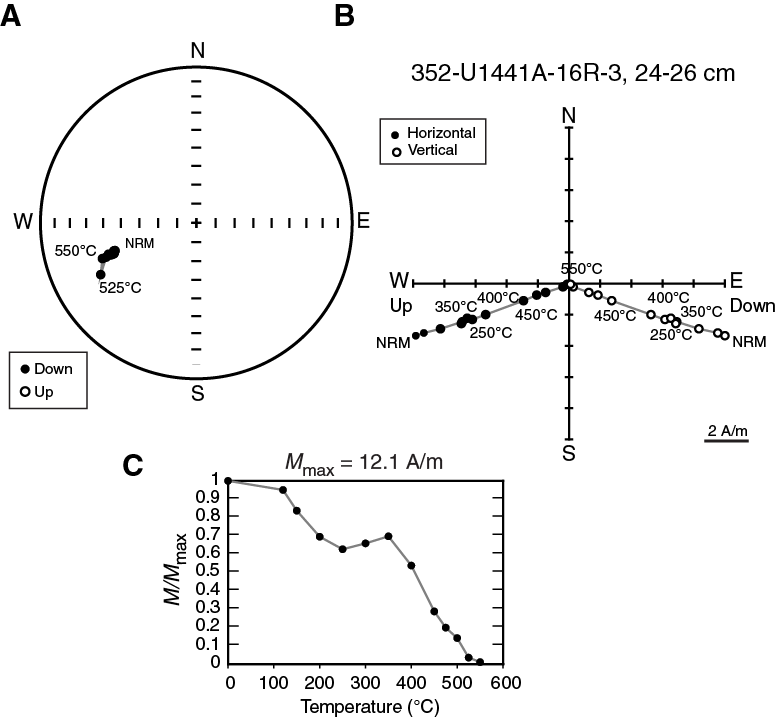
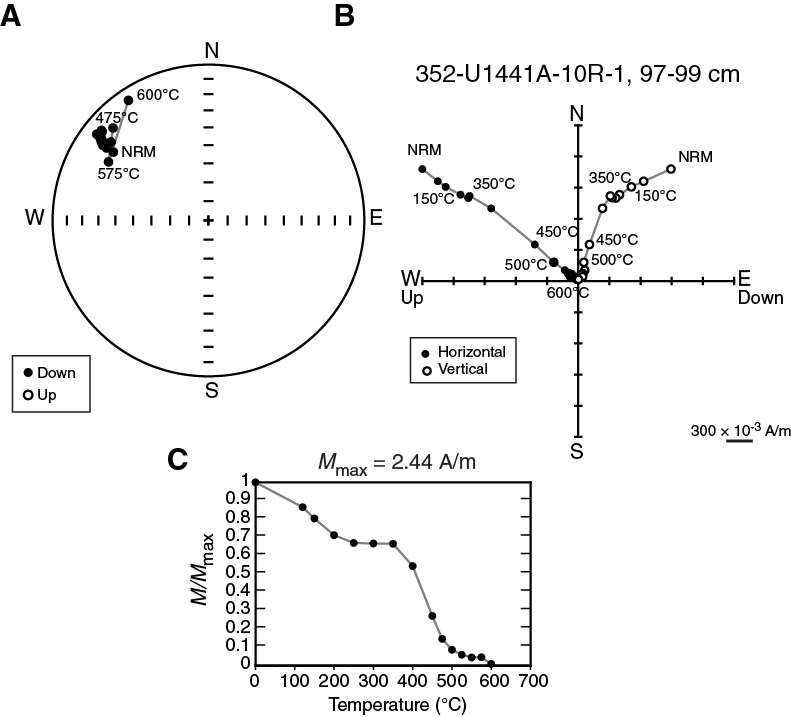
Thermal demagnetizations were carried out between 120° and 550° or 600°C, depending on the magnetic behavior, typically with 50°C steps up to 450° or 500° and 25°C steps at higher temperatures. No low-temperature demagnetization in liquid nitrogen was used, as the samples were largely fine-grained and no multidomain behavior was noted in the AF demagnetizations of archive-half pieces. Most samples were completely demagnetized by 600°C, and all by 625°C (implying no hematite content). As with samples from Site U1440, some of the Hole U1441A igneous samples display either an initial plateau in the demagnetization curve or a slight decrease, followed by an increase in magnetization (Figure F35) or at least a plateau (Figure F36) around 350°C that appears to result from partial self-reversal (Doubrovine and Tarduno, 2004, 2005). At temperatures above 350°C, the magnetization declines sharply between ~400° and 550°C, and these steps can be used to identify a stable magnetic direction in many samples using PCA. Curie temperatures are between 450° and 500°C, which implies that the magnetization carriers are titanomagnetite or titanomaghemite with a Ti substitution, x, between 0.2 and 0.4 (O’Reilly, 1976). The bulk magnetic susceptibility varies by a factor of 2 or 3 between room temperature and the last heating step, which could indicate that titanomaghemite is transformed into magnetite with the heating steps (Özdemir and O’Reilly, 1982). Most demagnetization plots are of high quality, showing a single paleomagnetic direction in most cases despite the small self-reversal (Figure F36).
Rock magnetic measurements
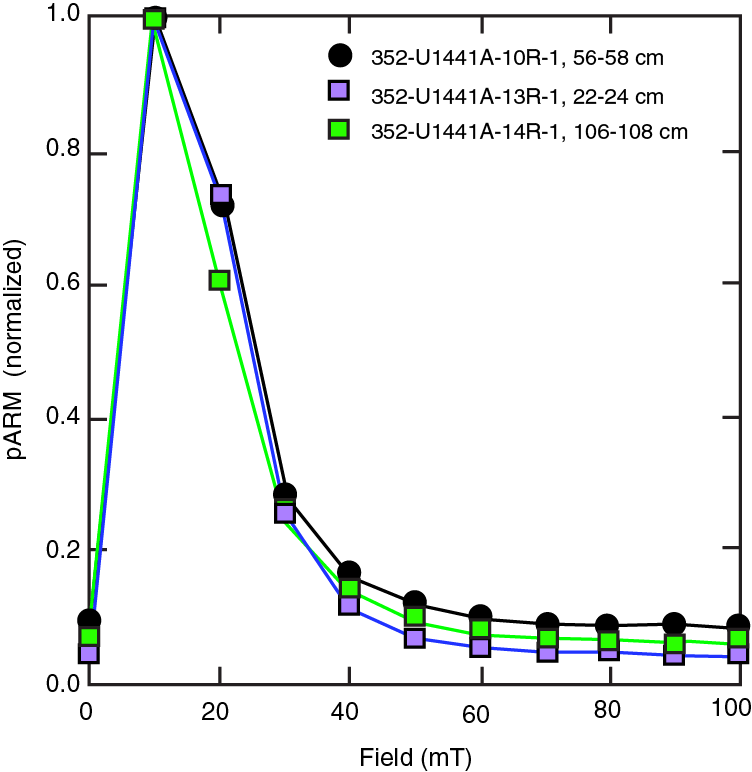
In order to characterize the magnetization carriers, we measured the acquisition of partial ARM (pARM) on 3 samples that were used for AF demagnetization, using 10 mT steps up to 100 mT (Figure F37). It was impossible to start from a completely demagnetized state (near-zero magnetization strength) because of the high coercivity of the samples and because they acquired a spurious ARM in the AF demagnetizer. This explains why the measurements near the origin of Figure F37 are not zero. The pARM acquisition curves are very similar for the three samples, with a single peak at 10 mT. Comparing with measurements made on synthetic magnetite (Jackson et al., 1988), our peak values correspond to grain sizes around 5 μm.
Paleomagnetic inclinations
Paleomagnetic directions were calculated using PCA analysis on a subset of demagnetization values, usually at high demagnetization steps, that appear to show a linear decay toward the origin of an orthogonal vector (Zijderveld) plot. This consistent set of demagnetization steps is assumed to be the characteristic remanent magnetization that was recorded at the time of initial sample cooling.
Paleomagnetic inclinations appear scattered, with seven samples having positive values and seven samples having negative values (Figure F38); however, there appears to be an overall consistency in the distribution. Ignoring the archive pieces measured in the cryogenic magnetometer, the uppermost three and lowermost two discrete samples have positive inclinations, whereas the seven samples in between have negative inclinations. This pattern can be interpreted as normal polarity zones at the top and bottom of the hole bracketing a reversed polarity zone in the middle. Most inclinations have absolute values around the present-day geocentric axial dipole value (47.6°), implying that the magnetization was acquired recently. Either the rocks sampled in Hole U1441A are young or they have been remagnetized in a recent magnetic field.
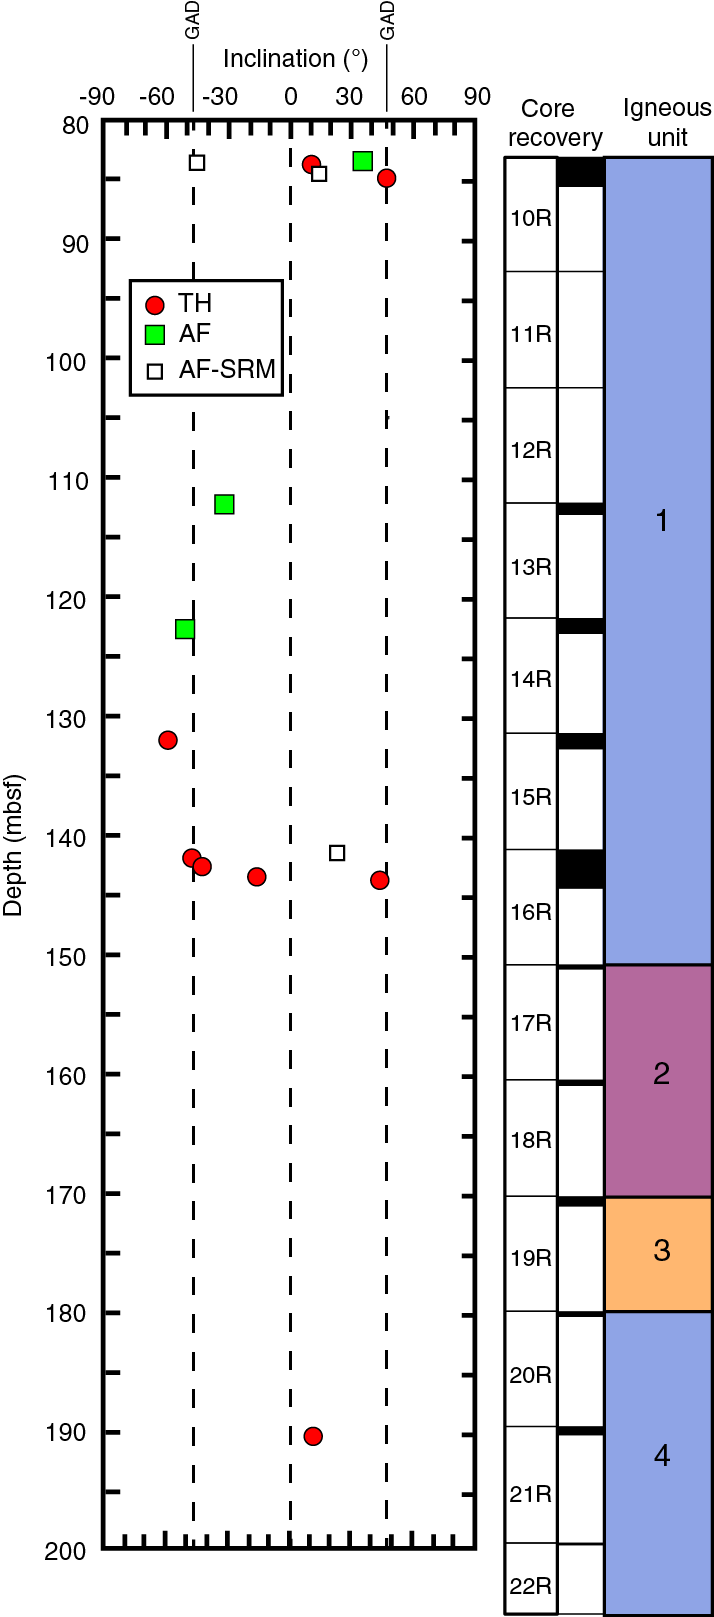
It was expected that the samples from igneous Unit 1 (Figure F38) might show random orientations because this unit appears to be a pile of talus (see Petrology). However, the inclination plot clearly shows that this is not the case. This discrepancy may come about in three ways. One is that the rocks were deposited a long time ago and then remagnetized in a recent field. This requires, however, that the three different polarity zones were magnetized coherently (i.e., the normal and reversed zones acquired only normal and reversed magnetizations with no mixture). Another explanation is that the samples were deposited at high temperature and acquired their magnetizations in the ambient magnetic field of the time. This could happen if the interpretation of downslope mass movement is incorrect or if the rocks were deposited at high temperature between the cooling of the magma and the Curie temperature of the rock components, which is probably ~300°–500°C. At this temperature, the rocks would form solid pieces but not yet acquire a permanent magnetization. Other explanations are that the clasts moved coherently as a block.
As mentioned above, we ignored the measurements of archive-half core pieces measured with the cryogenic magnetometer. Of the three samples that gave directions, two do not fit the pattern described by the discrete samples. An archive-half piece at 83.5 mbsf has a negative inclination, whereas the discrete samples at that depth give positive numbers. Another archive-half piece at 141.5 mbsf gives a positive inclination where the discrete samples give negative inclinations (Figure F38). As described above, these measurements are nonstandard for the cryogenic magnetometer and may not give reliable results. Indeed, as in previous chapters, we have found these measurements to be mostly unreliable.
References
Doubrovine, P.V., and Tarduno, J.A., 2004. Self-reversed magnetization carried by titanomaghemite in oceanic basalts. Earth and Planetary Science Letters, 222(3–4):959–969. http://dx.doi.org/10.1016/j.epsl.2004.04.009
Doubrovine, P.V., and Tarduno, J.A., 2005. On the compositional field of self-reversing titanomaghemite: constraints from Deep Sea Drilling Project Site 307. Journal of Geophysical Research: Solid Earth, 110(B11):B11104. http://dx.doi.org/10.1029/2005JB003865
Gradstein, F.M., Ogg, J.G., Schmitz, M.D., and Ogg, G.M. (Eds.), 2012. The Geological Time Scale 2012: Amsterdam (Elsevier).
Ishizuka, O., Tani, K., Reagan, M.K., Kanayama, K., Umino, S., Harigane, Y., Sakamoto, I., Miyajima, Y., Yuasa, M., and Dunkley, D.J., 2011. The timescales of subduction initiation and subsequent evolution of an oceanic island arc. Earth and Planetary Science Letters, 306(3–4):229–240. http://dx.doi.org/10.1016/j.epsl.2011.04.006
Jackson, M., Gruber, W., Marvin, J., and Banerjee, S.K., 1988. Partial anhysteretic remanence and its anisotropy: applications and grainsize-dependence. Geophysical Research Letters, 15(5):440–443. http://dx.doi.org/10.1029/GL015i005p00440
Jenner, F.E., and O’Neill, H.St.C., 2012. Analysis of 60 elements in 616 ocean floor basaltic glasses. Geochemistry, Geophysics, Geosystems, 13(2):Q02005. http://dx.doi.org/10.1029/2011GC004009
Kirschvink, J.L., 1980. The least-squares line and plane and the analysis of palaeomagnetic data. Geophysical Journal of the Royal Astronomical Society, 62(3):699–718. http://dx.doi.org/10.1111/j.1365-246X.1980.tb02601.x
Le Bas, M.J., Le Maitre, R.W., Streckeisen, A., Zanettin, B., and the IUGS Subcommission on the Systematics of Igneous Rocks, 1986. A chemical classification of volcanic rocks based on the total alkali-silica diagram. Journal of Petrology, 27(3):745–750. http://petrology.oxfordjournals.org/content/27/3/745.abstract
O’Reilly, W., 1976. Magnetic minerals in the crust of the Earth. Reports on Progress in Physics, 39(9):857–908. http://dx.doi.org/10.1088/0034-4885/39/9/002
Özdemir, Ö., and O’Reilly, W., 1982. Magnetic hysteresis properties of synthetic monodomain titanomaghemites. Earth and Planetary Science Letters, 57(2):437–447. http://dx.doi.org/10.1016/0012-821X(82)90162-5
Reagan, M.K., Ishizuka, O., Stern, R.J., Kelley, K.A., Ohara, Y., Blichert-Toft, J., Bloomer, S.H., Cash, J., Fryer, P., Hanan, B.B., Hickey-Vargas, R., Ishii, T., Kimura, J.-I., Peate, D.W., Rowe, M.C., and Woods, M., 2010. Fore-arc basalts and subduction initiation in the Izu-Bonin-Mariana system. Geochemistry, Geophysics, Geosystems, 11(3):Q03X12. http://dx.doi.org/10.1029/2009GC002871
Reagan, M.K., Pearce, J.A., Petronotis, K., Almeev, R., Avery, A.A., Carvallo, C., Chapman, T., Christeson, G.L., Ferré, E.C., Godard, M., Heaton, D.E., Kirchenbaur, M., Kurz, W., Kutterolf, S., Li, H.Y., Li, Y., Michibayashi, K., Morgan, S., Nelson, W.R., Prytulak, J., Python, M., Robertson, A.H.F., Ryan, J.G., Sager, W.W., Sakuyama, T., Shervais, J.W., Shimizu, K., and Whattam, S.A., 2015. Expedition 352 methods. In Reagan, M.K., Pearce, J.A., Petronotis, K., and the Expedition 352 Scientists, Izu-Bonin-Mariana Fore Arc. Proceedings of the International Ocean Discovery Program, 352: College Station, TX (International Ocean Discovery Program). http://dx.doi.org/10.14379/iodp.proc.352.102.2015
1Reagan, M.K., Pearce, J.A., Petronotis, K., Almeev, R., Avery, A.A., Carvallo, C., Chapman, T., Christeson, G.L., Ferré, E.C., Godard, M., Heaton, D.E., Kirchenbaur, M., Kurz, W., Kutterolf, S., Li, H.Y., Li, Y., Michibayashi, K., Morgan, S., Nelson, W.R., Prytulak, J., Python, M., Robertson, A.H.F., Ryan, J.G., Sager, W.W., Sakuyama, T., Shervais, J.W., Shimizu, K., and Whattam, S.A., 2015. Site U1441. In Reagan, M.K., Pearce, J.A., Petronotis, K., and the Expedition 352 Scientists, Izu-Bonin-Mariana Fore Arc. Proceedings of the International Ocean Discovery Program, Expedition 352: College Station, TX (International Ocean Discovery Program). http://dx.doi.org/10.14379/iodp.proc.352.105.2015