Data report: paleomagnetic direction measurements on Oligocene sediments
PDF Download figures Download tables Cited by
Reagan, M.K., Pearce, J.A., Petronotis, K.E., and the Expedition 352 Scientists
Proceedings of the International Ocean Discovery Program Volume 352
publications.iodp.org

https://doi.org/10.14379/iodp.proc.352.203.2018
Data report: paleomagnetic direction measurements on Oligocene sediments from Hole U1439A, Izu-Bonin-Mariana fore arc1
William W. Sager,2 Joshua D. Bridges2,3 and Claire Carvallo4
Keywords: International Ocean Discovery Program, IODP, JOIDES Resolution, Expedition 352, Site U1439, Site U1440, Site U1441, Site U1442, Izu-Bonin-Mariana fore arc, paleomagnetism, boninite, fore-arc basalt
MS 352-203: Received 5 July 2017 · Accepted 5 March 2018 · Published 8 May 2018
Abstract
Oligocene basal sediment samples from Hole U1439A, located on the Izu-Bonin-Mariana fore arc, were measured to determine paleomagnetic polarity and paleoinclination. A total of 57 samples from Cores 352-U1439A-16X through 19X were measured using thermal demagnetization to isolate the characteristic remanent magnetization (ChRM). The samples were relatively strongly magnetized, with about half having natural remanent magnetization intensities >100 mA/m. Most samples produced demagnetization results consistent enough to calculate a ChRM direction using principal component analysis, but the intrasample demagnetization consistency ranged from good to poor, indicating variable sample-recording fidelity. Paleoinclination values indicate at least two polarity zones, with a zone of normal polarity in Cores 16X and 17X overlying a reversed polarity zone in Core 18X. Unfortunately, normal paleoinclination values are significantly higher than reversed values, indicating that a downward-pointing overprint, probably caused by the drill string, was not completely removed by the demagnetization procedure. Thus, the paleoinclination values appear biased.
Introduction
International Ocean Discovery Program Expedition 352 cored at four sites on the Izu-Bonin Mariana (IBM) fore arc during August and September 2014 (Figure F1). One of the goals of the expedition was to learn about the tectonic history of the arc, which formed during the Eocene near the Equator (Hall et al., 1995). Since that time, the arc has drifted northward ~30° to its present latitude. During Expedition 352, Oligocene sedimentary rocks were cored just above the volcanic basement at Site U1439 (see the Site U1439 chapter [Reagan et al., 2015]). Preliminary investigations on board the R/V JOIDES Resolution indicate that these sedimentary rocks contain a stable paleomagnetism with inclinations shallower than the present-day field, which is expected for sediments deposited near the Equator. Because older samples are valuable for recording the tectonic motion of the Philippine Sea plate, this finding suggests that we can measure the paleomagnetism of these sediments to determine an Oligocene paleolatitude for Site U1439.

Figure F1. Expedition 352 coring sites.
Only a few paleomagnetic samples were measured from these basal sedimentary rocks during Expedition 352, so we densely sampled the Oligocene cores to obtain many data points, potentially allowing the determination of a precise paleolatitude. These sedimentary rock cores are characterized by a diverse mixture of fine- to coarse-grained clastic sediment interbedded with fine-grained, nannofossil-rich sediment and sedimentary rock (Reagan et al., 2015). The sampled section (Cores 352-U1439A-16X through 19X) is well-dated by Oligocene microfossils, which range in age from ~24 to 34 Ma. Bedding dips in these cores are near zero, implying that there has been no tectonic tilting.
Methods
Samples from the Oligocene cores were cut with a two-bladed saw into 8 cm3 cubes. The cores were often broken into short segments along bedding planes, resulting in many pieces that were too small to be oriented. Samples were taken from larger pieces with vertical sides that allowed vertical sample orientation. Although the cores contain coarse-grained layers, the larger pieces tended to be nannofossil-rich carbonate rock, likely deposited during quiescent sedimentary intervals. Without bedding planes to fracture during coring, these massive rocks were more likely to produce larger, oriented pieces.
Measurements were made on 57 sediment samples in the University of Houston (USA) paleomagnetic laboratory. Samples were initially coated with a layer of sodium silicate to enhance cohesion and resist breakage. Magnetization measurements were made with an Agico JR-6A spinner magnetometer in a shielded room. The sensitivity limit of this instrument is ~0.5 × 10⁻⁶ A/m. During Expedition 352, pilot samples were treated with alternating field (AF) demagnetization, and many samples displayed low median destructive fields (MDF; the field at which half of the magnetization is removed), often <10 mT (see the Site U1439 chapter [Reagan et al., 2015]). Because these shipboard results sometimes gave unreliable directions, thermal demagnetization was used in this study. Stepwise thermal demagnetization experiments were carried out with a Schoenstedt TSD-1 oven located in a shielded room. After the initial natural remanent magnetization (NRM) was measured, subsequent measurements were made after thermal demagnetization at 50°C steps from 150° to 400°C and 25°C steps afterward up to a maximum of 600°C. Demagnetization of a few samples was discontinued before 600°C because the sample became too weak to be reliably measured or the high-temperature measurements appeared erratic. Among the 57 samples tested, only one was discontinued above 300°C due to disaggregation during heating. More than half of the samples were measured to 550°C or above.
All direction measurements were analyzed using Agico Remasoft software, which makes plots of the magnetization measurements and performs principal component analysis (PCA; Kirschvink, 1980). Plots of the vector endpoint on a stereonet, normalized magnetization at different demagnetization steps, and orthogonal vector plots (Zijderveld, 1967) showing the vector endpoints projected on two orthogonal planes were made for each sample to aid analysis. Typically, after a low-temperature overprint has been removed, the characteristic remanent magnetization (ChRM), acquired at the time of initial rock cooling, is revealed. We looked for consistent endpoints on the stereonet and linear vector segments pointing toward the origin on the orthogonal vector plot to signify a stable ChRM. The direction of the ChRM was calculated using PCA with some number of consistent measurements at different temperature steps. The minimum number of steps used was 3 for one sample, but 5–8 steps was common, and as many as 13 consistent steps were used (Table T1). We calculated PCA solutions both with and without the origin included in the inversion. Although calculating the PCA solution with the origin included does not force the solution vector to the origin, it gives weight to that direction. Because the solution without the origin is unbiased, we prefer to interpret that direction as the ChRM. The PCA calculation produces a measure of angular dispersion of the measurements, called maximum angle of deviation (MAD; Kirschvink, 1980). Larger angles indicate greater scatter of the demagnetization data and a less-reliable result.
Table T1. Paleomagnetic direction data. Download table in CSV format.
Results
NRM intensities of the measured samples ranged from 16.1 to 767.2 mA/m, with about half the samples below 100 mA/m and half above this value. With these relatively high intensities, most samples were strong enough to be easily measured at the NRM step and retained enough magnetization at most heating steps to produce reliable results. Only the weakest samples were demagnetized to an intensity near the magnetometer noise level at high temperature steps. Some sample directions became erratic (i.e., progressive temperature steps appear uncorrelated) above ~550°C, probably because such temperatures exceeded the blocking temperature of the magnetic grains.
Most samples produced results consistent enough to calculate a PCA direction, but a wide variation of sample consistency during demagnetization was observed. Ten samples gave demagnetization directions that were highly scattered or did not yield a consistent direction. These samples are labeled “unstable” in Table T1. Some of these samples may be more properly interpreted as multicomponent magnetizations, but they do not readily lend themselves to determining the ChRM direction, so we lump them with truly erratic samples. Qualitatively, ~41% of samples showed a tight cluster (approximately <10° scatter) of directions (Table T1, “Good” quality; Figure F2A) and ~21% displayed more scatter (approximately <20°) but with some consistent directions (Table T1, “Fair” quality; Figure F2B). For the remaining samples, about half gave no consistent direction (Table T1, “Unstable”) and the others were mostly inconsistent with only a few consistent steps (Table T1, “Poor” quality) that could be used to calculate a PCA solution (Figure F2C). Although these quality classifications are arbitrary, they allow us to give the reader an idea of how reliable we believe the solutions to be; for example, some solutions determined from a small number of directions may have small MAD values, yet the overall behavior of the sample is not reliable. PCA solutions for the thermal demagnetization experiments generally gave low MAD values (<10°); ~81% of the samples have a MAD value <10° and ~30% have values <5°. Despite this apparent consistency, the repeatability of demagnetization step directions was frequently poor, in contrast to the generally tight clustering of similar results from basalts cored in the same hole (Sager et al., 2018).
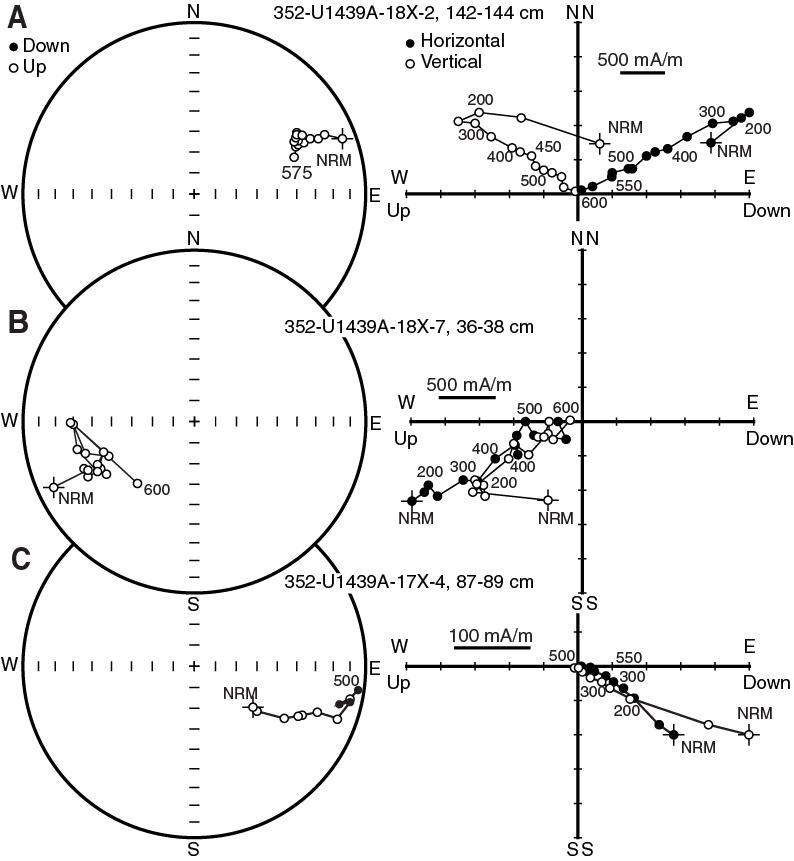
Figure F2. Sample demagnetization behavior.
Most samples displayed a downward-pointing overprint probably caused by drill string remagnetization. This isothermal remanent magnetization (IRM) is imparted when the core is exposed to strong magnetic fields produced by the drill pipe (Audunsson and Levi, 1989; Pinto and McWilliams, 1990; Roberts et al., 1996; Fuller et al., 1998). This overprint is easily recognized in most orthogonal vector plots, with a NRM direction that is nearly vertical downward (Figure F2A, F2B). The overprint is also noticed in the “hunchback” behavior of some relative-magnetization curves, as discussed below. Thermal demagnetization eventually appeared to remove this overprint at 300°–500°C.
Measurements show trends on normalized magnetization plots (Figure F3) that allow us to broadly divide the samples into three categories. Some plots show a nearly linear decay of the magnetization throughout demagnetization (Figure F3), indicating a wide distribution of magnetic-grain blocking temperatures. Many plots display little demagnetization at low temperatures (<250°C), followed by a linear or slightly convex upward shape at higher temperatures (plateau) (Figure F3). This behavior probably results from a lack of grains with low blocking temperatures but with a wide distribution of higher value blocking temperatures. A few plots display a hunchback shape (Figure F3), with magnetization increasing slowly at low temperatures before steeply declining, typically starting at ~200°C. This behavior resembles partial self-reversal (Doubrovine and Tarduno, 2004, 2005), but we do not think this is the case here. Partial self-reversal of rocks with titanomagnetite grains usually shows a peak at 300°–400°C, but here the peak is usually lower. We think this behavior is caused by removal of an overprint that is opposite in polarity to the ChRM. In fact, this behavior is found only in Core 352-U1439A-18X samples, in a zone that we interpret to be reversed polarity. This behavior would be expected from a downward-pointing drill string overprint that is removed from an upward-pointing reversed polarity magnetization vector. The linear behavior was noted in ~36% of the samples, and the hunchback behavior was seen in ~16% of the samples. The plateau behavior was seen most often (~45% of the samples). Only ~3% of the samples gave results that did not fit these categories.
Similarities of demagnetization behavior in different cores implies changes in magnetic grains caused by small changes in lithology. Samples from Core 16X mostly displayed linear demagnetization. Samples from Core 17X were mostly of the low-temperature plateau pattern. All but one of the samples from Core 19X were unstable and all of those (3 samples) displayed rapid demagnetization at low temperature steps, implying a large fraction of low–blocking temperature magnetic grains.

Figure F3. Magnetization decay with increasing temperature.
A plot of ChRM inclinations against depth shows good agreement with shipboard archive half-core measurements (see the Site U1439 chapter [Reagan et al., 2015]) (Figure F4). Most values from shallower than ~158 meters below seafloor (mbsf) have positive inclinations, with negative inclinations deeper than this depth. Several samples depart from this pattern. One negative-inclination sample occurs in Core 16X, with the adjacent sample having low inclination (Samples 352-U1439A-16X-4, 122–124 cm [143.22 mbsf], and 16X-5, 55–57 cm [143.95 mbsf], respectively). Both samples have large MAD values (Table T1), so it is unclear whether these samples indicate a polarity change or simply unreliable measurements. Shipboard archive-half core inclination values from this interval are scattered with a near-zero mean and were interpreted as indeterminate polarity (see the Site U1439 chapter [Reagan et al., 2015]). Similarly, within Core 17X, between 152.47 and 154.57 mbsf, four consecutive negative inclination samples were found. Although all four samples have large MAD values, two are <10°, and the consistent polarity implies that these samples indicate a reversed polarity zone. Shipboard archive-half core measurements in the same interval show consistent negative inclinations and were also interpreted as a reversed polarity zone. The only sample from Core 19X to give a reliable PCA solution, Sample 19X-4, 130–132 cm (172.9 mbsf), gave a positive inclination, whereas most samples from Core 18X above gave negative values. Although only a single sample, it may indicate normal polarity for the bottom of the cored section. Shipboard archive-half core measurements from Core 19X are highly scattered, but most measured inclinations are positive, supporting this interpretation. Overall, the measured section appears to record two reversed polarity zones sandwiched between three normal zones.
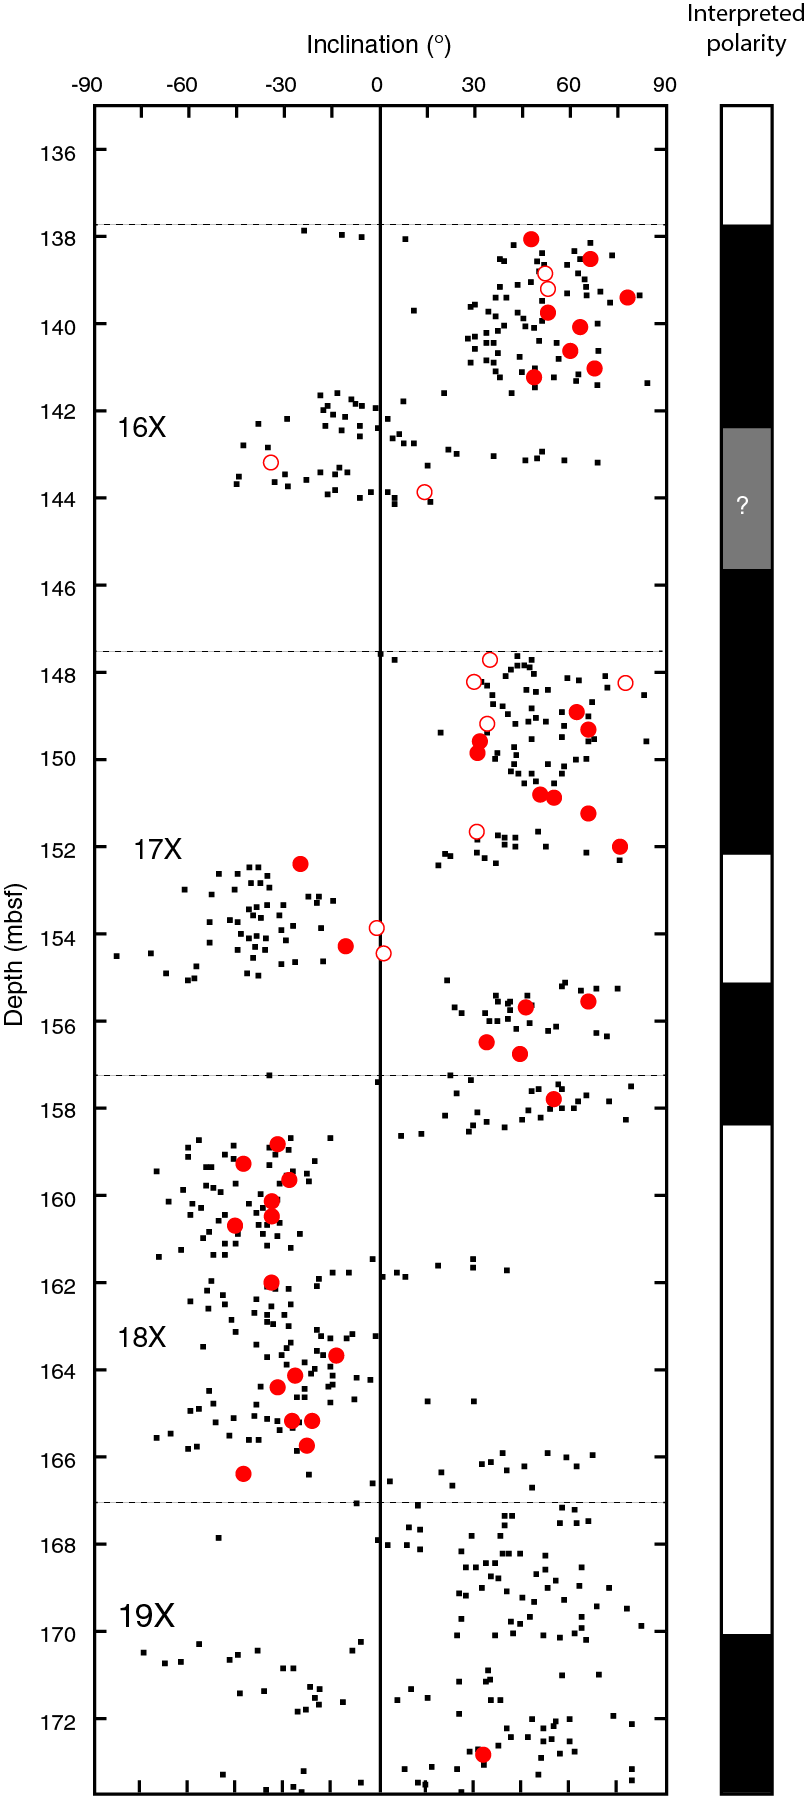
Figure F4. Oligocene sediment ChRM inclination values.
It is obvious from the inclination plot (Figure F4) that positive inclinations have higher absolute values on average than negative inclinations. The average positive inclination in this study is 49.1°, whereas the average negative inclination is −29.1° (both averages calculated from PCA solutions without the origin). This discrepancy implies that the calculated ChRM inclinations are biased. This difference could occur by incomplete removal of the drill string overprint, which points downward (Roberts et al., 1996) and would therefore increase positive inclination values but lessen negative values. Interestingly, most PCA solutions (70%) calculated including the origin give lower inclinations than the corresponding PCA calculated without the origin (Table T1). This difference indicates that many demagnetization vectors are not trending directly to the coordinate origin, which is another potential indication of an incompletely removed overprint. Unfortunately, the bias indicates that the sample inclinations are not reliable indicators of the paleofield value, so these data cannot be used to determine paleolatitude. The polarity inferences are not as sensitive to overprint bias, so the polarity zones are likely to be reliable.
Acknowledgments
Funding for this study was provided by a grant from the US Science Support Program (USSSP). This study would not have been possible without the International Ocean Discovery Program (IODP) and its dedicated technical staff, scientists, and crew on board the R/V JOIDES Resolution. This research used samples and data provided by the International Ocean Discovery Program (IODP), which is supported in part by the U.S. National Science Foundation. The authors thank Brendan Reilly for a careful review.
References
Audunsson, H., and Levi, S., 1989. Drilling-induced remanent magnetization in basalt drill cores. Geophysical Journal International, 98(3):613–622. https://doi.org/10.1111/j.1365-246X.1989.tb02294.x
Doubrovine, P.V., and Tarduno, J.A., 2004. Self-reversed magnetization carried by titanomaghemite in oceanic basalts. Earth and Planetary Science Letters, 222(3–4):959–969. https://doi.org/10.1016/j.epsl.2004.04.009
Doubrovine, P.V., and Tarduno, J.A., 2005. On the compositional field of self-reversing titanomaghemite: constraints from Deep Sea Drilling Project Site 307. Journal of Geophysical Research: Solid Earth, 110(B11):B11104. https://doi.org/10.1029/2005JB003865
Fuller, M., Hastedt, M., and Herr, B., 1998. Coring-induced magnetization of recovered sediment. In Weaver, P.P.E., Schmincke, H.-U., Firth, J.V., and Duffield, W. (Eds.), Proceedings of the Ocean Drilling Program, Scientific Results, 157: College Station, TX (Ocean Drilling Program), 47–56. https://doi.org/10.2973/odp.proc.sr.157.103.1998
Hall, R., Fuller, M., Ali, J.R., and Anderson, C.D., 1995. The Philippine Sea plate: magnetism and reconstructions. In Taylor, B., and Natland, J. (Eds.), Active Margins and Marginal Basins of the Western Pacific. Geophysical Monograph, 88:371–404. https://doi.org/10.1029/GM088p0371
Kirschvink, J.L., 1980. The least-squares line and plane and the analysis of palaeomagnetic data. Geophysical Journal of the Royal Astronomical Society, 62(3):699–718. https://doi.org/10.1111/j.1365-246X.1980.tb02601.x
Pinto, M.J., and McWilliams, M., 1990. Drilling-induced isothermal remanent magnetization. Geophysics, 55(1):111–115. https://doi.org/10.1190/1.1442765
Reagan, M.K., Pearce, J.A., Petronotis, K., Almeev, R., Avery, A.A., Carvallo, C., Chapman, T., Christeson, G.L., Ferré, E.C., Godard, M., Heaton, D.E., Kirchenbaur, M., Kurz, W., Kutterolf, S., Li, H.Y., Li, Y., Michibayashi, K., Morgan, S., Nelson, W.R., Prytulak, J., Python, M., Robertson, A.H.F., Ryan, J.G., Sager, W.W., Sakuyama, T., Shervais, J.W., Shimizu, K., and Whattam, S.A., 2015. Site U1439. In Reagan, M.K., Pearce, J.A., Petronotis, K., and the Expedition 352 Scientists, Izu-Bonin-Mariana Fore Arc. Proceedings of the International Ocean Discovery Program, 352: College Station, TX (International Ocean Discovery Program). https://doi.org/10.14379/iodp.proc.352.103.2015
Roberts, A.P., Stoner, J.S., and Richter, C., 1996. Coring-induced magnetic overprints and limitations of the long-core paleomagnetic measurement technique: some observations from Leg 160, eastern Mediterranean Sea. In Emeis, K.-C., Robertson, A.H.F., Richter, C., et al., Proceedings of the Ocean Drilling Program, Initial Reports, 160: College Station, TX (Ocean Drilling Program), 497–505. https://doi.org/10.2973/odp.proc.ir.160.115.1996
Sager, W.W., Clark, R.W., and Carvallo, C., 2018. Data report: paleomagnetic direction measurements on Expedition 352 igneous core samples. In Reagan, M.K., Pearce, J.A., Petronotis, K.E., and the Expedition 352 Scientists, Izu-Bonin-Mariana Fore Arc. Proceedings of the International Ocean Discovery Program, 352: College Station, TX (International Ocean Discovery Program). https://doi.org/10.14379/iodp.proc.352.202.2018
Zijderveld, J.D.A., 1967. AC demagnetization of rocks: analysis of results. In Collinson, D.W., Creer, K.M., and Runcorn, S.K. (Eds.), Developments in Solid Earth Geophysics (Volume 3): Methods in Palaeomagnetism: Amsterdam (Elsevier), 254–286. https://doi.org/10.1016/B978-1-4832-2894-5.50049-5
1 Sager, W.W., Bridges, J.D., and Carvallo, C., 2018. Data report: paleomagnetic direction measurements on Oligocene sediments from Hole U1439A, Izu-Bonin-Mariana fore arc. In Reagan, M.K., Pearce, J.A., Petronotis, K.E., and the Expedition 352 Scientists, Izu-Bonin-Mariana Fore Arc. Proceedings of the International Ocean Discovery Program, 352: College Station, TX (International Ocean Discovery Program). https://doi.org/10.14379/iodp.proc.352.203.2018
2 Department of Earth and Atmospheric Sciences, University of Houston, USA. Correspondence author: wwsager@uh.edu
3 Present address: Department of Earth and Environment Sciences, University of Rochester, USA.
4 Institut de Minéralogie et de Physique des Milieux Condensés, Université Pierre et Marie Curie, France.
This work is distributed under the Creative Commons Attribution 4.0 International (CC BY 4.0) license. 
Data report: paleomagnetic direction measurements on Oligocene sediments
PDF Download figures Download tables Cited by